. 2018 Jun 21:3:23.
doi: 10.1038/s41541-018-0062-8. eCollection 2018.

Long-term reduction in hyperglycemia in advanced type 1 diabetes: the value of induced aerobic glycolysis with BCG vaccinations

Affiliations

Long-term reduction in hyperglycemia in advanced type 1 diabetes: the value of induced aerobic glycolysis with BCG vaccinations

Willem M Kühtreiber et al. NPJ Vaccines. .

Abstract

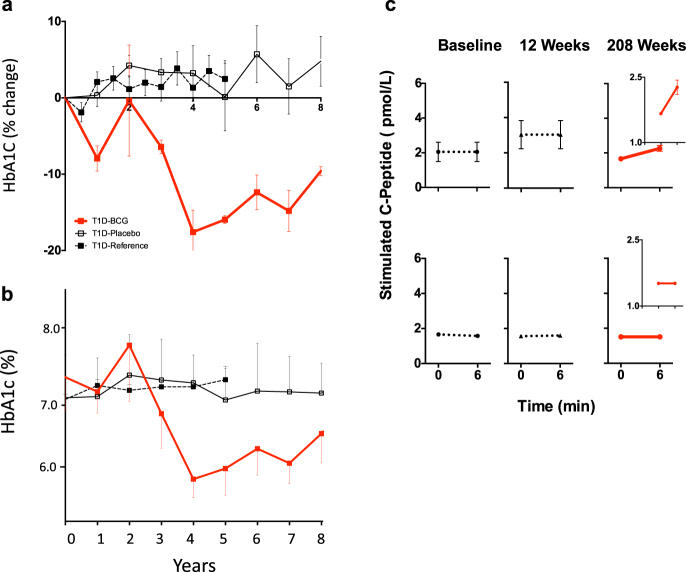
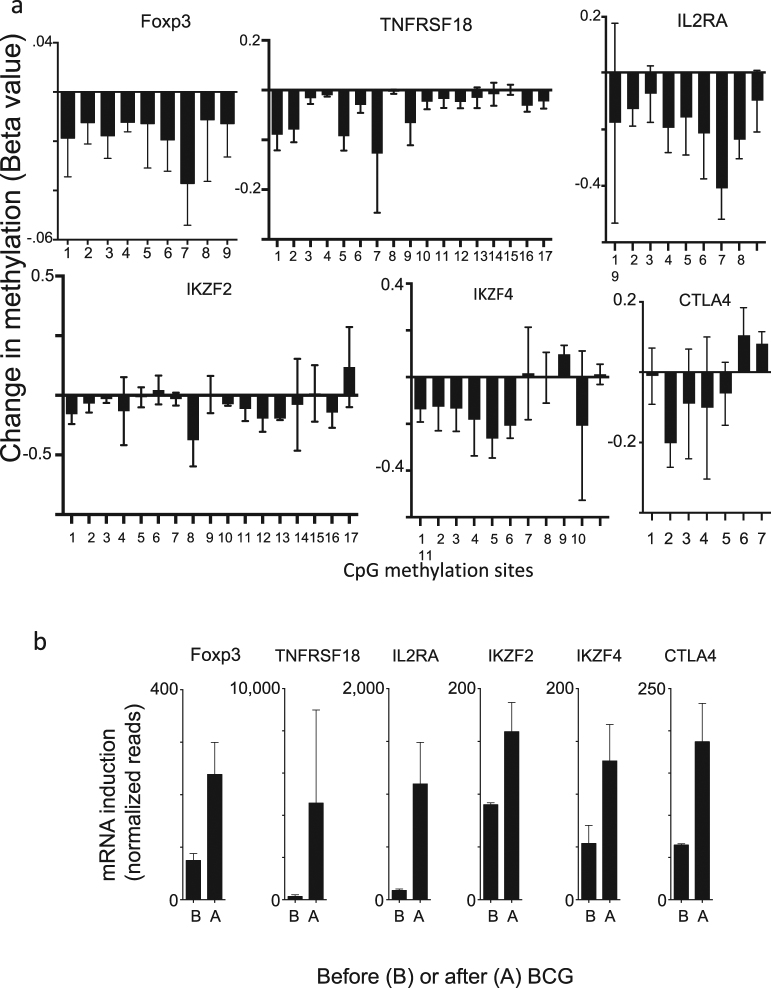
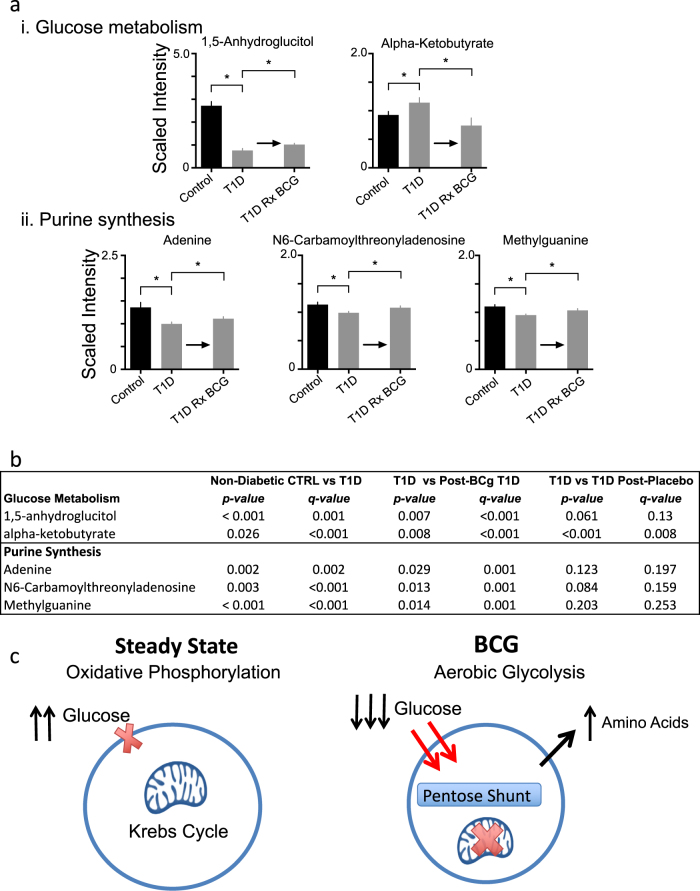
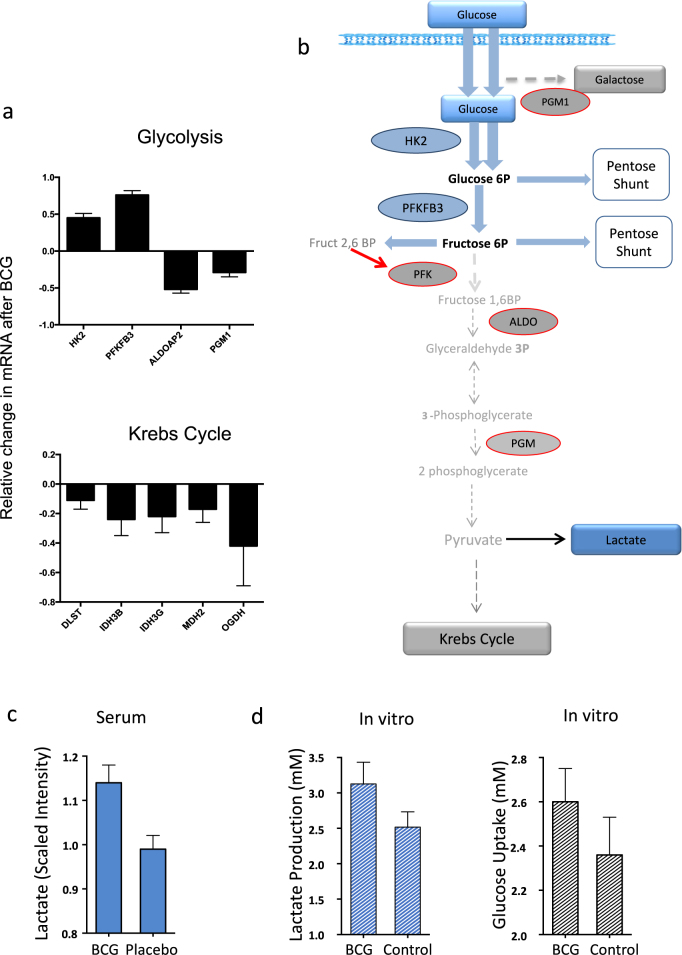
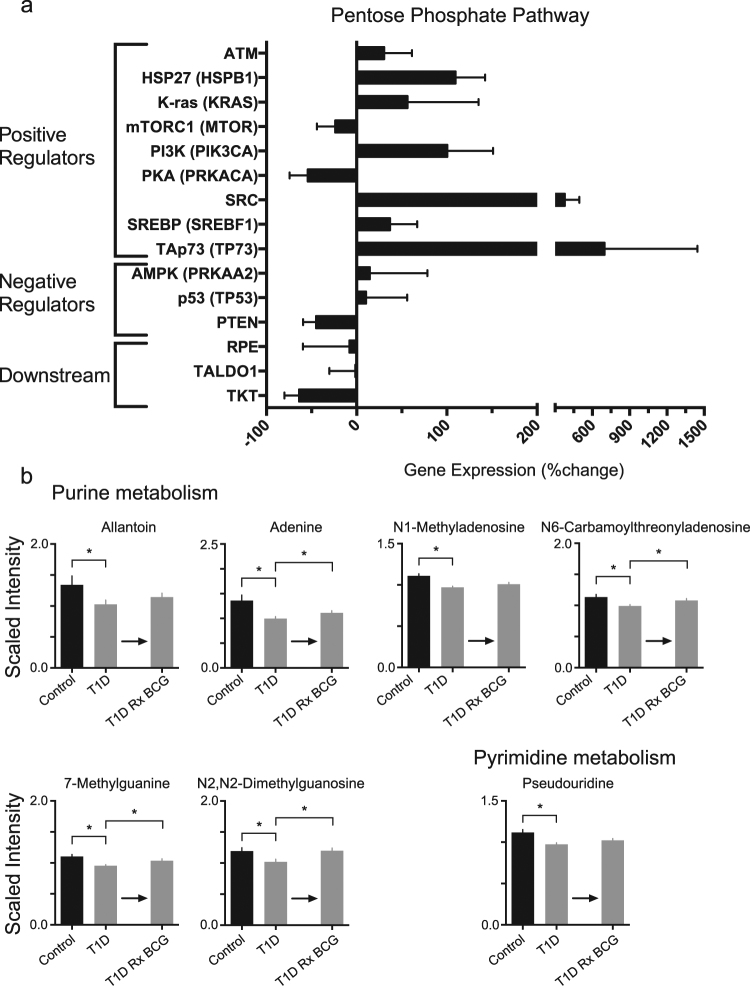
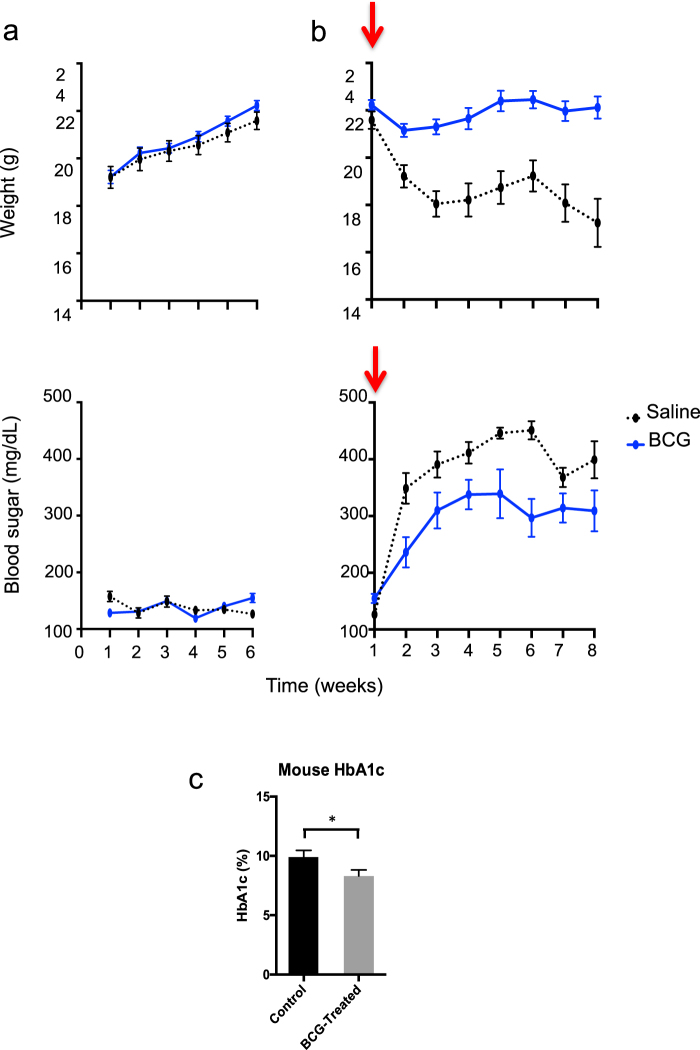
Mycobacterium are among the oldest co-evolutionary partners of humans. The attenuated Mycobacterium bovis Bacillus Calmette Guérin (BCG) strain has been administered globally for 100 years as a vaccine against tuberculosis. BCG also shows promise as treatment for numerous inflammatory and autoimmune diseases. Here, we report on a randomized 8-year long prospective examination of type 1 diabetic subjects with long-term disease who received two doses of the BCG vaccine. After year 3, BCG lowered hemoglobin A1c to near normal levels for the next 5 years. The BCG impact on blood sugars appeared to be driven by a novel systemic and blood sugar lowering mechanism in diabetes. We observe a systemic shift in glucose metabolism from oxidative phosphorylation to aerobic glycolysis, a state of high glucose utilization. Confirmation is gained by metabolomics, mRNAseq, and functional assays of cellular glucose uptake after BCG vaccinations. To prove BCG could induce a systemic change to promote accelerated glucose utilization and impact blood sugars, murine data demonstrated reduced blood sugars and aerobic induction in non-autoimmune mice made chemically diabetic. BCG via epigenetics also resets six central T-regulatory genes for genetic re-programming of tolerance. These findings set the stage for further testing of a known safe vaccine therapy for improved blood sugar control through changes in metabolism and durability with epigenetic changes even in advanced Type 1 diabetes.


Conflict of interest statement

The authors declare no competing interests.

Figures

Fig. 1
Fig. 1
Long-term improvement of glycemic control in T1Ds after BCG treatment. a, b Glucose control was tracked through measurements of HbA1c. HbA1c levels in the control T1D groups (saline-treated placebo group n = 3 or the untreated reference group n = 40) remained unchanged over the 8-year observation period (placebo) or 5-year observation period (untreated reference group) as measured by a % change (a) or as raw HbA1c values (b) (p = 0.73). The percentage change was calculated from pre-trial values to post-trial values measured every 6 months or yearly. In contrast, a decrease in HbA1c for the 8 year long followed BCG-treated patients uniformly occurred after year 03 and thereafter showed sustained lowering, with an 18% decrease from baseline at year 04. After the drop in HbA1c values in the BCG-treated group, HbA1c values remained lower for the next 5 years of monitoring and was statistically different from placebo (p = 0.0002 at year 8) and from reference subjects (p = 0.02 at year 5). In short, relative (percent) change rate of HbA1c was compared using the linear mixed effects model with subject-level random effects. The change rates in the control, placebo and BCG groups were compared based on the statistical significance of the interaction term between time and group indicator in the linear mixed effects model. The subject traits and sample sizes are given in Supplementary Figure S1a, S1b. c An in vivo glucagon stimulation test was performed to induce pancreatic insulin secretion as measured with C-peptide assays at trial enrollment (baseline), at 12 weeks and at 208 weeks after two BCG vaccinations in 6 T1D subjects (Supplementary Table S1b—8 year long treated subjects). The BCG-treated patients showed a clinically negligible, but statistically significant, return of stimulated serum C-peptide levels upon glucagon administration only at 208 weeks (upper panel), whereas the C-peptide response to glucagon in the reference-T1D and placebo-T1D groups remained unchanged (lower panel). For the glucagon stimulation test statistics, we used the Wilcoxon Signed Rank test. On all 8 year followed subjects with the data presented at year 04 i.e., 208 weeks. Figure inserts at 208 weeks after treatment highlight the minor changes and the standard error bars
Fig. 2
Fig. 2
BCG treatment reduces DNA methylation and upregulates expression of Treg signature genes. a CD4 T cells were isolated from T1D patients before and after BCG treatment (n = 3 subjects; Supplementary Table S1a). DNA was isolated, bisulfite converted and analyzed on the Illumina Infinium HumanMethylation 450 BeadChip array. The data shows that after BCG treatment all six Treg signature genes are demethylated at multiple CpG methylation sites. For a table of the CpG sites used please see Supplementary Table S3. This data compares the methylation state in BCG-treated diabetics 8 weeks after administration of the two BCG vaccines against their pre-treatment baseline. For the Foxp3 gene, all nine methylation sites on the BeadChip were significantly demethylated after BCG treatment (FDR adjusted p = 0.004). For the TNFRSF18 gene (also known as GITR receptor), 16 out of 17 methylation sites on the Beadchip were demethylated after BCG and one site was unchanged (FDR adjusted p = 0.0008). For the IL2RA gene all 9 methylation sites on the chip showed decreases in methylation after BCG treatment (FDR adjusted p = 0.003). For the IKZF2 gene, also known as IKAROS family zinc finger 2 (Helios), there are 17 sites on the chip. After BCG treatment, 13 of those sites were de-methylated, 1 site showed augmented methylation, and 3 sites were unchanged. Overall, demethylation of the IKZF2 sites after BCG treatment was not statistically significant with FDR adjusted p = 0.106. For the IKZF4 gene, also known as IKAROS family zinc finger 4 (Eos), there are 11 methylation sites represented on the chip. After BCG treatment, 8 sites were de-methylated and 3 sites showed augmented methylation. Overall the IKZF4 sites were significantly demethylated after BCG treatment (FDR adjusted p = 0.038). For the CTLA4 gene, there were 7 sites represented on the chip. After BCG treatment, 5 sites were demethylated and 2 sites showed increases in methylation. Overall there was no significant difference in CTLA4 sites before and after BCG treatment (FDR adjusted p = 0.509). This data is from 3 subjects receiving BCG therapy (Supplementary Table S1a). b RNA was isolated from PBLs of three T1D before and after in vitro culture with BCG for 48 h and analyzed using RNAseq or transcription profiling. BCG treatment caused a sharp increase in the amount of mRNA as expressed by the number of RNAseq reads for each of the six Treg signature genes that promote Treg function and correlated with the de-methylation patterns
Fig. 3
Fig. 3
BCG treatment switches cellular metabolism from oxidative phosphorylation to early aerobic glycolysis. a, b Metabolomic comparisons of the relative levels of intermediates of glucose metabolism and purine synthesis for non-diabetic controls, untreated T1D subjects and T1D patients after treatment with BCG or placebo (sampled biweekly from week 7 to 20 and then yearly through year 5). The results indicate that glucose metabolism is shifted towards aerobic glycolysis in the BCG treated T1D. Asterisks indicate statistically significant differences, which are listed in Fig. 3b. For all metabolomics data, we used an unpaired one-tail Student’s t-test that was then corrected for the multiple comparisons with p and q values. p values are given in Fig. 3b. Note that q values maintained significance for the T1D results for the BCG treated cohorts. c The systemic lowering of blood sugars in T1Ds after BCG vaccines combined with the increased glucose uptake and purine synthesis is consistent with BCG switching cellular metabolism to early aerobic glycolysis. This hypothesis holds that BCG causes downregulation of the Krebs cycle, accelerated aerobic glycolysis, increased glucose uptake, and shunting of glucose to the Pentose Phosphate Shunt for augmented purine biosynthesis
Fig. 4
Fig. 4
Analysis of mRNA expression and of Metabolites corroborates with the switch from the Krebs Cycle to augmented early aerobic glycolysis after BCG. a mRNA expression analysis of type 1 diabetic PBLs before and after BCG treatment in vitro. BCG causes upregulation of mRNA for early glycolysis (HK2, PFKB3), downregulation for late glycolysis (ALDOAP2, PGM1), and a strong downregulation of mRNA for late Krebs cycle steps (bottom). p and q values for the genes shown are HK2 (p = 0.049, q = 0.017), PFKB3 (p = 0.016, q = 0.017), ALDOAP2 (p = 0.113, q = 0.017), PGM1 (p = 0.022, q = 0.017), DLST (p = 0.074, q = 0.017), IDH3B (p = 0.084, q = 0.017), IDH3G (p = 0.084, q = 0.017), MDH2 (p = 0.090, q = 0.017) and OGDH (p = 0.070, q = 0.017). Combined p values for the Krebs cycle genes using Fisher’s method is 0.005. b The schematic summarizes the normal pathway for glucose oxidation via the Krebs cycle and the connecting nodes to the Pentose Phosphate Shunt. Blue rectangles and blue ovals represent upregulated metabolites and mRNA, respectively, after BCG. Gray rectangles and gray ovals represent downregulated metabolites and mRNA, respectively, after BCG. Three BCG-treated T1D subjects were studied. Bars on Fig. 4a, c, d depict SD. The blue shading in Fig. 4b represents the upregulated mRNAs (ovals) and metabolites (rectangles). c Serum lactate levels in Phase 1 BCG-treated vs. placebo patients as determined by Metabolon’s GC/HPLC and MassSpec platform one year after treatment. Lactate levels were significantly higher in the BCG-treated patients than placebo-treated patients (p = 0.001 and q = 0.003) (data from subjects represented in Supplementary Table S1e). d Cultured CD4 cells from T1D subjects in the presence or absence of BCG for 48 h (n = 25 paired samples) showed both augmented lactate production and accelerated glucose uptake. A short 4-hour collection time of media from either glucose uptake or for lactate secretion after 48 h of BCG or media exposures (control) showed significantly more lactate production after BCG exposures (p = 0.025, n = 25) and accelerated glucose consumption (p = 0.02, n = 27) as compared to control lymphocytes that were cultured without BCG
Fig. 5
Fig. 5
Effect of BCG on induction of the Pentose Phosphate shunt pathway and resulting purine and pyrimidine synthesis. a mRNA expression analysis of T1D PBLs treated in vitro with BCG. The graph shows the percent change in gene expression before vs. after in vitro treatment with BCG for 48 h. Positive regulators are mostly upregulated, whereas negative regulators and downstream mediators are mostly downregulated. Three BCG-treated T1D subjects were studied. Bars on the Fig. 5 represent means + /− SEM. Fisher’s Method combined p-value for the positive regulators is 0.005. The p-values for PTEN in the negative regulators and for TKT in the downstream regulators are almost significant at 0.06 and 0.08, respectively. b In vivo metabolomics data of BCG-treated T1D supports the BCG-induced utilization of the Pentose Phosphate Shunt and shows that purine and pyrimidine metabolism are upregulated after BCG treatment. This is consistent with accelerated pentose shunt utilization. Data shows metabolite levels in serum from CTRL (non-diabetic controls) (n = 25), T1D subjects (n = 50) and post-BCG T1D (n = 3 subjects after treatment with two BCG vaccinations). The asterisks represents statistical differences of <0.05; actual statistical values for both p and q values are given in Supplementary Table S4
Fig. 6
Fig. 6
BCG pre-administration reduces hyperglycemia in chemically-induced (Streptozocin) mice but does not induce hypoglycemia in normal mice. a Normal BALB/c mice were first studied in a normoglycemic state with (n = 12) and without BCG (n = 12) treatment for blood sugars and weight (left panels). BALB/c mice were rendered chemically diabetic (arrows) and studied with and without BCG treatment six weeks earlier with preventative pre-injections (right panels). Most mice became severely hyperglycemic after treatment with streptozocin (STZ) which selectively kills the insulin-secreting cells in the pancreas. All mice were monitored for blood sugar levels and weighed on a weekly basis. BCG-treated mice gained weight at the same rate as untreated control mice and had normal blood sugars with no indication of hypoglycemia (left panels, blue lines). After STZ induction of hyperglycemia, the control mice rapidly started to lose weight and became severely hyperglycemic within one week (right, black lines). In contrast, mice first treated with BCG before STZ treatment were able to maintain their weight and had markedly lower levels of hyperglycemia (right, blue line). b Measurements of HbA1c values in STZ-treated BALB/c mice after 6 weeks with and without prior BCG treatment show the protection afforded by BCG and the resulting lower HbA1c values of 85 ± 6.6 mmol/mol (9.9 ± 0.6% NGSP) without BCG vs. 67 ± 5.5 mmol/mol (8.3 ± 0.5% NGSP) with BCG treatment; p = 0.02, n = 19 surviving mice). c At 8 weeks after the induction of hyperglycemia, the BCG-treated mice had statistically lowered HbA1c values

Comment in

References

    1. Comas I, et al. Out-of-Africa migration and neolithic coexpansion of Mycobacterium tuberculosis with modern humans. Nat. Genet. 2013;45:1176–1182. doi: 10.1038/ng.2744. - DOI - PMC - PubMed
    1. Barnes I, Duda A, Pybus OG, Thomas MG. Ancient urbanization predicts genetic resistance to tuberculosis. Evolution. 2011;65:842–848. doi: 10.1111/j.1558-5646.2010.01132.x. - DOI - PubMed
    1. Faustman, D. L. The Value of BCG and TNF in Autoimmunity. 1st edn, (Academic Press, 2014).
    1. Faustman DL, et al. Proof-of-concept, randomized, controlled clinical trial of Bacillus-Calmette-Guerin for treatment of long-term type 1 diabetes. PLoS One. 2012;7:e41756. doi: 10.1371/journal.pone.0041756. - DOI - PMC - PubMed
    1. Ristori G, et al. Effects of Bacille Calmette-Guerin after the first demyelinating event in the CNS. Neurology. 2014;82:41–48. doi: 10.1212/01.wnl.0000438216.93319.ab. - DOI - PMC - PubMed