. 2018 Jun 4:5:50.
doi: 10.3389/fmolb.2018.00050. eCollection 2018.

Benchmarking cryo-EM Single Particle Analysis Workflow

Affiliations

Benchmarking cryo-EM Single Particle Analysis Workflow

Laura Y Kim et al. Front Mol Biosci. .

Abstract

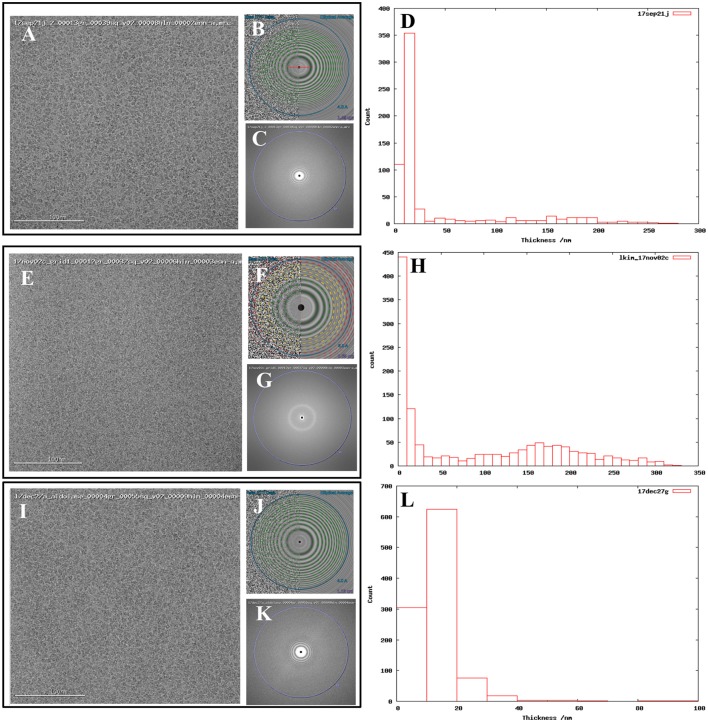
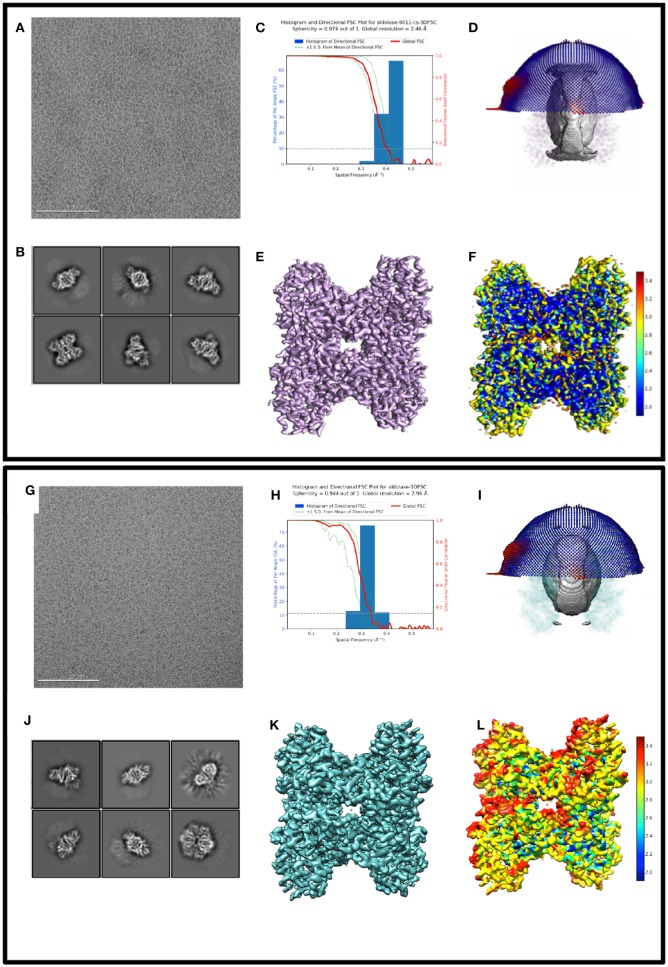
Cryo electron microscopy facilities running multiple instruments and serving users with varying skill levels need a robust and reliable method for benchmarking both the hardware and software components of their single particle analysis workflow. The workflow is complex, with many bottlenecks existing at the specimen preparation, data collection and image analysis steps; the samples and grid preparation can be of unpredictable quality, there are many different protocols for microscope and camera settings, and there is a myriad of software programs for analysis that can depend on dozens of settings chosen by the user. For this reason, we believe it is important to benchmark the entire workflow, using a standard sample and standard operating procedures, on a regular basis. This provides confidence that all aspects of the pipeline are capable of producing maps to high resolution. Here we describe benchmarking procedures using a test sample, rabbit muscle aldolase.

Keywords: alignment; benchmarking; cryo-electron microscopy; resolution; single particle workflow; structural biology.


Figures

Figure 1
Figure 1
Comparing images from thick vs. thin ice. Exemplary images from (A) 17sep21j (#1), (E) 17nov02c (#2), and (I) 17dec27a (#3) datasets. Quantitative metrics such as the estimation of resolution from CTFFindV4 (B,F,J) and qualitative metrics such as the presence/absence of the water diffraction ring around the 3 Å mark (C,G,K), and ice thickness measurements of the micrographs (D,H,L), should be monitored during data collection. A CTFFindV4 resolution estimation worse than 4 Å and the presence of a strong water diffraction ring are both indicative of thick ice, and areas like this should be avoided. All images were acquired with ~1.5 mm defocus. Ice thickness measurements provide a useful metric for data quality (D,H,L). Datasets 17sep21j and 17dec27a both contain a majority of images where ice thickness is in the range 0–20 nm. The majority of 17nov02c images have thickness in the range 0–10 nm (ice that is too thin or completely absent) or very thick ice in the range 100–250 nm. The dimensions of aldolase are ~100 Å so this thick ice is more than 20 times more than the longest dimension of the particle.
Figure 2
Figure 2
Comparing 3D reconstructions from thick vs. thin ice 2D and 3D processing results from 17sep21j (dataset #1) and 17nov02c (dataset #2) which yielded maps at 2.5 and 3.0 Å resolution, respectively. Dataset #1 has thinner ice in the raw micrographs, ranging from 10 to 20 nm thick, whereas dataset #2 has thicker ice, ranging from 100 to 250 nm thick. Data to assess include raw micrographs (A,G), 2D classifications (B,J), FSC plots (C,H), sphericity plots (D,I), 3D maps (E,K), and local resolution maps (F,L). Both datasets have about 200,000 particles contributing to the final refinement but dataset #1 is both qualitatively and quantitatively better than dataset #2.

References

    1. Arnold S. A., Albiez S., Bieri A., Syntychaki A., Adaixo R., McLeod R. A., et al. . (2017). Blotting-free and lossless cryo-electron microscopy grid preparation from nanoliter-sized protein samples and single-cell extracts. J. Struct. Biol. 197, 220–226. 10.1016/j.jsb.2016.11.002 - DOI - PubMed
    1. Banerjee S., Bartesaghi A., Merk A., Rao P., Bulfer S. L., Yan Y., et al. . (2016). 2.3 Å resolution cryo-EM structure of human p97 and mechanism of allosteric inhibition. Science 351, 871–875. 10.1126/science.aad7974 - DOI - PMC - PubMed
    1. Bartesaghi A., Merk A., Banerjee S., Matthies D., Wu X., Milne J. L., et al. . (2015). 2.2 Å resolution cryo-EM structure of β-galactosidase in complex with a cell-permeant inhibitor. Science 348, 1147–1151. 10.1126/science.aab1576 - DOI - PMC - PubMed
    1. Campbell M. G., Kearney B. M., Cheng A., Potter C. S., Johnson J. E., Carragher B., et al. . (2014). Near-atomic resolution reconstructions using a mid-range electron microscope operated at 200 kV. J. Struct. Biol. 188, 183–187. 10.1016/j.jsb.2014.09.008 - DOI - PMC - PubMed
    1. Campbell M. G., Veesler D., Cheng A., Potter C. S., Carragher B. (2015). 2.8 Å resolution reconstruction of the Thermoplasma acidophilum 20S proteasome using cryo-electron microscopy. Elife 4:e06380. 10.7554/eLife.06380 - DOI - PMC - PubMed

LinkOut - more resources