

Instrumental variable analysis in the presence of unmeasured confounding
- PMID: 29951504
- PMCID: PMC5994515
- DOI: 10.21037/atm.2018.03.37
Instrumental variable analysis in the presence of unmeasured confounding
Abstract
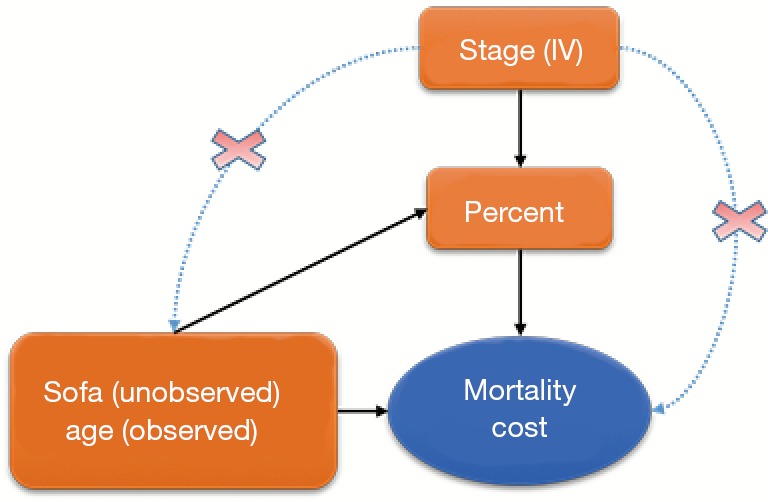
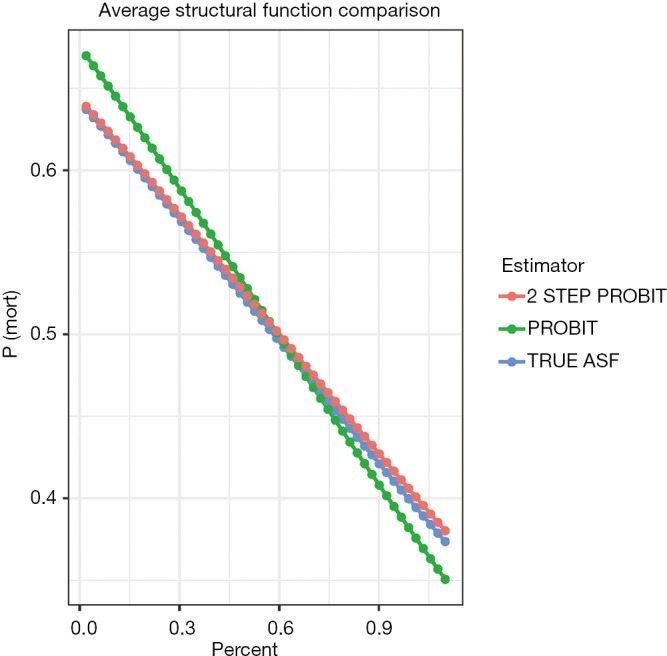
Observational studies are prone to bias due to confounding either measured or unmeasured. While measured confounding can be controlled for with a variety of sophisticated methods such as propensity score-based matching, stratification and multivariable regression model, the unmeasured confounding is usually cumbersome, leading to biased estimates. In econometrics, instrumental variable (IV) is widely used to control for unmeasured confounding. However, its use in clinical researches is generally less employed. In some subspecialties of clinical medicine such as pharmacoepidemiological research, IV analysis is increasingly used in recent years. With the development of electronic healthcare records, more and more healthcare data are available to clinical investigators. Such kind of data are observational in nature, thus estimates based on these data are subject to confounding. This article aims to review several methods for implementing IV analysis for binary and continuous outcomes. R code for these analyses are provided and explained in the main text.
Keywords: Instrumental variable (IV); confounding; probit regression; two-stage least square.
Conflict of interest statement
Conflicts of Interest: The authors have no conflicts of interest to declare.
Figures
References
-
- Grobbee DE, Hoes AW. Clinical Epidemiology: Principles, Methods, And Applications For Clinical Research. 1st edition. Jones & Bartlett Learning, 2008.
-
- Angrist JD, Imbens GW. Identification and Estimation of Local Average Treatment Effects. Cambridge, MA: National Bureau of Economic Research, 1995.
-
- Uddin MJ, Groenwold RH, Ali MS, et al. Methods to control for unmeasured confounding in pharmacoepidemiology: an overview. Int J Clin Pharm 2016;38:714-23. - PubMed
-
- Klungel OH, Jamal Uddin M, de Boer A, et al. Instrumental Variable Analysis in Epidemiologic Studies: An Overview of the Estimation Methods. Pharm Anal Acta 2015;6:353.
Publication types
LinkOut - more resources
Full Text Sources
Other Literature Sources