

Egg product freshness evaluation: A metabolomic approach
- PMID: 29952040
- PMCID: PMC6767415
- DOI: 10.1002/jms.4256
Egg product freshness evaluation: A metabolomic approach
Abstract
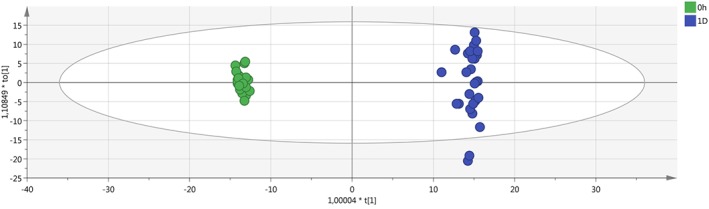
Egg products' freshness is a crucial issue for the production of safe and high-quality commodities. Up to now, this parameter is assessed with the quantification of few compounds, but the possibility to evaluate more molecules simultaneously could help to provide robust results. In this study, 31 compounds responsible of freshness and not freshness of egg products were selected with a metabolomic approach. After an ultrahigh-pressure liquid chromatography-high-resolution mass spectrometry (UHPLC-HRMS) analysis, different chemometric models were created to select gradually the most significant features that were finally extracted and identified through HRMS data. Sample lots were collected directly from their arrival at the production plant sites, extracted immediately after, then left at room temperature, and extracted again after 24 and 48 hours (first day and second day, respectively). A total amount of 79 samples was used for the model creation. Furthermore, the same compounds were detected in seven new egg products sample lots not used for the model creation and treated with the same experimental design (total amount of samples, 21). The results obtained clearly demonstrate that these 31 molecules can be considered real freshness or not freshness chemical markers. Furthermore, this UHPLC-HRMS metabolomic approach allows for the detection of a larger set of metabolites clearly related to possible microbial growth over time, which is a relevant point for also ensuring food safety.
Keywords: LC-HRMS; egg product; freshness; metabolomics; nontargeted mass spectrometry.
© 2018 John Wiley & Sons, Ltd.
Figures


References
-
- D.L. no. 65 , February 1993. Italian Legislation reception of European Union ‐ https://www.tuttocamere.it/files/attivita/1993_65.pdf
-
- Eurpean Regulation Reg . CE 853/2004 ‐ http://eur‐lex. europa.eu/legal‐content/IT/TXT/?uri=LEGISSUM%3Af84002
-
- Li J, Zhu S, Jiang S, Wang J. Prediction of egg storage time and yolk index based on electronic nose combined with chemometric methods. LWT ‐ Food Sci Technol. 2017;82:369‐376.
-
- Suman M, Riani G, Dalcanale E. MOS‐based artificial olfactory system for the assessment of egg products freshness. Sens Actuators B, Chemical. 2007;125(1):40‐47.
MeSH terms
Substances
Grants and funding
LinkOut - more resources
Full Text Sources
Other Literature Sources
