. 2018 Aug 21;14(31):6431-6438.
doi: 10.1039/c8sm00751a. Epub 2018 Jun 28.

Microrheology of DNA hydrogel gelling and melting on cooling

Affiliations

Microrheology of DNA hydrogel gelling and melting on cooling

Javier Fernandez-Castanon et al. Soft Matter. .

Abstract

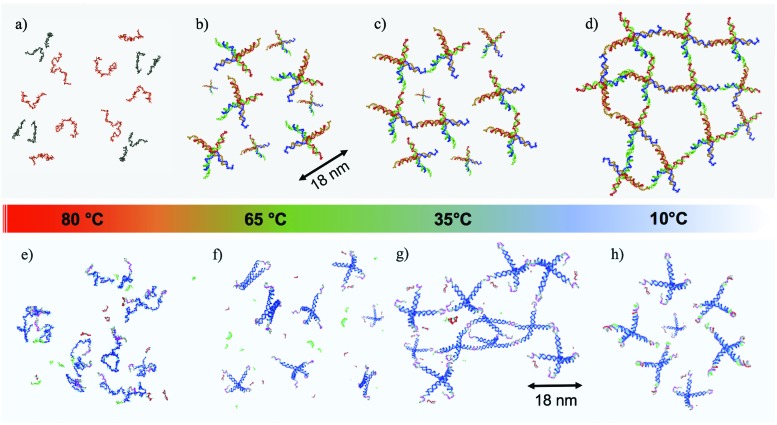
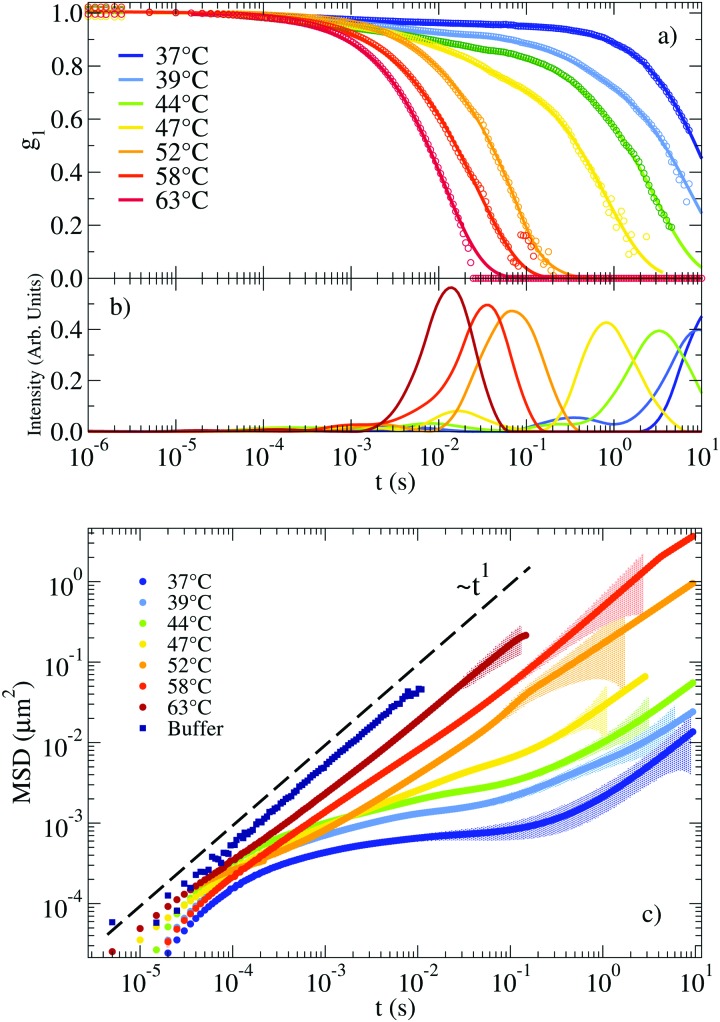
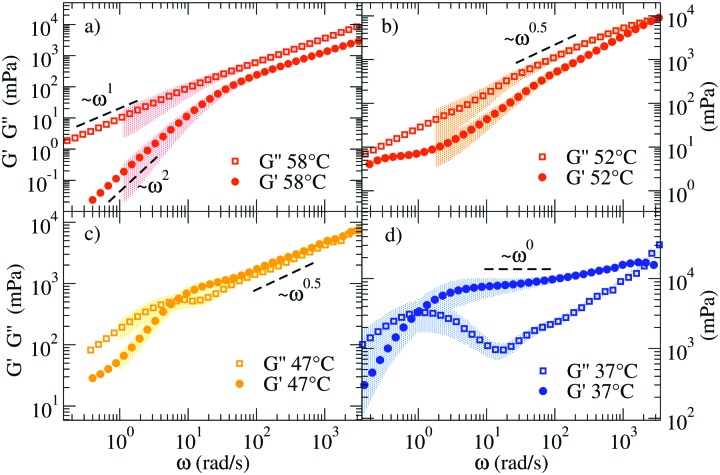
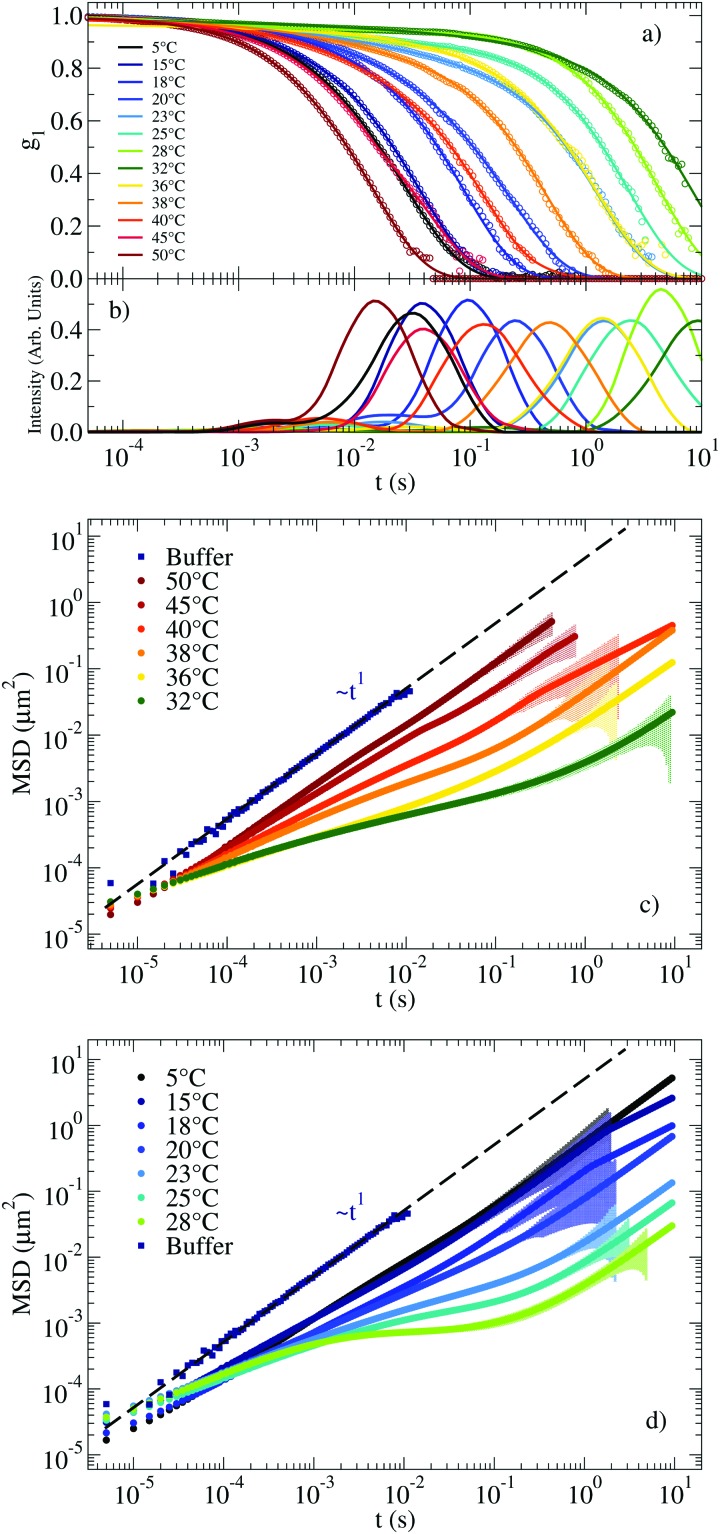
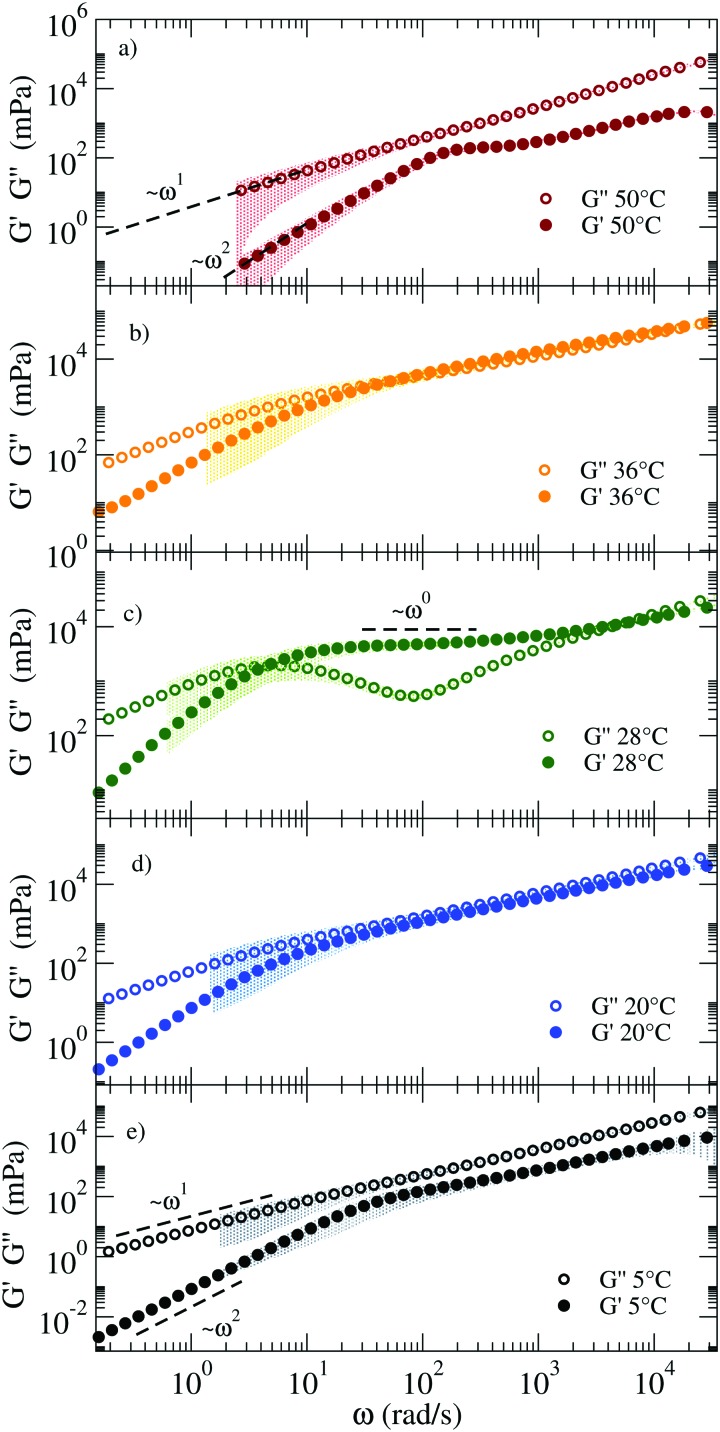
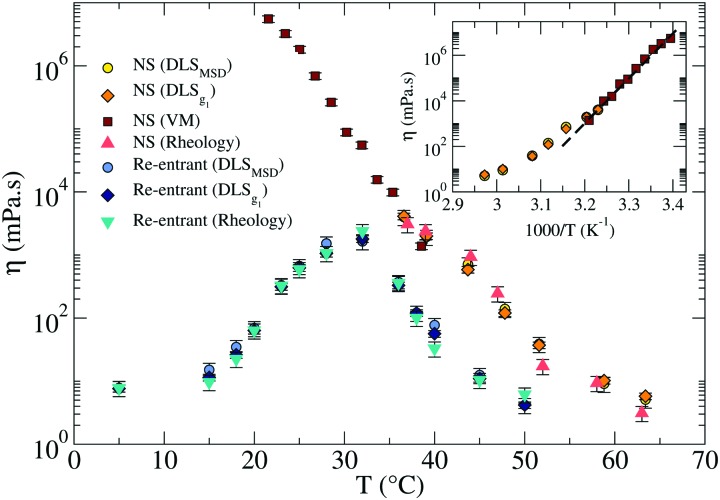
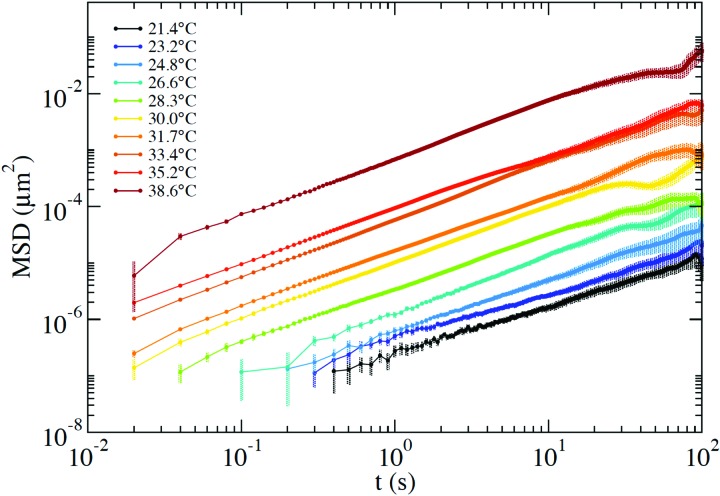
We present systematic characterisation by means of dynamic light scattering and particle tracking techniques of the viscosity and of the linear viscoelastic moduli, G'(ω) and G''(ω), for two different DNA hydrogels. These thermoreversible systems are composed of tetravalent DNA-made nanostars whose sticky sequence is designed to provide controlled interparticle bonding. While the first system forms a gel on cooling, the second one has been programmed to behave as a re-entrant gel, turning again to a fluid solution at low temperature. The frequency-dependent viscous and storage moduli and the viscosity reveal the different viscoelastic behavior of the two DNA hydrogels. Our results show how little variations in the design of the DNA sequences allow tuning of the mechanical response of these biocompatible all-DNA materials.


Figures

Fig. 1
Fig. 1. Self-assembly process, from high to low temperatures, both for the NS (a–d) and the RG (e–h) systems. (a and e) represent the very high temperature case, where all DNA sequences are not hybridized, remaining single-stranded in the buffer solution. When T is lowered down to ∼65 °C, the four strands (designed to self-assemble in tetrafunctional units both in the NS (b) and in the RG (f) systems) are now hybridised. In the RG case, the competitor sequences (in green and red colors) are still in solution in a non-hybridised state, being characterized by a lower melting temperature. At intermediate T ∼ 35 °C the NSs start to bind to each other via complementary sticky ends (c and g), resulting in both cases in the formation of a connected network. In the RG case the competitor sequences are still in single strand form. Finally, at low T the two systems behave differently. In the NS case (d) NSs form a fully bonded network with very long living inter-particle bonds (thus mimicking the behavior of a chemical gel). In the RG system, the competitors have displaced the bonds that were previously forming the network, creating a solution of freely diffusing particles.
Fig. 2
Fig. 2. (a) Autocorrelation functions measuring the motion of a probe particle immersed in a NS solution at a concentration of 248 μM. Experimental data is represented by circles. Solid lines indicate the result of applying CONTIN to the experimental g1(t). (b) Corresponding distribution of relaxation times as calculated from CONTIN. (c) Corresponding MSD of the probe particles (symbols). The coloured shadow backgrounds represent the statistical error calculated following Section V of the ESI. The errors are not shown for values ΔMSD(t)/MSD(t) > 1. The figure also shows for comparison the MSD of the same tracers dispersed in a buffer of H2O and 100 mM NaCl (see Section I of the ESI†).
Fig. 3
Fig. 3. Loss (G′′) and storage (G′) moduli of the NS system for (a) 58 °C, (b) 52 °C, (c) 47 °C, and (d) 37 °C. The coloured shadows indicate the error bars calculated according to Section V in ESI. Error bars are displayed only for ΔG′/G′ < 1 and ΔG′′/G′′ < 1.
Fig. 4
Fig. 4. (a) g1(t) measuring the motion of a probe particle dissolved in the RG hydrogel at a NS concentration of 110 μM. Experimental data is represented by circles and the result of applying CONTIN procedures is indicated with solid lines. (b) Corresponding distribution of relaxation times as calculated from CONTIN. (c) MSD for T ranging between 50 °C and 32 °C and (d) for T ranging between 28 °C and 5 °C. The coloured shadow backgrounds represent the statistical error calculated following Section V of the ESI. The errors are not shown for values ΔMSD(t) > MSD(t).
Fig. 5
Fig. 5. G′ and G′′ moduli of the RG system from high (top) to low (bottom) T, showing mechanical features characteristic of different states: (a) a fluid at 50 °C, (b) close to the percolation threshold at 36 °C, (c) a viscoelastic solid at 28 °C, again (d) close to percolation at 20 °C and (e) a fluid at 5 °C. The coloured shadows indicate the error bars calculated according to Section V in ESI.
Fig. 6
Fig. 6. Comparison of the viscosities η in the RG (light and dark blue, and turquoise symbols) and in the NS (red, dark and light orange, and yellow symbols) systems. The inset shows the Arrhenius plot for the NS system in the gel region (at T below the melting temperature). The dashed line represents the best fitting with an exponential Arrhenius-like function with an activation energy EA ≈ 105 kcal mol–1. The error bars are calculated as explained in Sections III and V of the ESI.
Fig. 7
Fig. 7. MSD measured via the PTM technique at T ranging from 21.4 °C up to 38.6 °C. The time-independent offset, which is affected by the finite exposure time and by tracking artefacts, has been subtracted from the curves. The error bars are computed as detailed in Section III of the ESI.

References

    1. Seeman N. C. Nature. 2003;421:427–431. - PubMed
    1. Zhang F., Nangreave J., Liu Y., Yan H. J. Am. Chem. Soc. 2014;136:11198–11211. - PMC - PubMed
    1. Liu W., Tagawa M., Xin H. L., Wang T., Emamy H., Li H., Yager K. G., Starr F. W., Tkachenko A. V., Gang O. Science. 2016;351:582–586. - PMC - PubMed
    1. Winfree E., Liu F., Wenzler L. A., Seeman N. C. Nature. 1998;394:539–544. - PubMed
    1. He Y., Chen Y., Liu H., Ribbe A. E., Mao C. J. Am. Chem. Soc. 2005;127:12202–12203. - PubMed

LinkOut - more resources