. 2018 Jul;125(4):486-511.
doi: 10.1037/rev0000101.

Chunking as a rational strategy for lossy data compression in visual working memory

Affiliations

Chunking as a rational strategy for lossy data compression in visual working memory

Matthew R Nassar et al. Psychol Rev. 2018 Jul.

Abstract

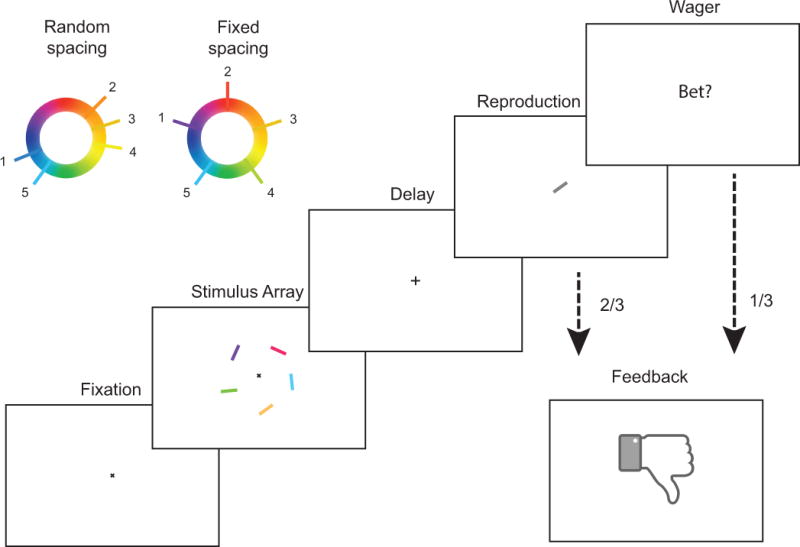
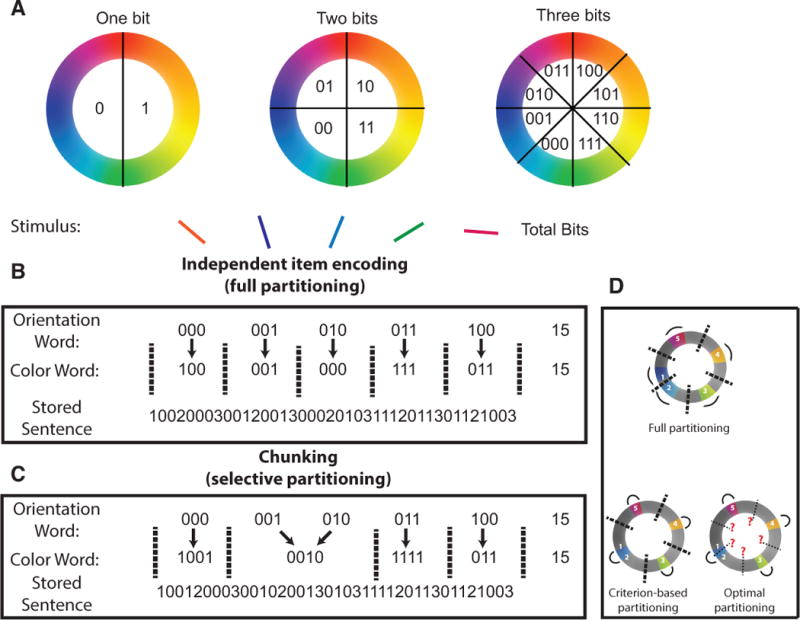
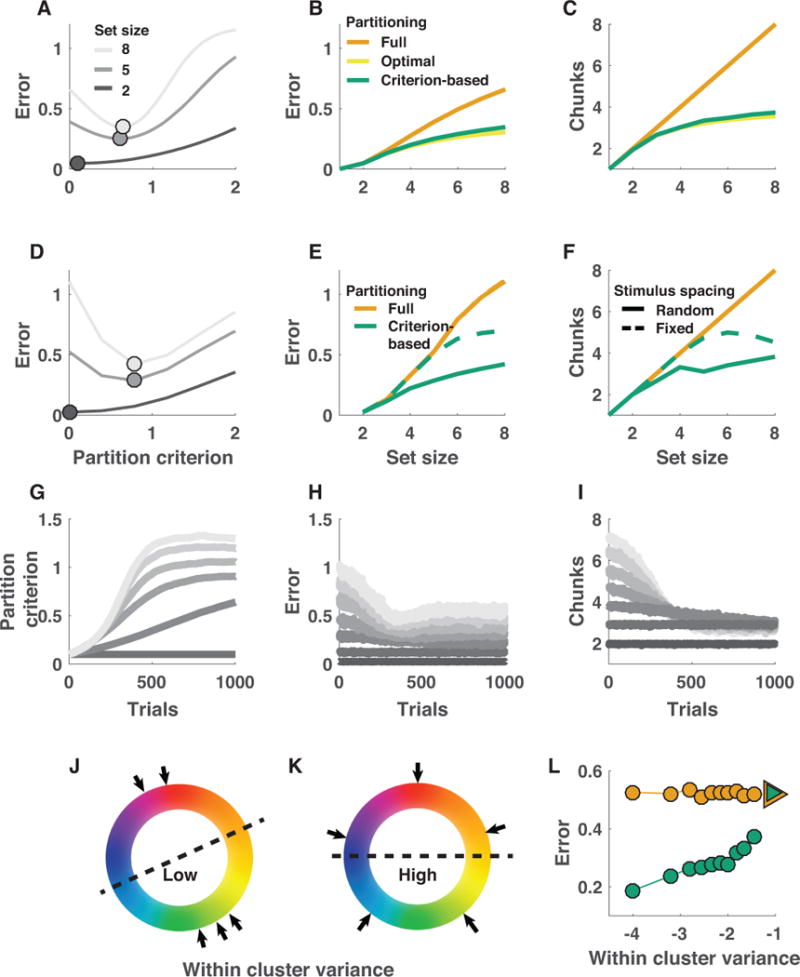
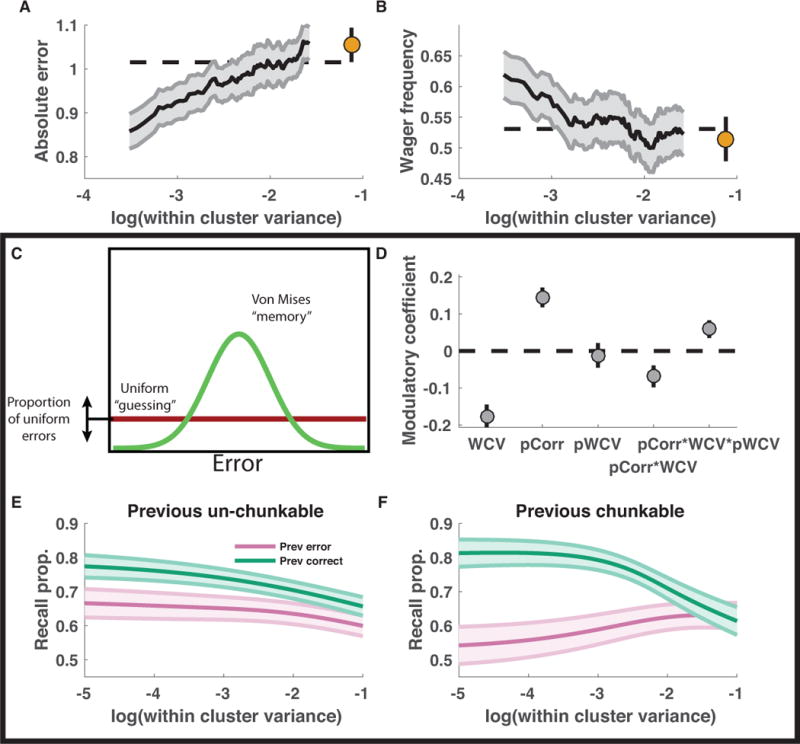
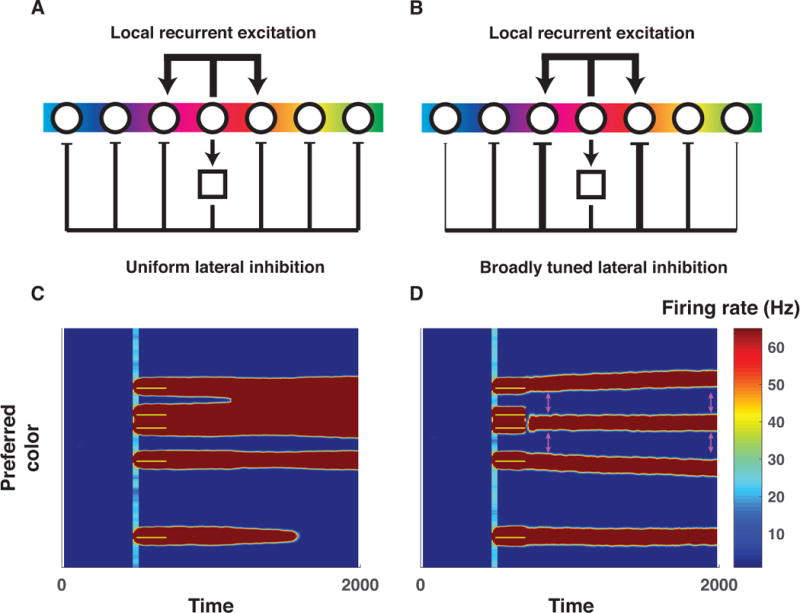
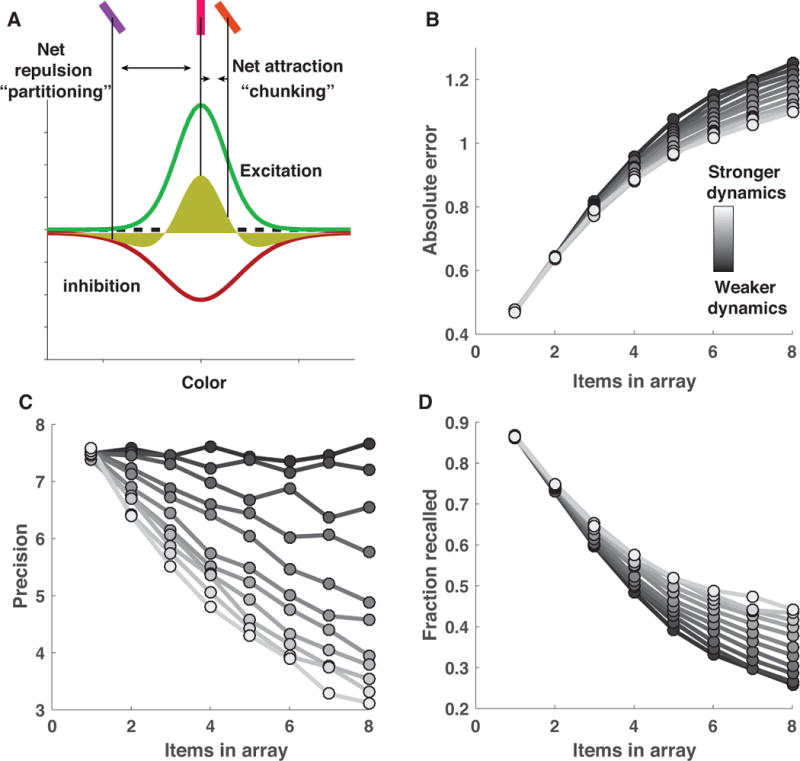
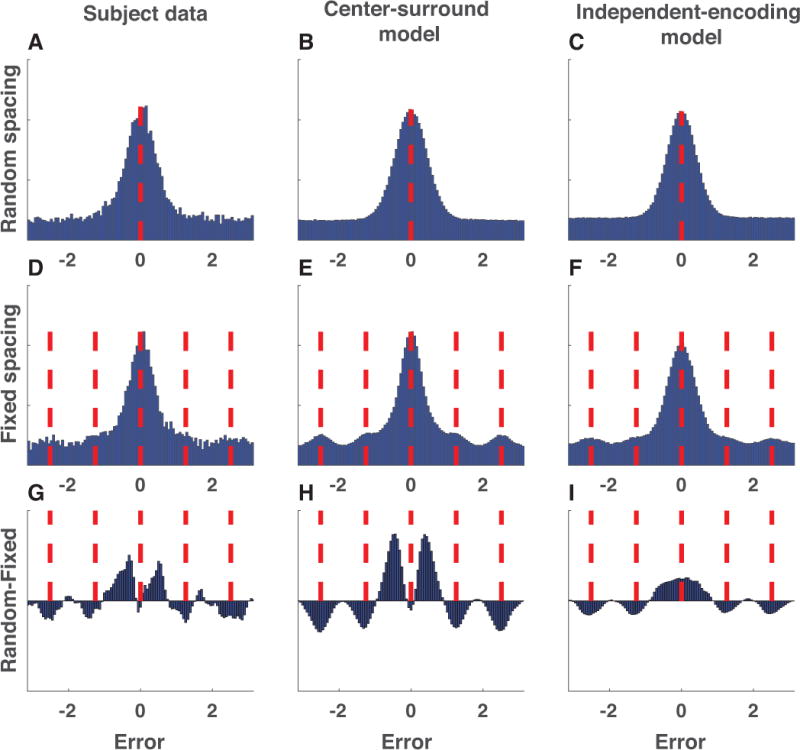
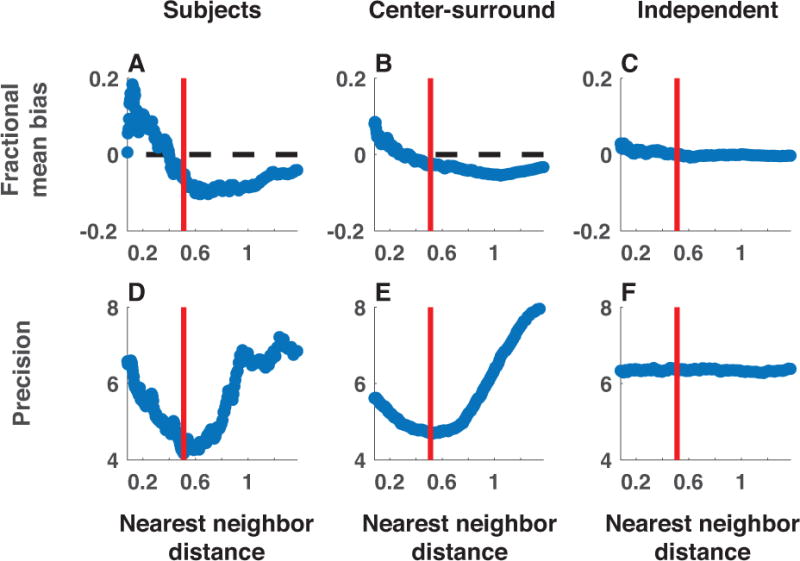
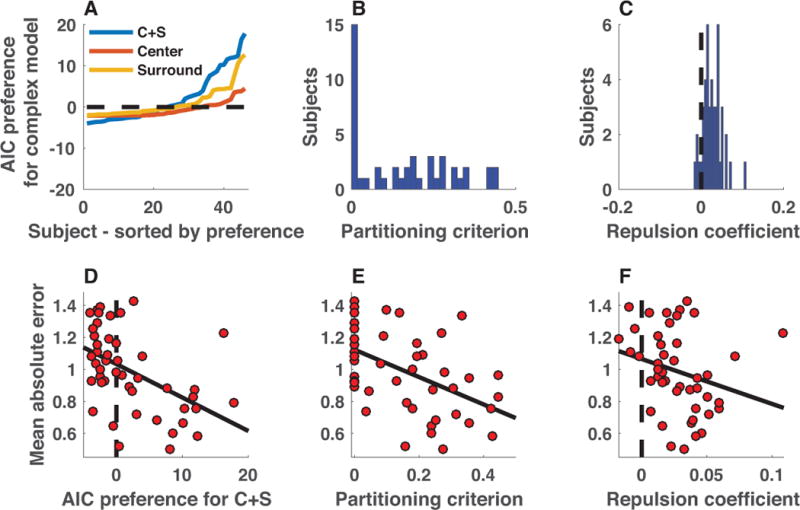
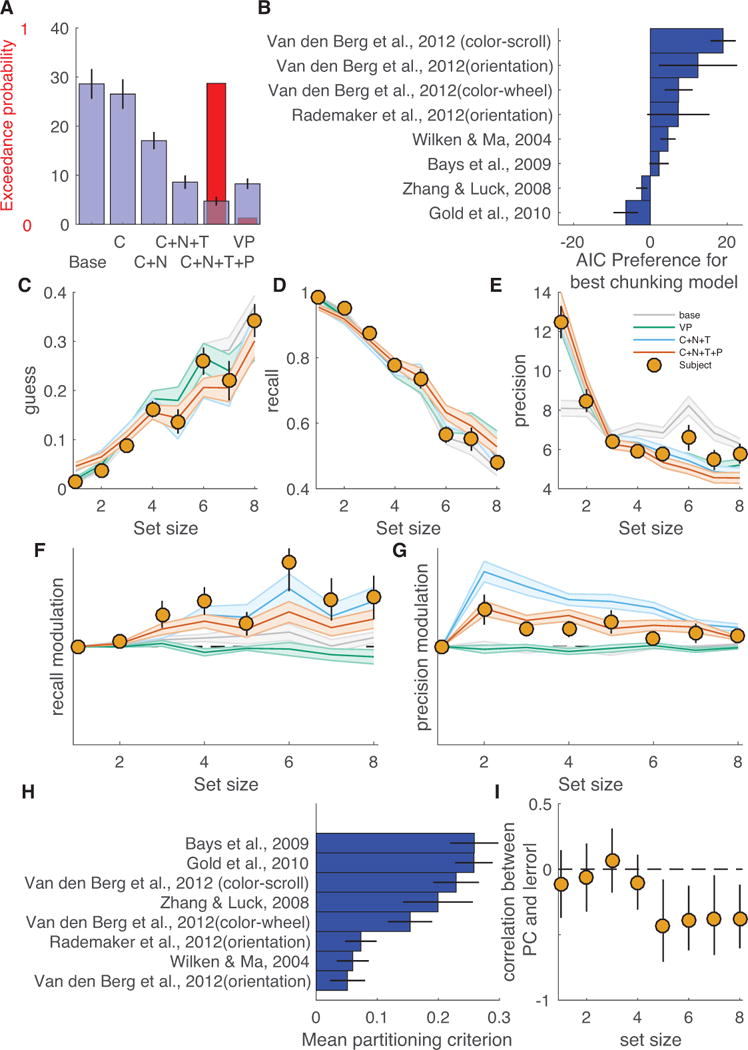
The nature of capacity limits for visual working memory has been the subject of an intense debate that has relied on models that assume items are encoded independently. Here we propose that instead, similar features are jointly encoded through a "chunking" process to optimize performance on visual working memory tasks. We show that such chunking can: (a) facilitate performance improvements for abstract capacity-limited systems, (b) be optimized through reinforcement, (c) be implemented by center-surround dynamics, and (d) increase effective storage capacity at the expense of recall precision. Human performance on a variant of a canonical working memory task demonstrated performance advantages, precision detriments, interitem dependencies, and trial-to-trial behavioral adjustments diagnostic of performance optimization through center-surround chunking. Models incorporating center-surround chunking provided a better quantitative description of human performance in our study as well as in a meta-analytic dataset, and apparent differences in working memory capacity across individuals were attributable to individual differences in the implementation of chunking. Our results reveal a normative rationale for center-surround connectivity in working memory circuitry, call for reevaluation of memory performance differences that have previously been attributed to differences in capacity, and support a more nuanced view of visual working memory capacity limitations: strategic tradeoff between storage capacity and memory precision through chunking contribute to flexible capacity limitations that include both discrete and continuous aspects. (PsycINFO Database Record


Conflict of interest statement

Competing interests:

The authors declare no competing interests.

Figures

Figure 1
Figure 1. Delayed report color reproduction task
Each trial begins with central fixation for 500 ms, followed by stimulus presentation for 200 ms. Stimuli consist of five colored and oriented bars evenly distributed around a circle subtending 4 degrees of visual angle and centered on the point of fixation. Stimulus presentation is followed by a 900 ms delay, after which a single oriented bar is displayed centrally. The subject is required to report the color associated with the bar with the probed orientation in the previous stimulus array. After confirming the report, the subject receives feedback dependent on whether the absolute magnitude of the reproduction error was greater or less than a fixed threshold. Stimulus colors on any given trial are selected either: 1) randomly and independently as is standard in such tasks (random spacing; upper left) or 2) ensuring uniform spacing on the color wheel so as to minimize within-array color similarity (fixed spacing).
Figure 2
Figure 2. Binary encoding model of visual working memory
In order to formalize capacity limitations, it is useful to consider an abstract model of working memory that stores features in binary words. A: Each color can be described by a binary word of fixed length, where the number of digits in the word determines the storage precision. B & C: Stimulus arrays can be stored by linking ordered pairs of color and orientation words. Capacity limitations are modeled by a fixed limit on the length of the resulting “sentence” comprised of color and orientation words separated by word termination symbols (2/3 for color/orientation words, respectively). B: One strategy for storing ordered pairs involves alternating sequences of color and orientation words, such that each color is “partitioned” from all other colors (dotted lines separating color representations) and linked to a single orientation. C: Another strategy for storage would be to link two or more orientations to a single color by removing a partition (chunking). This reduces the number of colors that need to be stored, and thus increases the number of bits allotted to each color. D: Full partitioning (top) involves placing a partition between each set of colors such that each color is represented independently. Criterion-based partitioning sets a partition between each set of colors that are separated by a greater distance than the partitioning criterion. Optimal partitioning examines all partitioning patterns for a given stimulus array and selects the partitioning pattern that would achieve the lowest theoretical error magnitude. Colors/Arcs in each model reflect stored representations of a particular stimulus array (actual stimuli labeled with numbers) and thick/thin lines indicate actual/potential partitions. Note that in this case, actual partitions selected by optimal partitioning do not differ from those selected by the criterion-based partitioning model.
Figure 3
Figure 3. Chunking improves memory performance and can be achieved through trial-to-trial adjustments of partitioning criterion
A-C: Criterion-based chunking confers memory performance advantages and reduces feature storage requirements under resource assumptions. A: Mean absolute error (ordinate) for theoretical performance of a binary encoding model on delayed report tasks of varying set size (grayscale) across all possible partitioning criterions (abscissa; 0 = all colors stored independently). B: Model error (ordinate) increases as a function of set size (abscissa) for three partitioning strategies: 1) fully partitioned (model always stores all targets independently), 2) optimal partitioning (model considers all possible partitions for each stimulus array and uses the best), 3) criterion-based partitioning (chunking and partitioning is determined by best criterion from A). Error increases more shallowly for optimal and criterion-based partitioning strategies that employ strategic chunking. C: Total number of chunks requiring storage (ordinate) increases as a function of set size (abscissa) for all three models, but saturates near 4 items for optimal and criterion-based chunking models. D-F: Performance advantages of criterion-based chunking hold for binary word storage, analogous to “slots + averaging.” D-F are analogous to A-C except that panels E and F show model performance separately for randomly spaced and fixed spaced stimulus arrays (solid and dotted lines, respectively) and do not include an “optimal partitioning” model, as computing it would be computationally inefficient under this framework. G-I: Appropriate partitioning criterions can be learned through reinforcement. G: Adjusting the partitioning criterion through reinforcement learning (see Methods) leads simulated criterions (ordinate) to increase over trials (abscissa) in a manner that scales with set size (grayscale; 2 = darkest, 8 = lightest). Adjustments in criterion lead to reduced errors (H) and decrease the “chunks” that require storage (I). J-L: Chunking selectively benefits performance on trials in which colors are most tightly clustered. Within-cluster variance provides a measure of feature clustering within a stimulus array, with low values indicating more clustering (J) and high values indicating less clustering (K). Performance of the best chunking model, but not the non-chunking model, depends on the clustering of individual stimulus arrays, as assessed through within-cluster variance. Mean absolute error is plotted for stimulus arrays grouped in bins of within-cluster variance for criterion-based chunking (green) and fully partitioned (orange) models. Triangles reflect the same values computed for fixed spacing trials, in which stimulus features were minimally clustered (as depicted in K).
Figure 4
Figure 4. Memory recall and confidence are enhanced for clustered stimulus arrays and adjusted according to trial feedback in accordance with model predictions
A&B: Memory performance and confidence increase with stimulus clustering. Mean absolute error magnitude (A) and high wager frequency (B) were computed per subject in sliding bins of within-cluster variance (larger values = decreased stimulus clustering) for random (lines) and fixed spacing conditions (points). Lines and shading reflect mean and SEM across subjects. C-F: Mixture model fits reveal recall benefit of stimulus clustering and hallmark of feedback-driven criterion adjustments. C: Subject data were fit with a mixture model that considered reports to come from a mixture of processes including 1) a uniform “guess” distribution, 2) a “memory+binding” distribution centered on the color of the probed target, and 3) a “binding error” distribution including peaks at each non-probed target [not shown]. Additional terms were included in the model to allow the recall probability to vary as a logistic function of stimulus clustering, recent feedback, and their interaction. D-F: Recall probability was modulated by feedback and stimulus clustering in a manner suggestive of trial-to-trial adjustments of chunking. Mean/SEM coefficients across subjects for each modulator of recall (log within-cluster variance (WCV), previous trial feedback (pCorr), previous trial log within-cluster variance (pWCV), pCorr*WCV and pCorr*WCV*pWCV) are represented from left to right as points/lines. Multiplicative interaction terms were included to capture the form of criterion adjustments that were used to facilitate criterion learning in the binary encoding model (Fig 3G-I). E&F: Recall probability of best-fitting descriptive models plotted as a function of the log within-cluster variance for the current trial and divided according to previous feedback (color) and the log within-cluster variance from the previous trial [E: pWCV =−1, F: pWCV=−5]. Lines/shading reflect mean/SEM across subjects. Feedback effects are consistent with reinforcement-learning as implemented in the binary encoding model: when chunking clustered stimulus arrays is rewarded with positive feedback, it is reinforced, leading to selective performance improvements for clustered stimulus arrays on the subsequent trial.
Figure 5
Figure 5. Center-surround connectivity as a mechanism to support chunking and partitioning operations needed to optimize working memory storage
A&B) Local recurrent excitation and lateral inhibition are critical for active working memory maintenance in biologically plausible neural networks (Almeida et al., 2015; Wei et al., 2012). However, the exact form of lateral inhibition has been varied across studies, with the most common version employing uniform inhibition across the entire population of tuned excitatory neurons (A, (Wei et al., 2012)) whereas others employ broadly tuned inhibition such that similarly tuned excitatory neurons indirectly exert stronger inhibitory forces on one another (B, (Almeida et al., 2015)). C) Simulated firing rates (redder colors indicate greater firing) of a population of color tuned neurons using the connectivity architecture described in panel A performing a working memory task (ordinate reflects neural tuning preference; abscissa reflects time in milliseconds; yellow bars indicate 200 ms color inputs delivered in a fixed pattern across network architectures). As described by Wei and colleagues, bumps of neural activity sometimes collide, producing “merged” representations (e.g., top activity bump in panel C), a possible mechanism for chunking. However, also as described by Wei and colleagues, collisions are somewhat indiscriminate and can increase overall population firing, which in turn can lead to collapse of other activity bumps (e.g., bottom activity bump) and hence forgetting. D) Simulated firing rates from the same population of neurons for the same task, but using center-surround connectivity (i.e., broadly tuned inhibition). Note that the closest bumps of activity are selectively chunked (e.g., second and third bump from top), but the tuned inhibition effectively partitions more distantly separated representations (e.g., the top from the second and third) and prevents forgetting of unrelated items. A related consequence of the tuned inhibition is that partitioned representations exert repulsive forces on one another during the delay period (see differences in separation of activity bumps at pink arrows). Thus, tuned inhibition affords selective partitioning of representations, but changes representations through inter-item repulsion.
Figure 6
Figure 6. Center-surround dynamics facilitate attractive and repulsive inter-item forces that can improve recall at the cost of precision
A) Local recurrent excitation and broadly tuned lateral inhibition give rise to two counteracting forces: recurrent excitation facilitates attraction of neighboring representations through “bump collisions” (Wei et al., 2012), whereas broadly tuned lateral inhibition facilitates repulsion of distinct bumps of neural activity (Felsen et al., 2005; Kiyonaga & Egner, 2016). Together, these forces produce a difference of Gaussians tuning function (yellow shading) that facilitates attraction of closely neighboring representations but repulsion of more distant ones. Here we model these effects at the cognitive level by assuming that two imprecise internal representations of color are chunked, and jointly represented by their mean value, with a fixed probability defined by a narrowly tuned von Mises distribution (green curve; B&C) in order to mimic the effects of narrowly tuned excitation. After probabilistic chunking, each color representation exerts a repulsive influence over all other representations with a magnitude defined by a broadly tuned von Mises distribution (red curve) in order to mimic the effects of broadly tuned inhibition. The model stores a Poisson number of the representations, chunked or otherwise, for subsequent recall. B) The influence of center-surround dynamics over model performance can be manipulated by applying a gain to the amplitude of the excitation and inhibition functions such that larger values correspond to greater item interdependencies and lead to smaller errors on average (lighter colors correspond to higher gain). C&D) The performance improvement mediated by increasing center-surround dynamics relies on a tradeoff between recall probability and precision, through which increased attractive and repulsive forces reduce precision (lighter bars; C), but enhance recall probability (lighter bars; D).
Figure 7
Figure 7. Error distributions reveal evidence for center-surround chunking
A-C) Signed color reproduction errors made in the random spacing condition by (A) subjects, (B) center-surround chunking models, and (C) independent encoding models. Data is collapsed across all simulated or actual sessions. D-F) Same as A-C but for the fixed spacing condition. Red dashed lines indicate probed and non-probed target locations. Note that the alignment of non-probed target locations emphasizes the prominence of non-probed target reports (binding errors), which would appear uniformly distributed in the random spacing condition. G-I) Difference in above error distributions for random minus fixed. To aid in visualization, bin count differences were smoothed with a Gaussian kernel (standard deviation = 1 bin). Subjects and the center-surround chunking model show increased moderately small, but non-zero, errors in the random spacing condition. Note that differences of reports between the random and fixed conditions near the non-probed targets are present in both models, as they simply reflect an artifact of the alignment of binding errors in the fixed spacing condition.
Figure 8
Figure 8. Neighboring stimulus features affect bias, precision, and recall probability as predicted by the center-surround chunking model
Subject (left) and simulated (center = center-surround, right = independent encoding) data were collapsed across all sessions and binned in sliding windows according to the absolute distance between the probed target color and the most similar non-probed target color (nearest neighbor distance; abscissa). Data in each bin were fit with a mixture model that included free parameters to estimate 1) the bias of memory reports towards the closest color in the target array expressed as a fraction of distance to that target (A-C), and 2) the precision of memory reports (D-F). The qualitative trends present in subject data are also present in data simulated from the center-surround chunking model but not in those simulated from the independent encoding model. Red bars reflect the nearest neighbor distance at which precision fits to subject data were minimal and also corresponds well with the crossover point of the bias fits.
Figure 9
Figure 9. Heterogeneous chunking strategies across individual subjects provide empirical evidence for the performance advantages afforded by chunking
A) AIC difference between simple mixture model and more complex center (orange), surround (yellow), and center + surround (blue) models is plotted for each subject, sorted by model preference (positive values indicate that more complex model is preferred). Aggregate AIC values favored the C+S model, yet there was substantial variability across subjects in marginal improvement afforded by the C+S model over the simpler mixture model, with AIC values providing moderate evidence for the mixture in some subjects, but strong evidence for the C+S model in other subjects. B) Partitioning criterions best fit to subject data also reflected heterogeneity in strategies across subjects, with a number of subjects best fit with criterion values near zero, and another subset of subjects taking values across a wider range from 0.1-0.5. C) Best-fitting repulsion coefficients tended to take positive values across subjects, indicating that independently represented colors tended to exert repulsive forces on one another by the best-fitting model parameterization. D-F) Subjects displaying more evidence of center-surround chunking performed better on the working memory task. D) Mean absolute error was greatest for the subjects that displayed the least evidence of center-surround chunking, as assessed by the difference in AIC between C+S and basic mixture models (ρ = −0.59, p = 1.6e-5). E&F) Errors were also elevated for subjects that were best fit with criterions near zero (E; ρ = −0.54, p = 8.5e-5) or with small or negative repulsion coefficients (F; ρ = −0.39, p = 7.4e-3).
Figure 10
Figure 10. Center-surround chunking allows better fits of meta-analytic datasets and offers insight into trends and individual differences in how memory degrades with set size
A) Blue bars/lines represent mean/SEM relative AIC (AIC relative to that of the best model for each subject) and red bars reflect exceedance probability for a nested model set. Base refers to the base model, C includes center-surround chunking, N allows for chunking- and repulsion-induced report variability, T allows for t-distributed errors, and P allows precision to vary as a power-function of set size. Models are compared to the best-fitting model from a factorial model comparison that used this dataset (VP = variable precision, Poisson recall, with binding errors) (van den Berg et al., 2014). Bayesian model selection favored a model that incorporated t-distributed memory reports, power-law precision decrements and all modeled aspects of center-surround chunking (C+N+T+P). A model lacking power-law precision decrements (C+N+T) performed similarly in model comparison to the VP model. B) Horizontal bars reflect AIC preference for the winning (C+N+T+P) model over the best model that lacks chunking (VP) for each experiment and are arranged according to mean AIC preference (with experiments providing strongest support for the more center-surround model on top). C-G) Posterior predictive checks reveal nuanced discrepancies in the predictions across models. Actual and simulated data were sorted by subject and set size and fit with a flexible mixture model (see Methods) that estimated: guess rate (C), binding error rate (not shown), recall rate (D), report precision (E), modulation of recall by chunking (F) and modulation of precision by chunking (G). Points and lines reflect mean/SEM fits to subject data whereas lines/shading reflect mean/SEM fits to simulated data for each model (models denoted by color: base = gray, VP = green, C+N+T = blue, C+N+T+P = orange). All models captured guess and recall rates reasonably well (C&D), but only models that included either chunking (C+N+T), precision decrements with set size (VP) or both (C+N+T+P) could account for changes in precision of reports across set size (E). Only models that included chunking (C+N+T & C+N+T+P) could account for within set size modulation of recall (F). Within set size modulation of precision was overestimated by a chunking model with fixed assumptions about precision (C+N+T) and underestimated by models without chunking (base & VP) but well estimated by a model that included chunking and allowed precision to vary with set size (C+N+T+P). H) Bars indicate mean partitioning criterion for the (C+N+T) model across the experiments included in the meta-analysis (sorted from maximum). I) Correlation between mean absolute error magnitude (z-scored per experiment and set size) and the best-fitting partitioning criterion is plotted as a function of set size (abscissa). Points and lines reflect mean and bootstrapped 95% confidence intervals, respectively.

References

    1. Almeida R, Barbosa J, Compte A. Neural circuit basis of visuo-spatial working memory precision: a computational and behavioral study. Journal of Neurophysiology. 2015;114(3):1806–1818. http://doi.org/10.1152/jn.00362.2015. - DOI - PMC - PubMed
    1. Barak O, Sussillo D, Romo R, Tsodyks M, Abbott LF. From fixed points to chaos: Three models of delayed discrimination. Progress in Neurobiology. 2013;103:214–222. http://doi.org/10.1016/j.pneurobio.2013.02.002. - DOI - PMC - PubMed
    1. Bays PM, Husain M. Dynamic shifts of limited working memory resources in human vision. Science. 2008;321(5890):851–854. http://doi.org/10.1126/science.1158023. - DOI - PMC - PubMed
    1. Bays PM, Catalao RFG, Husain M. The precision of visual working memory is set by allocation of a shared resource. Journal of Vision. 2009;9(10):7.1–11. http://doi.org/10.1167/9.10.7. - DOI - PMC - PubMed
    1. Ben-Yishai R, Bar-Or RL, Sompolinsky H. Theory of orientation tuning in visual cortex. Proceedings of the National Academy of Sciences of the United States of America. 1995;92(9):3844–3848. - PMC - PubMed

Publication types