. 2018 Aug 31;128(9):3926-3940.
doi: 10.1172/JCI96519. Epub 2018 Aug 13.

ATR kinase inhibitor AZD6738 potentiates CD8+ T cell-dependent antitumor activity following radiation

Affiliations

ATR kinase inhibitor AZD6738 potentiates CD8+ T cell-dependent antitumor activity following radiation

Frank P Vendetti et al. J Clin Invest. .

Abstract

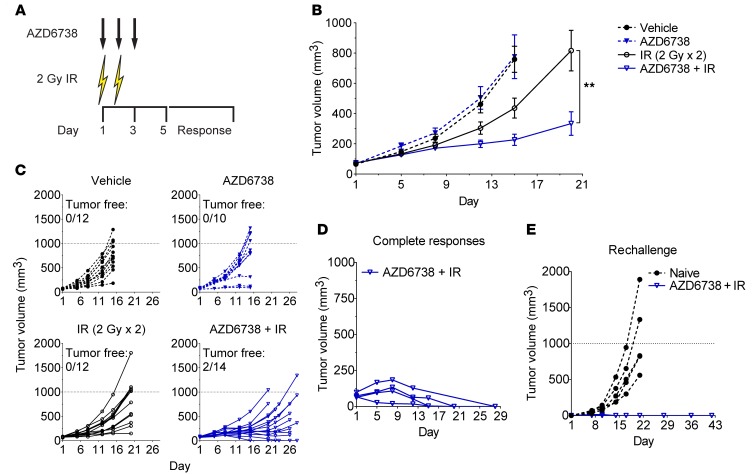
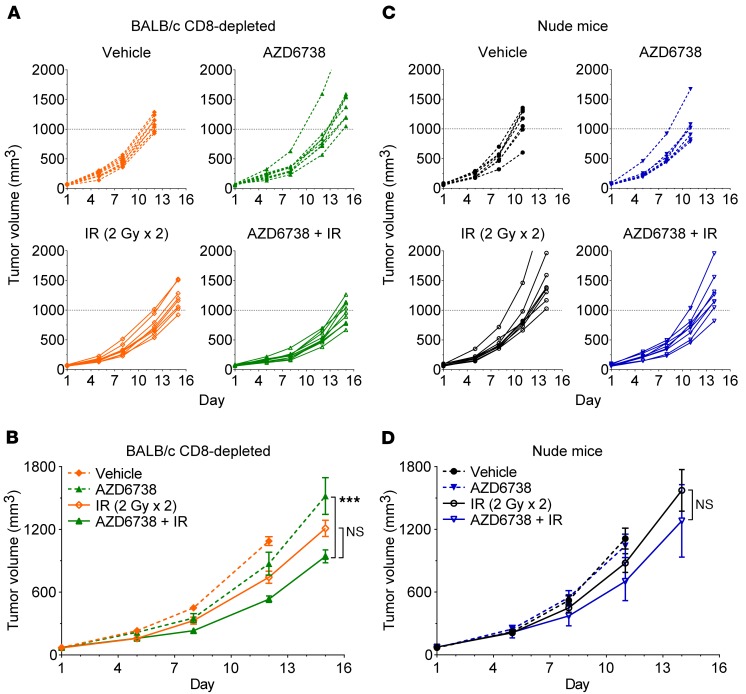
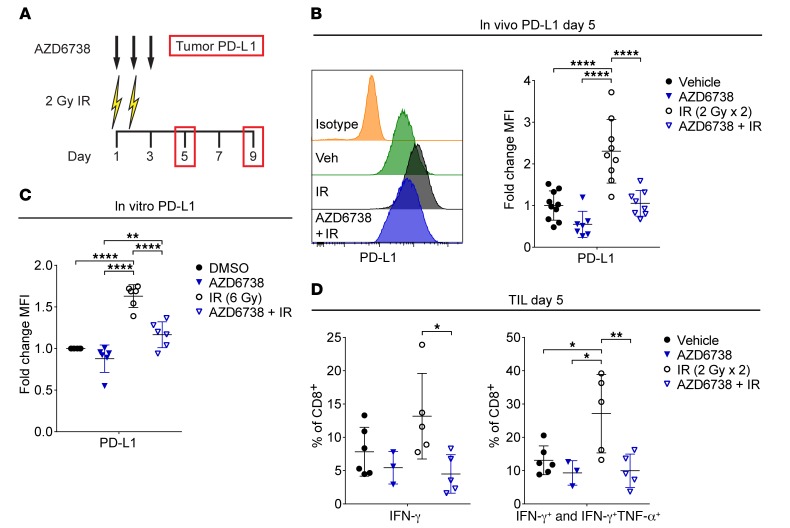
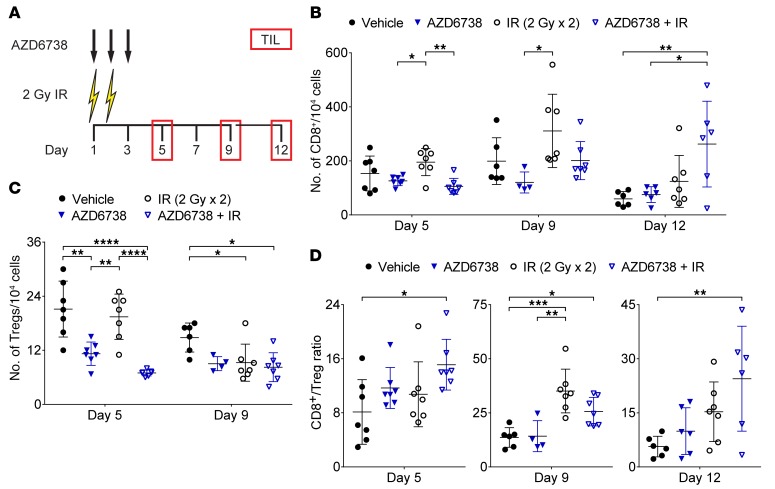
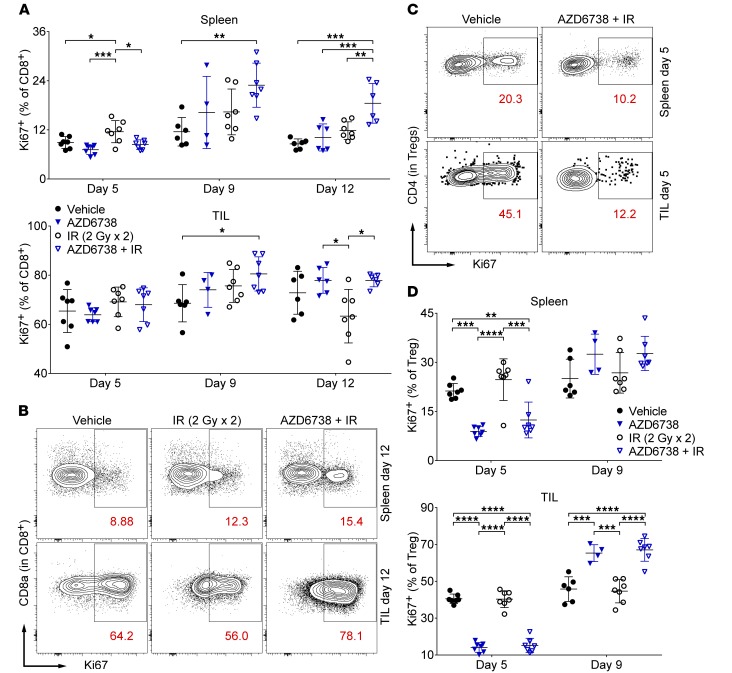
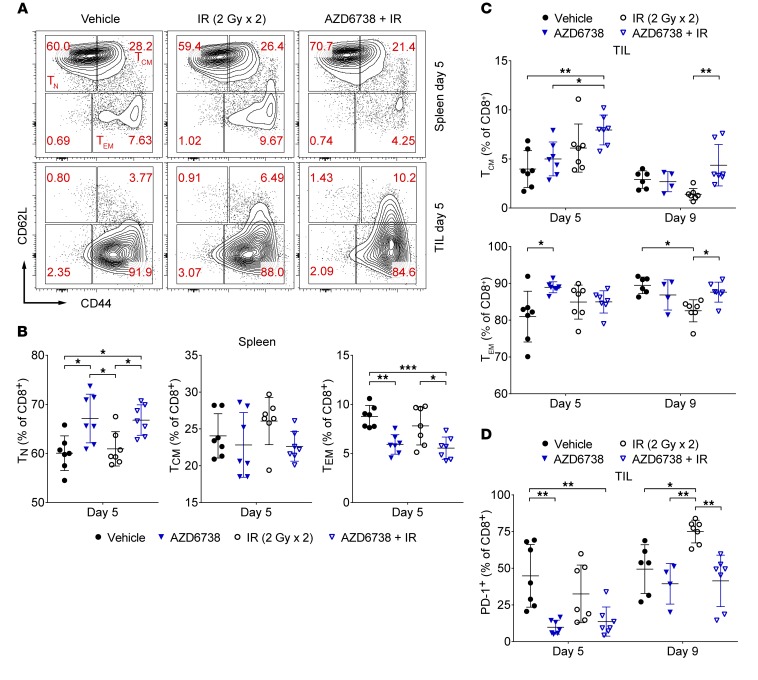
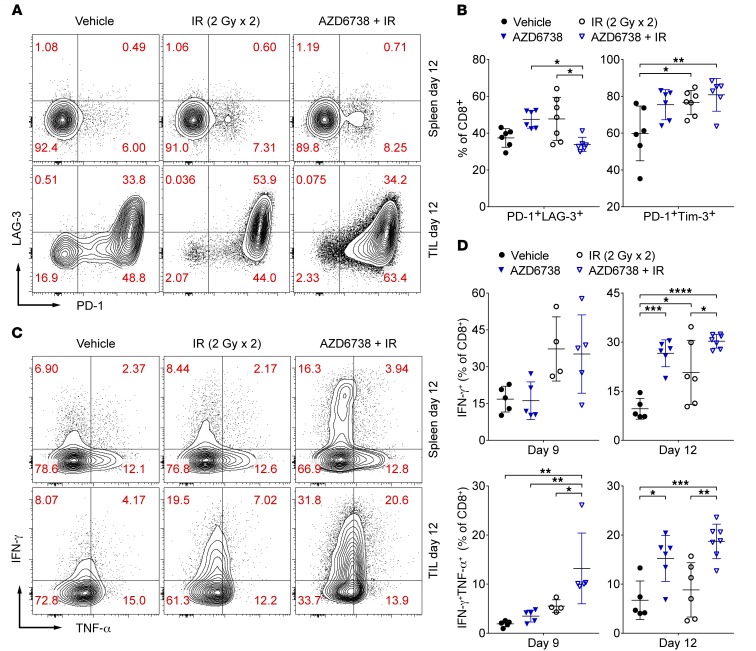
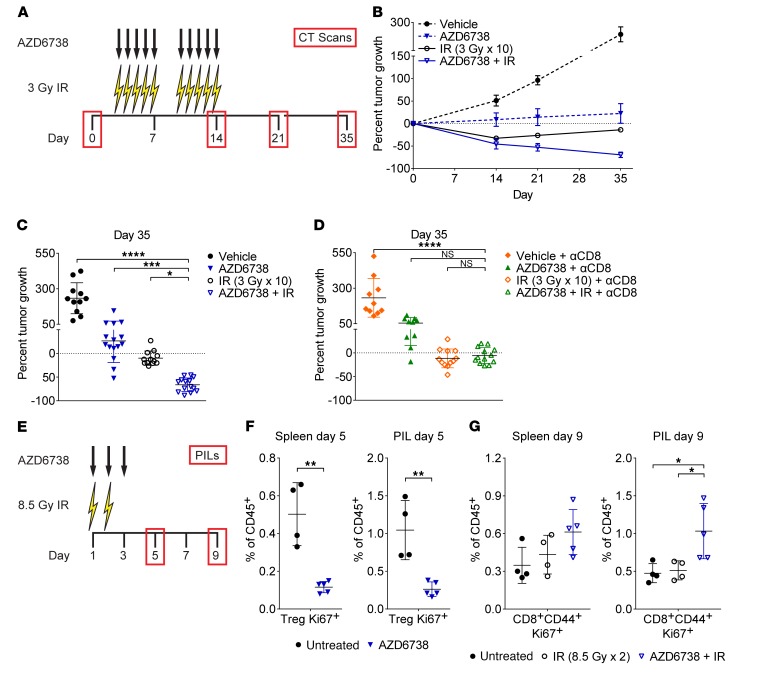
DNA-damaging chemotherapy and radiation therapy are integrated into the treatment paradigm of the majority of cancer patients. Recently, immunotherapy that targets the immunosuppressive interaction between programmed death 1 (PD-1) and its ligand PD-L1 has been approved for malignancies including non-small cell lung cancer, melanoma, and head and neck squamous cell carcinoma. ATR is a DNA damage-signaling kinase activated at damaged replication forks, and ATR kinase inhibitors potentiate the cytotoxicity of DNA-damaging chemotherapies. We show here that the ATR kinase inhibitor AZD6738 combines with conformal radiation therapy to attenuate radiation-induced CD8+ T cell exhaustion and potentiate CD8+ T cell activity in mouse models of Kras-mutant cancer. Mechanistically, AZD6738 blocks radiation-induced PD-L1 upregulation on tumor cells and dramatically decreases the number of tumor-infiltrating Tregs. Remarkably, AZD6738 combines with conformal radiation therapy to generate immunologic memory in complete responder mice. Our work raises the possibility that a single pharmacologic agent may enhance the cytotoxic effects of radiation while concurrently potentiating radiation-induced antitumor immune responses.

Keywords: Cancer; Immunology; Oncology.


Conflict of interest statement

Conflict of interest: MJO is a full-time employee of AstraZeneca.

Figures

Figure 1
Figure 1. AZD6738 potentiates radiation in syngeneic CT26 tumors and promotes immunologic memory following complete responses.
(A) Schematic showing schedules of the ATR kinase inhibitor AZD6738 and targeted radiation (IR). AZD6738 (75 mg/kg) was administered approximately 40 minutes before IR on days 1–2 and alone on day 3. (B and C) Response of CT26 over time to treatment with AZD6738, IR, or the combination of AZD6738 plus IR. Data represent mean tumor volumes ± SEM (B) or individual tumor volumes (C) from 2 independent experiments. n per arm (mice) = 12 vehicle, 10 AZD6738, 12 IR, 14 AZD6738 + IR. **P < 0.01, unpaired, 2-tailed t test comparing change in tumor volume from day 1 to day 20 for AZD6738 + IR vs. IR. Statistical significance not shown for other time points. (D) Complete responses of CT26 tumors over time to treatment with AZD6738 plus IR. (E) Tumor growth following rechallenge of complete responder mice with CT26 cells in the contralateral flank compared with tumor growth in CT26-naive control mice. (D and E) Data represent individual tumor volumes. n per arm (mice) = 4 AZD6738 + IR complete responders, 5 naive controls.
Figure 2
Figure 2. CD8+ T cells are required for maximal efficacy of AZD6738 plus radiation in CT26 tumors.
(AD) Response of CT26 over time to treatment with AZD6738, IR, or the combination of AZD6738 plus IR in CD8-depleted BALB/c (A and B) and athymic nude (C and D) mice. Dose and time of administration of AZD6738 were the same as in Figure 1. (A and B) Response in CD-depleted BALB/c mice, with 250 μg anti-CD8 antibody (αCD8) administered on days 1–2. Data represent individual tumor volumes (A) or mean tumor volumes ± SEM (B) from 2 independent experiments. n per arm (mice) = 9 vehicle, 8 AZD6738, 8 IR, 10 AZD6738 + IR. ***P < 0.001, ANOVA with Holm-Šidák multiple-comparisons test comparing change in tumor volume from day 1 to day 15 for AZD6738 + IR vs. AZD6738 and AZD6738 + IR vs. IR. Statistical significance not shown for other comparisons/time points. (C and D) Response in athymic nude mice. Data represent individual tumor volumes (C) or mean tumor volumes ± SEM (D) from 1 experiment. n per arm (mice) = 7 vehicle, 7 AZD6738, 8 IR, 8 AZD6738 + IR. Unpaired, 2-tailed t test comparing change in tumor volume from day 1 to day 14 for AZD6738 + IR vs. IR. Statistical significance not shown for other time points.
Figure 3
Figure 3. AZD6738 attenuates radiation-induced PD-L1 expression in CT26 tumors.
(A) Schematic showing schedules of IR, AZD6738, and time points for tumor PD-L1 expression analyses. Dose and time of administration of AZD6738 were the same as in Figure 1. (B) Representative histograms of PD-L1 expression on CT26 tumor cells at day 5 for the designated treatments and isotype control, and corresponding quantitation of the fold change in PD-L1 median fluorescence intensity (MFI) relative to the average MFI of vehicle controls (within a given experiment). Data from 4 independent experiments (3 for AZD6738), each with 1–4 mice per arm. n = 10 vehicle, 7 AZD6738, 9 IR, 8 AZD6738 + IR. (C) Quantitation of fold change in PD-L1 MFI following treatment in vitro with AZD6738 (300 nM), 6 Gy IR, AZD6738 plus IR, or DMSO control. Data represent 6 independent biological replicates. (D) Quantitation of the percentage of tumor-infiltrating CD8+ T cells expressing IFN-γ or IFN-γ and TNF-α following stimulation with PMA/ionomycin at day 5. Data from 3 independent experiments (1 for AZD6738), each with 1–3 mice per arm. n = 6 vehicle, 3 AZD6738, 5 IR, 5 AZD6738 + IR. (BD) Mean and SD bars shown. *P < 0.05, **P < 0.01, ****P < 0.0001, ANOVA with Tukey’s multiple-comparisons test. Brackets not shown for comparisons that were not statistically significant.
Figure 4
Figure 4. AZD6738 impacts T cell infiltration in CT26 tumors following radiation.
(A) Schematic showing schedules of IR and AZD6738 treatments and time points for tumor-infiltrating lymphocyte (TIL) analyses. Dose and time of administration of AZD6738 were the same as in Figure 1. (B) Quantitation of the number of TIL CD8+ cells per 104 cells stained at days 5, 9, and 12. (C) Quantitation of the number of TIL Tregs per 104 cells stained at days 5 and 9. (D) CD8+/Treg ratios at days 5, 9, and 12. (BD) Data from 3 independent experiments per time point, each with 1–3 mice per arm. n at day 5 = 7 per arm; n at day 9 = 6 vehicle, 4 AZD6738, 7 IR, 7 AZD6738 + IR; n at day 12 = 6 per arm (7 IR). Mean and SD bars shown. *P < 0.05, **P < 0.01, ***P < 0.001, ****P < 0.0001, ANOVA with Tukey’s multiple-comparisons test. Brackets not shown for comparisons that were not statistically significant.
Figure 5
Figure 5. AZD6738 impacts proliferating splenic and tumor-infiltrating T cells in CT26 tumor–bearing mice.
(A) Quantitation of the percentages of proliferating (Ki67+) splenic and tumor-infiltrating (TIL) CD8+ T cells at days 5, 9, and 12. (B) Representative contour plots depicting Ki67+ expression on splenic and TIL CD8+ T cells for the designated treatment groups at day 12. (C) Representative contour plots depicting Ki67+ expression on splenic and TIL Tregs for the designated treatment groups at day 5. (D) Quantitation of the percentages of proliferating (Ki67+) splenic and TIL Tregs at days 5 and 9. (B and D) Data from 3 independent experiments per time point, each with 1–3 mice per arm. n at day 5 = 7 per arm; n at day 9 = 6 vehicle, 4 AZD6738, 7 IR, 7 AZD6738 + IR; n at day 12 = 6 per arm (7 IR). Mean and SD bars shown. *P < 0.05, **P < 0.01, ***P < 0.001, ****P < 0.0001, ANOVA with Tukey’s multiple-comparisons test. Brackets not shown for comparisons that were not statistically significant.
Figure 6
Figure 6. AZD6738 impacts CD8+ T cell activation in CT26 tumor–bearing mice.
(A) Representative contour plots depicting CD62L and CD44 expression on spleen and tumor-infiltrating (TIL) CD8+ T cells for the designated treatment groups at day 5. (B) Quantitation of the percentage of splenic CD8+ T cells with naive (TN, CD62LhiCD44lo), central memory (TCM, CD62LhiCD44hi), or effector memory (TEM, CD62LloCD44hi) phenotypes at day 5. (C) Quantitation of the percentage of TIL CD8+ T cells with TCM or TEM phenotypes at days 5 and 9. (D) Quantitation of the percentage of tumor-infiltrating (TIL) CD8+ T cells that express PD-1 at days 5 and 9. (BD) Data from 3 independent experiments per time point, each with 1–3 mice per arm. n at day 5 = 7 per arm; n at day 9 = 6 vehicle, 4 AZD6738, 7 IR, 7 AZD6738 + IR. Mean and SD bars shown. *P < 0.05, **P < 0.01, ***P < 0.001, ANOVA with Tukey’s multiple-comparisons test. Brackets not shown for comparisons that were not statistically significant.
Figure 7
Figure 7. AZD6738 attenuates coexpression of CD8+ T cell exhaustion markers and promotes CD8+ T cell effector function in CT26 tumors following radiation.
(A) Representative contour plots depicting PD-1 and LAG-3 expression on splenic and tumor-infiltrating (TIL) CD8+ T cells for the designated treatment groups at day 12. (B) Quantitation of the percentage of TIL CD8+ T cells that coexpress PD-1 and LAG-3 or PD-1 and Tim-3 at day 12. Data from 3 independent experiments per time point, each with 1–3 mice per arm. n at day 12 = 6 per arm (7 IR). (C) Representative contour plots depicting IFN-γ and TNF-α expression by splenic and tumor-infiltrating (TIL) CD8+ T cells for the designated treatment groups following stimulation with PMA/ionomycin at day 12. (D) Quantitation of the percentage of TIL CD8+ T cells that elicit IFN-γ or IFN-γ and TNF-α following stimulation with PMA and ionomycin at days 9 and 12. Day 9 data from 1 experiment with the IR/AZD6738 + IR arms and vehicle/AZD6738 arms staggered and harvested/stained on separate days. n at day 9 = 5 per arm (4 IR). Day 12 data from 3 independent experiments, each with 1–3 mice per arm, with harvesting/staining for all arms performed on the same day within a given experiment. n at day 12 = 5 vehicle, 6 AZD6738, 6 IR, 7 AZD6738 + IR. (B and D) Mean and SD bars shown. *P < 0.05, **P < 0.01, ***P < 0.001, ****P < 0.0001, ANOVA with Tukey’s multiple-comparisons test. Brackets not shown for comparisons that were not statistically significant.
Figure 8
Figure 8. AZD6738 plus radiation generates a CD8+ T cell–dependent response in KrasG12D/Twist1 lung adenocarcinoma.
(A) Schematic showing schedules of hemithoracic radiation (IR), AZD6738, and micro-CT scans. (B) Response of lung tumors over time. Data represent mean percentage tumor volume change from day 0 (± SEM). n (tumors/mice) = 7/3 vehicle, 8/4 AZD6738, 9/4 IR, 7/4 AZD6738 + IR (5/3 day 21). (C) Percent tumor volume change at day 35. n (tumors/mice) = 11/5 vehicle, 15/7 AZD6738, 12/6 IR, 14/8 AZD6738 + IR. (D) Percent tumor volume change at day 35 in CD8-depleted mice (250 μg anti-CD8 antibody [αCD8] administered days 3, 6, 10, and 13). n (tumors/mice) = 10/4 vehicle + αCD8, 10/5 AZD6738 + αCD8, 12/6 IR + αCD8, 13/6 AZD6738 + IR + αCD8. (C and D) Mean and SD bars shown. *P < 0.05, ***P < 0.001, ****P < 0.0001, ANOVA with Holm-Šidák multiple-comparisons test. Statistical significance shown only for comparisons with AZD6738 + IR (C) or AZD6738 + αCD8 + IR (D). (E) Schematic showing schedules of hemithoracic IR, AZD6738, and pulmonary-infiltrating lymphocyte (PIL) profiling. (F) Quantitation of splenic and PIL proliferating (Ki67+) Tregs at day 5 following AZD6738 treatment, compared with untreated control. (G) Quantitation of splenic and PIL proliferating (Ki67+) CD8+CD44+ T cells at day 9 following treatment with IR or AZD6738 plus IR, compared with untreated control. (F and G) Data from 1 (IR/AZD6738 + IR, day 9 only), 2 (AZD6738, day 5 only), or 3 (untreated) independent experiments, with 1–5 mice per arm per experiment. n = 4 untreated, 5 AZD6738, 4 IR, 5 AZD6738 + IR. Mean and SD bars shown. (F) **P < 0.01, unpaired, 2-tailed t test. (G) *P < 0.05, ANOVA with Tukey’s multiple-comparisons test. Brackets not shown for comparisons that were not statistically significant.

References

    1. Ohaegbulam KC, Assal A, Lazar-Molnar E, Yao Y, Zang X. Human cancer immunotherapy with antibodies to the PD-1 and PD-L1 pathway. Trends Mol Med. 2015;21(1):24–33. doi: 10.1016/j.molmed.2014.10.009. - DOI - PMC - PubMed
    1. Pardoll DM. The blockade of immune checkpoints in cancer immunotherapy. Nat Rev Cancer. 2012;12(4):252–264. doi: 10.1038/nrc3239. - DOI - PMC - PubMed
    1. Keir ME, Butte MJ, Freeman GJ, Sharpe AH. PD-1 and its ligands in tolerance and immunity. Annu Rev Immunol. 2008;26:677–704. doi: 10.1146/annurev.immunol.26.021607.090331. - DOI - PMC - PubMed
    1. Barber DL, et al. Restoring function in exhausted CD8 T cells during chronic viral infection. Nature. 2006;439(7077):682–687. doi: 10.1038/nature04444. - DOI - PubMed
    1. Liang SC, et al. Regulation of PD-1, PD-L1, and PD-L2 expression during normal and autoimmune responses. Eur J Immunol. 2003;33(10):2706–2716. doi: 10.1002/eji.200324228. - DOI - PubMed

Publication types

MeSH terms