

Geographic Variation in Pediatric Cancer Incidence - United States, 2003-2014
- PMID: 29953430
- PMCID: PMC6023185
- DOI: 10.15585/mmwr.mm6725a2
Geographic Variation in Pediatric Cancer Incidence - United States, 2003-2014
Abstract
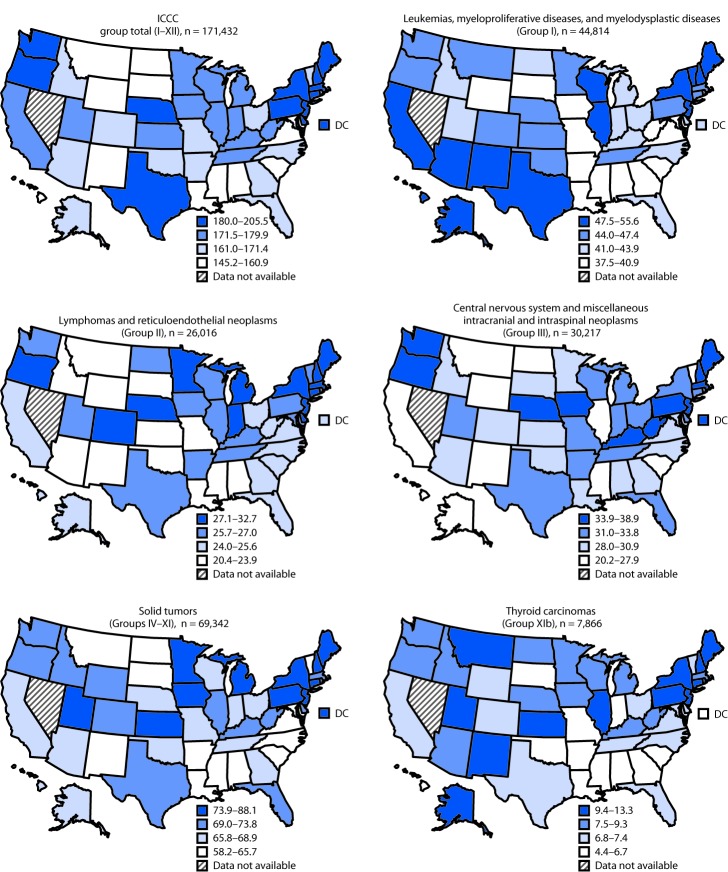
Approximately 15,000 persons aged <20 years receive a cancer diagnosis each year in the United States (1). National surveillance data could provide understanding of geographic variation in occurrence of new cases to guide public health planning and investigation (2,3). Past research on pediatric cancer incidence described differences by U.S. Census region but did not provide state-level estimates (4). To adequately describe geographic variation in cancer incidence among persons aged <20 years in the United States, CDC analyzed data from United States Cancer Statistics (USCS) during 2003-2014 and identified 171,432 cases of pediatric cancer during this period (incidence = 173.7 cases per 1 million persons). The cancer types with the highest incidence rates were leukemias (45.7), brain tumors (30.9), and lymphomas (26.2). By U.S. Census region, pediatric cancer incidence was highest in the Northeast (188.0) and lowest in the South (168.0), whereas by state (including the District of Columbia [DC]), rates were highest in New Hampshire, DC, and New Jersey. Among non-Hispanic whites (whites) and non-Hispanic blacks (blacks), pediatric cancer incidence was highest in the Northeast, and the highest rates among Hispanics were in the South. The highest rates of leukemia were in the West, and the highest rates of lymphoma and brain tumors were in the Northeast. State-based differences in pediatric cancer incidence could guide interventions related to accessing care (e.g., in states with large distances to pediatric oncology centers), clinical trial enrollment, and state or regional studies designed to further explore variations in cancer incidence.
Conflict of interest statement
No conflicts of interest were reported.
Figures
References
-
- US Cancer Statistics Working Group. United States cancer statistics: 1999–2014 incidence and mortality web-based report. Atlanta, GA: US Department of Health and Human Services, CDC; National Cancer Institute; 2017. https://www.cdc.gov/cancer/npcr/uscs/index.htm
-
- Holmes L, Vandenberg J, McClarin L, Dabney K. Epidemiologic, racial and healthographic mapping of Delaware pediatric cancer: 2004–2014. Int J Environ Res Public Health 2015;13(1),49. http://www.mdpi.com/1660-4601/13/1/49 - PMC - PubMed
MeSH terms
LinkOut - more resources
Full Text Sources
Other Literature Sources
Miscellaneous
