. 2018 Jun 28;16(6):e2006459.
doi: 10.1371/journal.pbio.2006459. eCollection 2018 Jun.

A speed-fidelity trade-off determines the mutation rate and virulence of an RNA virus

Affiliations

A speed-fidelity trade-off determines the mutation rate and virulence of an RNA virus

William J Fitzsimmons et al. PLoS Biol. .

Abstract

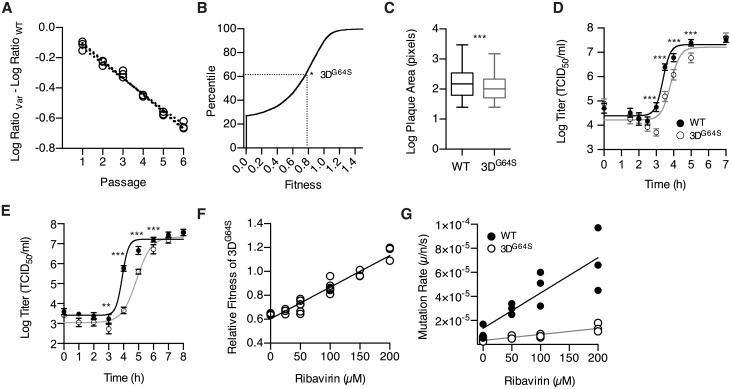
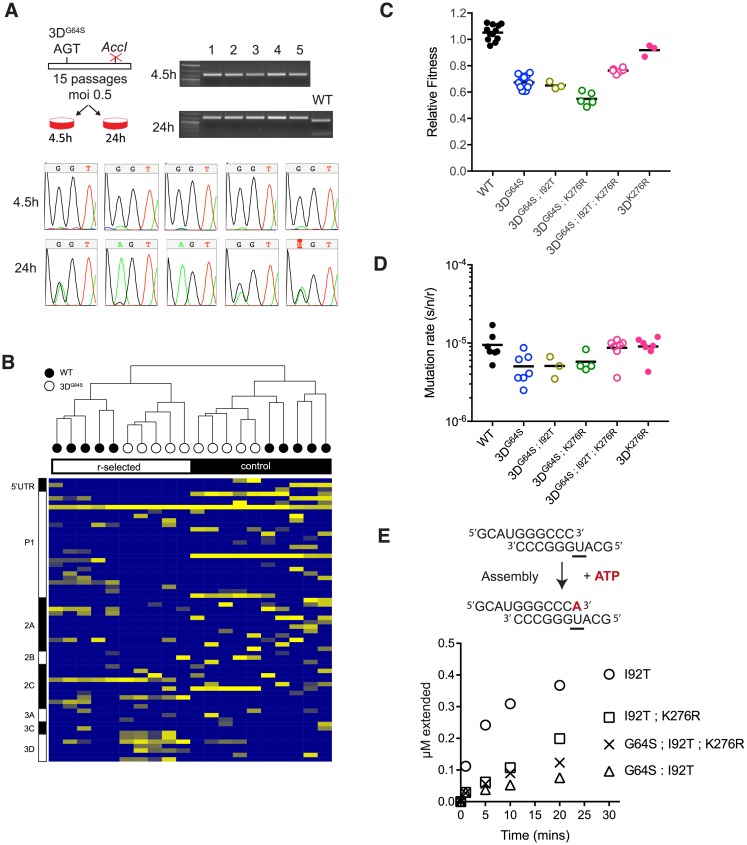
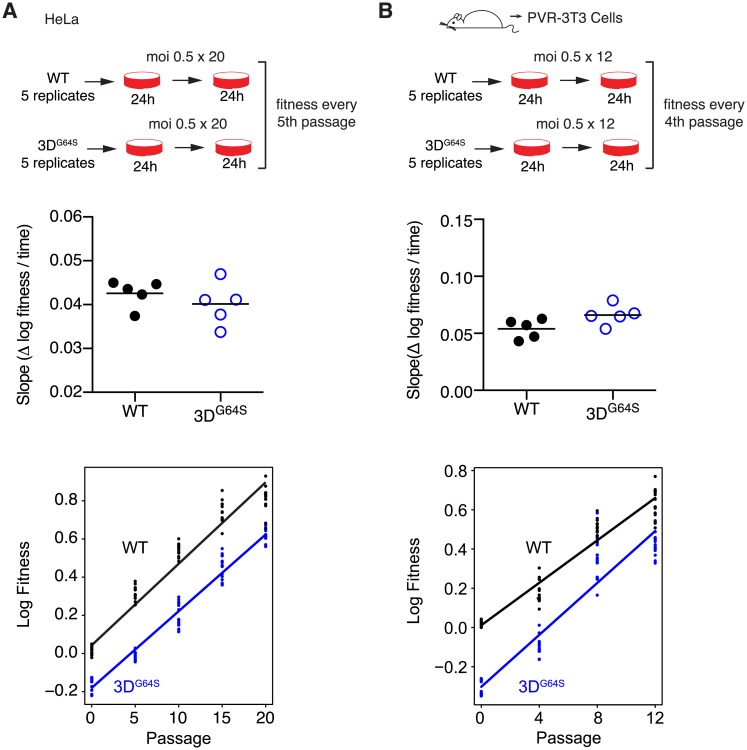
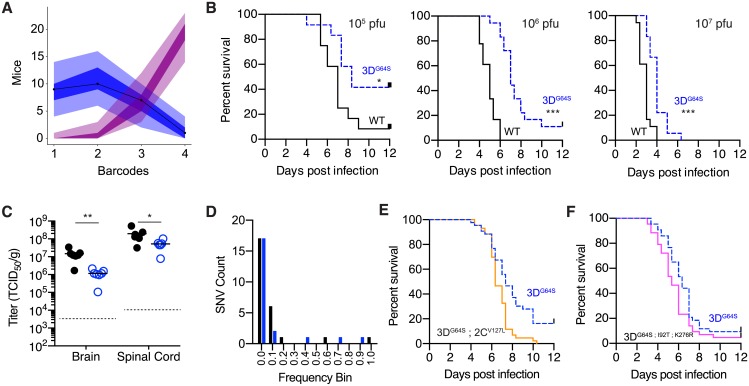
Mutation rates can evolve through genetic drift, indirect selection due to genetic hitchhiking, or direct selection on the physicochemical cost of high fidelity. However, for many systems, it has been difficult to disentangle the relative impact of these forces empirically. In RNA viruses, an observed correlation between mutation rate and virulence has led many to argue that their extremely high mutation rates are advantageous because they may allow for increased adaptability. This argument has profound implications because it suggests that pathogenesis in many viral infections depends on rare or de novo mutations. Here, we present data for an alternative model whereby RNA viruses evolve high mutation rates as a byproduct of selection for increased replicative speed. We find that a poliovirus antimutator, 3DG64S, has a significant replication defect and that wild-type (WT) and 3DG64S populations have similar adaptability in 2 distinct cellular environments. Experimental evolution of 3DG64S under selection for replicative speed led to reversion and compensation of the fidelity phenotype. Mice infected with 3DG64S exhibited delayed morbidity at doses well above the lethal level, consistent with attenuation by slower growth as opposed to reduced mutational supply. Furthermore, compensation of the 3DG64S growth defect restored virulence, while compensation of the fidelity phenotype did not. Our data are consistent with the kinetic proofreading model for biosynthetic reactions and suggest that speed is more important than accuracy. In contrast with what has been suggested for many RNA viruses, we find that within-host spread is associated with viral replicative speed and not standing genetic diversity.


Conflict of interest statement

The authors have declared that no competing interests exist.

Figures

Fig 1
Fig 1. A speed–fidelity trade-off in the poliovirus RdRp.
(A) Relative fitness of 3DG64S as measured by direct competition. The amount of each virus at each passage was compared to the input and expressed as the difference in the log10 ratio in RNA genomes for 3DG64S (open circles) relative to WT over time. The slope of the dotted lines are the relative fitness values, 0.78 ± 0.01, n = 3 replicates. (B) Cumulative distribution function of fitness values for SNVs of poliovirus as determined in [16]. “*” indicates the relative fitness (0.78) and percentile (64th) of 3DG64S. (C) Plaque size of clones from WT (n = 272; black) and 3DG64S (n = 220; grey) virus populations. Box plots show median, 25% and 75% quartiles, and 1.5× interquartile range. ***p ≤ 0.005; t test with Welch’s correction. (D) Single-cycle growth curve for WT (filled circles, black line) and 3DG64S (open circles, grey line) in HeLa. Data are mean ± standard deviation (n = 5 replicates). ***p < 0.005; unpaired t test comparing WT and 3DG64S separately for each time point. (E) Single-cycle growth curve for WT (filled circles, black line) and 3DG64S (open circles, grey line) in 3T3 cell line derived from MEFs of PVR transgenic mice. Data are mean ± standard deviation (n = 5 replicates). **p < 0.01; ***p < 0.005; unpaired t test comparing WT and 3DG64S separately for each time point. (F) Relative fitness of 3DG64S (open circles) as measured by competition assay (see panel A) in the presence of varying concentrations of ribavirin. Note that the baseline relative fitness of 3DG64S (y-intercept) is lower than the fitness reported in panel A because the assays were performed under different experimental conditions (see Methods). (G) Mutation rate in mutations per nucleotide per strand copied for WT (filled circles) and 3DG64S (open circles) in the presence of varying concentrations of ribavirin, as determined by Luria Delbruck fluctuation test. All plotted data can be found in S1 Data. HeLa, human epithelial cells; MEF, mouse embryonic fibroblast; PVR, poliovirus receptor; RdRp, RNA-dependent RNA polymerase; SNV, single-nucleotide variant; WT, wild-type.
Fig 2
Fig 2. R-selection leads to increased mutation rates.
(A) A point mutant of 3DG64S (GGTgly to AGTser) was introduced into a poliovirus genome that is marked with a nearby point mutation that ablates an AccI restriction site. Viruses were serially passaged every 4.5 hours (r-selected) or every 24 hours (control) for 15 passages. Chromatograms show the codon for position 64 (either GGTgly or AGTser). Gel image of AccI restriction digest of all passage 15 populations showing that the reversion occurred in the parental backbone and was not due to contamination with WT virus, which retains the AccI site. (B) WT and a “locked in” version of 3DG64S (GGTgly to UCAser) were subjected to r-selection (3.5–4 hours and 4–4.5 hours, respectively) or control (24-hour) passages for 50 passages as described in the text. Heatmap shows all mutations identified at >0.025 frequency in ≥2 out of the 20 total lineages, colored by log frequency. Diagram at left shows regions of the poliovirus genome. (C) Fitness of indicated variants relative to WT as determined by competition assay. Each symbol is a replicate competition assay, and exact p-values for the key comparisons are provided in the main text. (D) Mutation rate of indicated variants in mutations per nucleotide per strand copied as determined by Luria Delbruck fluctuation test. Each symbol is a replicate fluctuation test, and exact p-values for the key comparisons are provided in the main text. (E) In vitro kinetics of purified RdRp. Purified RdRp (2 μM), primer template (1 μM), and ATP were incubated, and samples were quenched at the indicated time points (schematic). The kinetics of complex assembly and single-nucleotide incorporation are expressed as μM extended template (y-axis) over time (x-axis). Representative data are shown. Complete data from replicates can be found in S1 Data 2E. All plotted data can be found in S1 Data. RdRp, RNA-dependent RNA polymerase; WT, wild-type.
Fig 3
Fig 3. Adaptability of WT and 3DG64S over 20 passages in HeLa (A) or 12 passages in a 3T3 cell line derived from mice transgenic for the PVR (B).
Fitness values (≥3 replicate competition assays for each data point) were determined for populations from every fifth passage (panel A) or every fourth passage (panel B), and the adaptability in the top panels was expressed as the slope of the regression for log10 fitness over time for each of 5 independent lineages of WT (filled circles) and 3DG64S (open circles, blue) for each cell line. The bottom panels show all the data from the 5 lineages together with the regression of log10 fitness over time. Exact p-values for the difference between the slopes for WT and 3DG64S on HeLa (0.0129) and PVR-3T3 (0.0013) were derived from a mixed linear effects model (see Methods). All plotted data can be found in SI, S1 Data. HeLa, human epithelial cells; PVR, poliovirus receptor; WT, wild-type.
Fig 4
Fig 4. In vivo phenotype of WT and 3DG64S.
(A) Maximum likelihood optimization of a simple binomial model (see S1 Text Model 2) estimated an average inoculum to CNS bottleneck size of 2.67 (lambda 2.44; 95% CI 1.39–3.82) based on experimental data for 4 barcoded poliovirus populations [49]. Shown are outputs of 10,000 simulations of the model (number of mice with 1, 2, 3, or 4 barcodes represented in the CNS). Each simulation represents 27 mice, and each mouse has a bottleneck size drawn from a zero-truncated Poisson with an average lambda of 2.43 (blue) or 10 (magenta). Line is actual data from [49], the shaded regions represent the area occupied by 95% of the simulations, and the dark shaded regions represent the interquartile range of the simulations. (B) Survival curves showing mice with paralysis-free survival over time for groups infected intramuscularly with 105 pfu (left; n = 12 per virus), 106 pfu (center; n = 18 per virus), and 107 pfu (right; n = 18 per virus) of WT (black) or 3DG64S (dashed blue). *p < 0.05; ***p < 0.001 by log rank test. (C) Viral titer in brain and spinal cord 5 days post intravenous inoculation with 107 pfu of WT (filled circles) or 3DG64S (open circles). *p < 0.05; **p < 0.005 by Mann Whitney U test; n = 7 mice in each group (out of 8 that were infected, 1 mouse in each group had titers below the limit of detection, dotted line). (D) Histogram of frequencies of intrahost SNVs identified in the spinal cords of 12 mice from panel C (7 infected with WT and 5 infected with 3DG64S). Black, synonymous or noncoding; blue, nonsynonymous. (E) Survival curves showing mice with paralysis-free survival over time for groups (n = 43 per virus combined from 2 experiments) infected intramuscularly with 106 pfu of 3DG64S (dashed blue) or 3DG64S;2CV127L (orange). **p < 0.005 by log rank test; actual p-value 0.0012. (F) Survival curves showing mice with paralysis-free survival over time for groups (n = 43 per virus combined from 2 experiments) infected intramuscularly with 106 pfu of 3DG64S (dashed blue) or 3DG64S;I92T;K276R (pink). *p < 0.05 by log rank test; actual p-value 0.0411. All plotted data can be found in S1 Data. CNS, central nervous system; SNV, single-nucleotide variant; WT, wild-type.

Comment in

Similar articles

Cited by

References

    1. Duffy S, Shackelton LA, Holmes EC. Rates of evolutionary change in viruses: patterns and determinants. Nat Rev Genet. 2008;9: 267–276. doi: 10.1038/nrg2323 - DOI - PubMed
    1. Sanjuán R. From molecular genetics to phylodynamics: evolutionary relevance of mutation rates across viruses. PLoS Pathog. 2012;8: e1002685 doi: 10.1371/journal.ppat.1002685 - DOI - PMC - PubMed
    1. Orr HA. The rate of adaptation in asexuals. Genetics. Genetics Society of America; 2000;155: 961–968. - PMC - PubMed
    1. Sanjuán R, Nebot MR, Chirico N, Mansky LM, Belshaw R. Viral mutation rates. J Virol. 2010;84: 9733–9748. doi: 10.1128/JVI.00694-10 - DOI - PMC - PubMed
    1. Pfeiffer JK, Kirkegaard K. A single mutation in poliovirus RNA-dependent RNA polymerase confers resistance to mutagenic nucleotide analogs via increased fidelity. Proc Natl Acad Sci USA. 2003;100: 7289–7294. doi: 10.1073/pnas.1232294100 - DOI - PMC - PubMed

Publication types

MeSH terms

Substances

LinkOut - more resources