Review
. 2018 Nov;94(6):1175-1209.
doi: 10.1111/php.12967. Epub 2018 Aug 20.

Molecular Photoacoustic Contrast Agents: Design Principles & Applications

Affiliations
Review

Molecular Photoacoustic Contrast Agents: Design Principles & Applications

Raymond E Borg et al. Photochem Photobiol. 2018 Nov.

Abstract

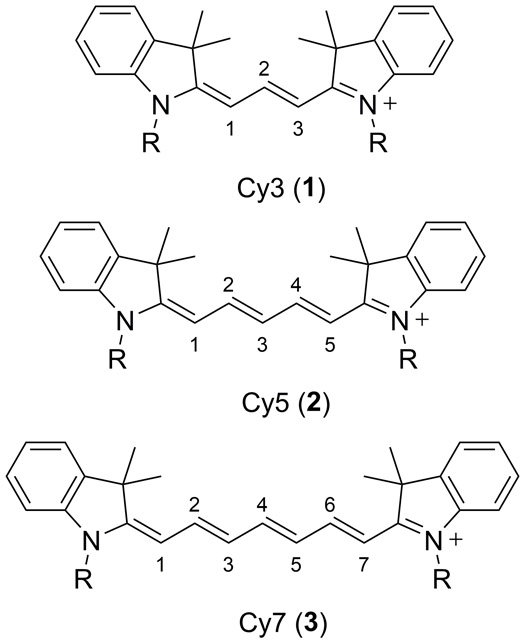
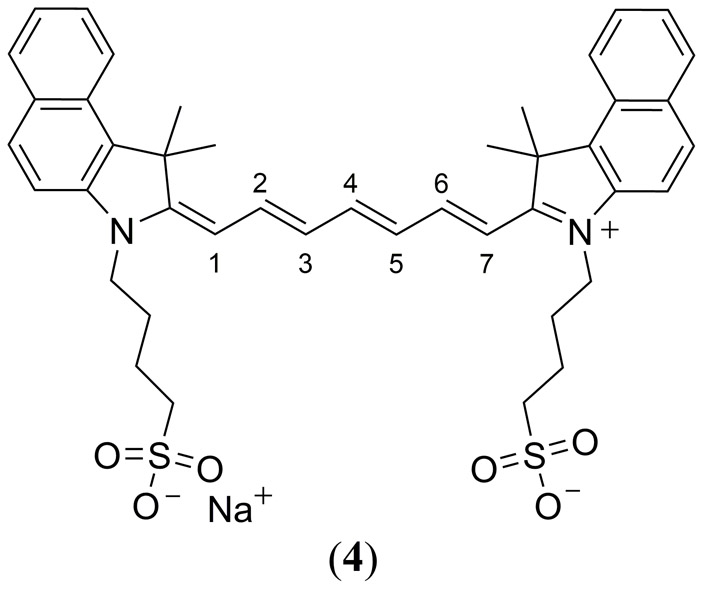
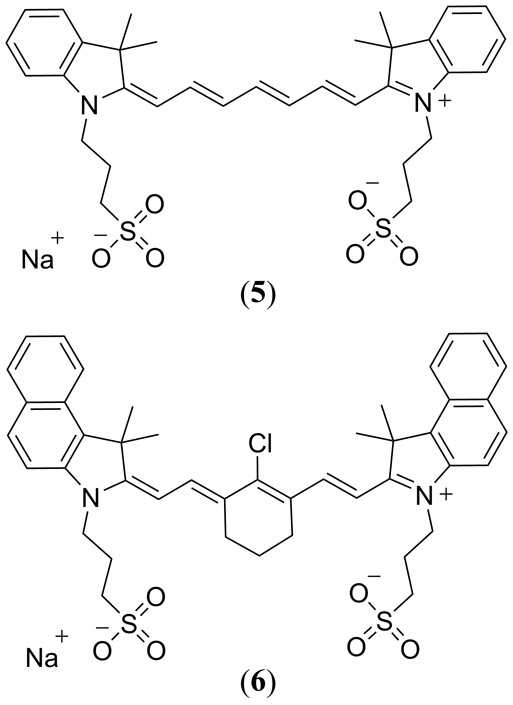
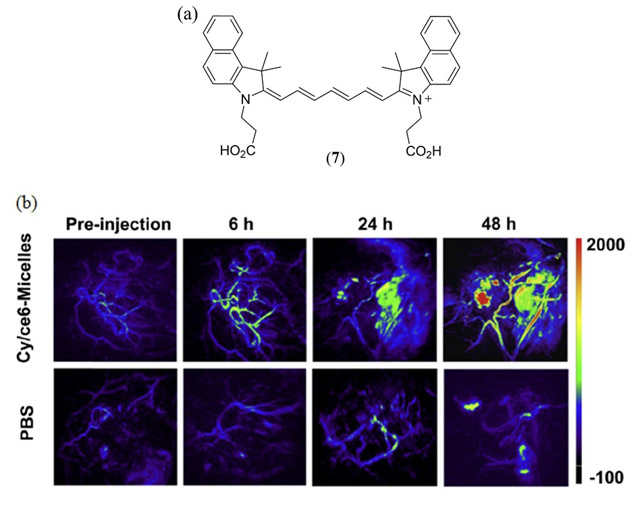
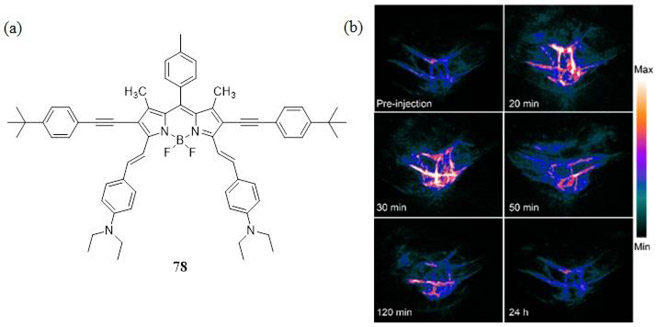
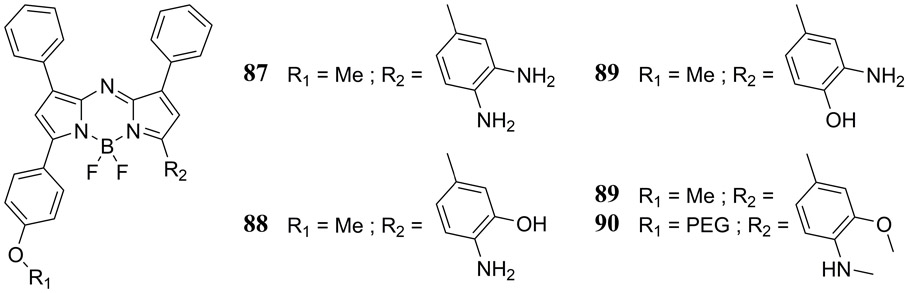
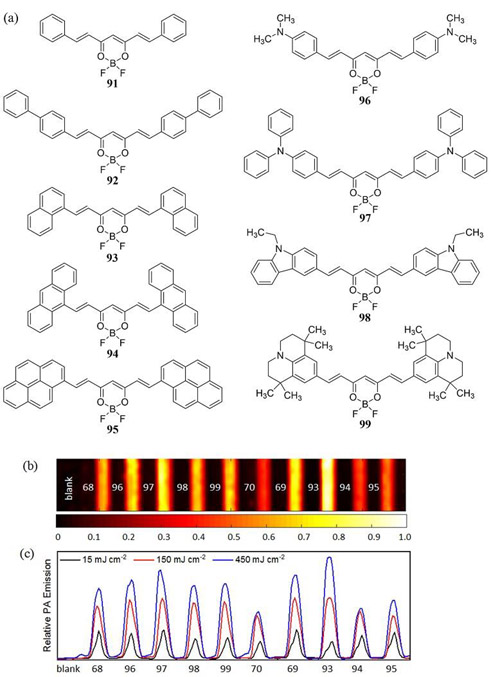
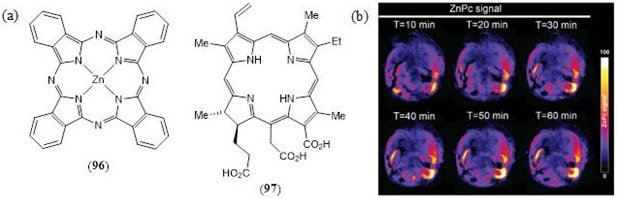
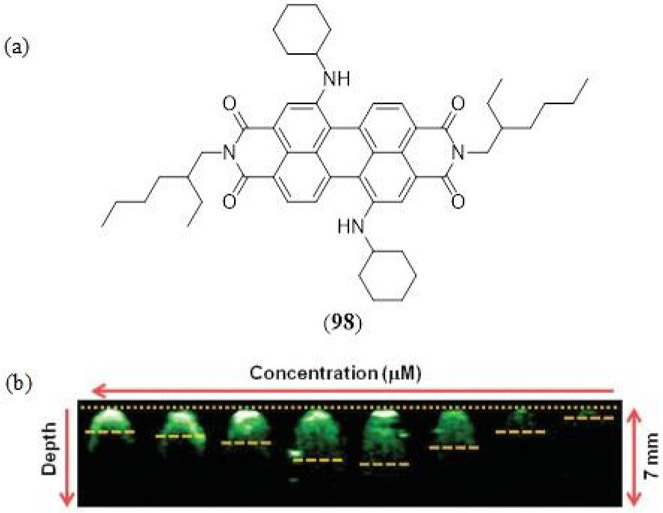
Photoacoustic imaging (PAI) is a rapidly growing field which offers high spatial resolution and high contrast for deep-tissue imaging in vivo. PAI is nonionizing and noninvasive and combines the optical resolution of fluorescence imaging with the spatial resolution of ultrasound imaging. In particular, the development of exogenous PA contrast agents has gained significant momentum of late with a vastly expanding complexity of dye materials under investigation ranging from small molecules to macromolecular proteins, polymeric and inorganic nanoparticles. The goal of this review is to survey the current state of the art in molecular photoacoustic contrast agents (MPACs) for applications in biomedical imaging. The fundamental design principles of MPACs are presented and a review of prior reports spanning from early-to-current literature is put forth.


Figures

Figure 1.
Figure 1.
Molecular structures of the Cy3 (1), Cy5 (2) and Cy7 (3) indocarbocyanine based dyes (65).
Figure 2.
Figure 2.
Molecular structure of the FDA approved indocyanine green (ICG) dye (4).
Figure 3.
Figure 3.
Structures of the ADS740WS (5) and ADS830WS (6) cyanine-based dyes reported by Laufer et al. (91).
Figure 4.
Figure 4.
(a) Molecular structure of the dicarboxy Cy7.5-based cypate cyanine dye (7) investigated by Guo et al. (92); (b) In vivo PAI of mice bearing the 4T1 tumor injected with PBS and 7/Ce6-micelles (7.5 mg/kg dosage) pre-injection and 6, 24, 48 h post-injection. Reproduced with permission from ref. . Copyright 2014 Elsevier.
Figure 5.
Figure 5.
Structure of the IC7–1-Bu (8) molecule reported by Temma et al. (93).
Figure 6.
Figure 6.
Molecular structures of the asymmetrical cyanine derivatives 9 - 11 reported by Onoe et al. with enhanced photostability relative to ICG (4) and 8 (94).
Figure 7.
Figure 7.
Molecular structure of the PEG-ylated ICG dye 12 reported by Kanazaki et al. to enhance its permeability and retention for improved in vivo PAI of allografted tumors in mice (98). This specific structure also illustrates the covalent conjugation of a 111In label for single-photon emission computed tomography (SPECT) and PAI (99).
Figure 8.
Figure 8.
(a) Molecular structure of the Cy5 containing co-polymer 13 reported by Lin et al. to form poly(ethylene glycol)2k-block-poly(D,L-lactide)zk (PEG-PLA) based nanoparticles (105); (b) PAI of a HeLa-tumor-containing mouse administered intratumorally with nanoparticles derived from 13. Reproduced with permission from ref. . Copyright 2016 American Chemical Society.
Figure 9.
Figure 9.
(a) The supramolecular bis-pyrene cyanine dye 14 reported by An et al. (106); (b) In vivo PAI of tumor-xenografted mice with normalized ICG vs. 14 amplitudes at various time intervals post-injection. Reproduced with permission from ref. . Copyright 2015 Royal Society of Chemistry.
Figure 10.
Figure 10.
Molecular structures of the IRDye800CW carboxylate (15) and IR-780 (16) cyanine dyes.
Figure 11.
Figure 11.
Molecular structures of the triethoxysilane functionalized Cy5.5 (17) and Cy7.5 (18) dyes reported by Biffi et al. for covalent assembly of silica-PEG based nanoparticles (109).
Figure 12.
Figure 12.
(a) Structure of the PA responsive Ca2+ chemosensor 19 reported by Mishra et al. (111); (b) PA contrast of 19 is illustrated with varying Ca2+ concentrations. Irreversibility of Ca2+ binding is also illustrated in the presence of EDTA. Reproduced with permission from ref. . Copyright 2016 American Chemical Society.
Figure 13.
Figure 13.
Structures of popular, commercially available fluorescein (20), phenolphthalein (21) and rhodamine derivatives (2224) previously used for PA studies.
Figure 14.
Figure 14.
Molecular structure of the commercially available Atto680 dye (25) and methylene blue (26).
Figure 15.
Figure 15.
(a) PA and (b) ultrasound (US) imaging before and after sonication of aqueous, methylene blue (26) doped, octafluoropropane microbubbles formed with a DPPC∶DPPA∶MPEG5000 (10∶1∶1.2) based lipid (132); (c) PA and US signal amplitude before and after sonication. Reproduced with permission from ref. . Copyright 2014 Society of Photographic Instrumentation Engineers.
Figure 16.
Figure 16.
Structures of the KSQ-2 (27) (56) and KSQ-4 (28) (57) squaraine dyes reported by Umezawa and coworkers.
Figure 17.
Figure 17.
(a) Molecular structure of the 4-(N,N’-dibenzylamino)phenyl substituted squaraine dye (29) used for PAI studies by An et al. (138). In vivo PAI of 4T1 tumor bearing mice (b) without and (c) with 29-albumin nanoparticle administration. Reproduced with permission from ref. . Copyright 2014 American Chemical Society.
Figure 18.
Figure 18.
Structure of the commercially available squaraine derivative, 2,4-Bis[4-(N,N-dibenzylamino)-2,6-dihydroxyphenyl]squaraine 30 investigated by Ho et al. (140).
Figure 19.
Figure 19.
(a) Molecular structures of the iodo (31) and chloro (32) substituted bis(N-butylindole) squaraine dyes investigated by Zhang et al. and Duan et al., respectively, for PAI (141, 143); (b) PAI of MCF-7 xenografted tumor bearing mice without (I,III, V) and with (II, IV, VI) administration of 31:liposome. (I) and (II) are representative photos of the tumor bearing mice; (III) and (IV) show one transverse slice in the 3D PA image; (V) and (VI) show aligned images from the different transverse section. Reproduced with permission from ref. . Copyright 2014 American Chemical Society.
Figure 20.
Figure 20.
A PEG-ylated squaraine dye reported by Sreejith et al. (142).
Figure 21.
Figure 21.
PAI of live mouse anatomy 40 min post-injection of 34 for (a) fasting and (b) post-food mice. Negligible signals indicate the formation of 34–thiol adducts in vivo. Reproduced with permission from ref. . Copyright 2016 Royal Society of Chemistry.
Figure 22.
Figure 22.
Molecular structure of the PEG-ylated 2,5-bis[(4-carboxylic-piperidylamino)thiophenyl]-croconaine (36) dye used Tang et al. (151) for nanoparticle self-assembly and in vivo PAI studies.
Figure 23.
Figure 23.
Molecular structures of δ-aminolevulinic acid (37) and protoporphyrin IX (38).
Figure 24.
Figure 24.
(a) Molecular structures of the porphyrin–phospholipid conjugates 39 investigated by Lovell et al. (167), Jin et al. (168), Ng et al. (169) and 40 investigated by Huynh et al. (101, 170); (b - e) In vivo imaging in a KB tumor xenograft 10–30 seconds post intravenous injection of bimodal (b, c) and trimodal (d, e) microbubbles derived from 40. US B-mode images show the soft tissue contrast of the tumor, US contrast mode and PA images illustrate the infusion of microbubbles (Scale bar 1 mm). Reproduced with permission from ref. . Copyright 2014 American Chemical Society.
Figure 25.
Figure 25.
Molecular structures of the quinoline-annulated porphyrin and morpholino bacteriochlorin based MPACs 41 - 46 reported by Abuteen et al. (175).
Figure 26.
Figure 26.
Molecular structures of the metallated quinone-fused porphyrin MPACs reported by Banala et al. where M = Co(II) (47), Ni(II) (48), Cu(II) (49) or Zn(II) (50) (176).
Figure 27.
Figure 27.
Structure of the water soluble NIR absorbing tetra-PEG-ylated quinolone annulated porphyrin 51 reported by Luciano et al. (178, 179).
Figure 28.
Figure 28.
Structures of the naphthalocyanine dyes studied by Lee et al. (180) and Zhang et al. (180) where M = Zn, R1 = t-Bu; R2 = H (52) and M = 2H, R1 = H; R2 = O-(CH2)3CH3 (53).
Figure 29.
Figure 29.
(a) Structure of the PEG-ylated tin(IV) chloride octabutoxynaphthalocyanine (PEG-Sn-ONc, 54) reported by Huang et al. (100); (b – d) Noninvasive PA computed tomography (PACT) images of brain blood vessels of mice administered with (b) 54 (c) the non-PEG-ylated derivative ONc and (d) a blank control, 1 h and 24 h post-injection. Reproduced with permission from ref. . Copyright 2016 American Chemical Society.
Figure 30.
Figure 30.
(a) Molecular structure of the phosphorous phthalocyanine based MPAC 55 utilized for PAI by Zhou et al. (181); (b) Trans-limb PA computed tomography (PACT) for 2 different adult human volunteers with overlaid PA (color) and US (gray) images. Reproduced with permission from ref. . Copyright 2016 Ivyspring International Publisher.
Figure 31.
Figure 31.
Molecular structures of monomeric porphyrin (56) and phthalocyanine (57) dyes utilized for silsesquioxane bridged nanoparticle synthesis by Mauriello-Jimenez et al. (183).
Figure 32.
Figure 32.
Structures of the NIR absorbing free-base porphyrin derivatives 5865 reported by Li et al. using the tetracyanoethene(TCNE), 7,7,8,8-tetracyanoquiodimethane (TCNQ) and 2,3,5,6-tetrafluoro-7,7,8,8-tetracyanoquiodimethane (F4-TCNQ) electron-withdrawing click-reagents (184).
Figure 33.
Figure 33.
(a) Structures of the 3,5-bis-styryl (MeOPh)2BODIPY dye 66, the non-styryl meso-(4-methoxycarbonylphenyl)BODIPY analogue 67, crystal violet (68), curcuminBF2 (69) and Cy3 (70) investigated by Frenette et al. (36). (b) PAI (dimension = 26.40 mm × 6.65 mm) of the same dyes recorded with a 10 MHz US transducer following 532 nm laser irradiation at a fluence of 366 mJ cm−2. Samples are dissolved in acetonitrile in sealed glass capillary tubes (1 mm internal diameter) housed in a room temperature water bath. The color scale represents the normalized acoustic intensity. Reproduced with permission from ref. . Further permissions related to the material excerpted should be directed to the American Chemical Society (https://pubs.acs.org/doi/abs/10.1021%2Fja508600x).
Figure 34.
Figure 34.
(a) Molecular structures for the ratiometric aza-BODIPY PA responsive Cu(II) probes reported by Li et al. (185). (b) PA images of 72 (10 μM in PBS + 0.1% Cremophor EL, pH 7.4) in fluorinated ethylene propylene tubing overlaid with a 1 cm thick phantom treated with 0 and 10 equiv of Cu(II), with excitation at 767 nm. Highest and lowest intensity PA amplitudes are indicated by white and black, respectively. Scale bar represents 2 mm. Reproduced with permission from ref. . Copyright 2015 American Chemical Society.
Figure 35.
Figure 35.
(a) Structure of the NIR absorbing naphthalene fused BODIPY dimer 73 reported by Ni et al. that demonstrated high photostability and a greater PA response than the ICG cyanine dye (186). (b) Time-dependent in vivo PA images of a Hep-G2-tumor bearing mouse anatomy after intravenous injection of 73 loaded (2.5 WT%) BSA nanoparticles. Reproduced with permission from ref. . Copyright 2016 Royal Society of Chemistry.
Figure 36.
Figure 36.
Structures of the NIR absorbing 3,5-bis(vinylaryl) BODIPY dyes reported by Ni et al. (187).
Figure 37.
Figure 37.
(a) Structure of the 2,6-bis-ethynyl 3,5-bis-vinyl-4-diethylaminophenyl BODIPY dye 78 used as a PAI based theranostic agent reported by Hu et al. (188). (b) In vivo PAI of A549 tumor-bearing mice at a different times after intravenous injection of 78 doped micelles. Reproduced with permission from ref. . Copyright 2016 American Chemical Society.
Figure 38.
Figure 38.
Structures of the 1,7-bis(N-ethylcarbazole)-3,5-bis(vinylphenyl) halogen substituted aza-BODIPY dyes 79 - 82 reported by Gawele et al. (189).
Figure 39.
Figure 39.
Structure of the NIR absorbing theranostic aza-BODIPY dye 83 reported by Tang et al. used to prepare micelle nanoparticles for photothermal imaging (PTI), PAI and PDT/PTT studies. (190).
Figure 40.
Figure 40.
Structures of NIR absorbing dimeric thiophene-bridged BODIPY (84, 85) and pyrrolopyrrole aza-BODIPY (86) dyes reported by Miki et al. (191).
Figure 41.
Figure 41.
Molecular structures of the PA nitric oxide probes reported by Reinhardt et al. (192).
Figure 42.
Figure 42.
(a) Molecular structures of difluoroboron curcumin dyes 91 - 99 reported by Bellinger et al. where a nonlinear reverse saturable absorber (RSA) PA response was tuned by modification of the terminal substituent (194). (b) PAT image recorded with a high laser fluence (450 mJ cm−2, λexc = 532 nm) and a 10 MHz US transducer including a solvent blank, crystal violet (68), curcuminBF2 (69) and Cy3 (70) for reference. Samples are dissolved in acetonitrile in sealed glass capillary tubes (1 mm internal diameter) housed in a room temperature water bath. The color scale represents the normalized acoustic intensity. (c) Plot of PAT amplitudes for all dyes at low (15 mJ cm−2), intermediate (150 mJ cm−2) and high (450 mJ cm−2) laser fluence illustrating the linear absorber (LA), saturable absorber (SA), and RSA behavior.
Figure 43.
Figure 43.
(a) Molecular structures of the zinc(II) phthalocyanine (96) and chlorin e6 (97) studied by Ho et al. (140) (b) Time lapse of PAI within 1h post injection of 96 in a MCF-7 xenograft mice model, demonstrating peak localization of 96 at the tumor site. Reproduced with permission from ref. . Copyright 2016 Macmillan Publishers Limited.
Figure 44.
Figure 44.
(a) Structure of the NIR absorbing perylene diimide MPAC reported by Fan et al. (196), (b) PAI coronal sections of 98 doped micelles with different concentrations (50 to 0.390625 nM) in agarose gel phantoms.
Figure 45.
Figure 45.
Structure of the benzobisthiadiazole dye, encapsulated in a β-caprolactone derived amphiphilic block polymer PEG-b-PCL micelle by Huang et al. to for PAI and PTT applications (197). Photograph of LDPE tubes with blood and BBT-2FT (a) on chicken tissue, (b) inside a stack of chicken tissue layers, (c) PAI acquired using a 2.25 MHz transducer at 1 cm and (d) 2 cm depth. Reproduced with permission from ref. . Copyright 2016 Royal Society of Chemistry.
Figure 46.
Figure 46.
Structures of the diphenylacetylene click-derived dyes used in tandem with the F4-TCNQ electron-acceptor by Li et al. to tune PA and photothermal properties (198).
Figure 47.
Figure 47.
(a) Molecular structures of the additional MPACs investigated by Hatamimoslehabadi et al. including zinc(II) meso-tetraphenylporphyrin (104), nile red (105), merocyanine 540 (106), C60 (107) and ruthenium tris(2,2’-bipyridine) (108). (b) PA emission of all MACs investigated by Hatamimoslehabadi et al. in tetrahydrofuran as a function of concentration measured at a high laser fluence (360 mJ cm−2, λexc = 532 nm) (199). Reproduced with permission from ref. . Copyright 2017 American Chemical Society.
Figure 48.
Figure 48.
Structures of the cell-permeable BAPTA-merocyanine-based PA calcium sensor (109) reported by Roberts et al. (200).
Scheme 1.
Scheme 1.
Thiol addition at the cyclobutene ring of the NIR absorbing squaraine 34 reported by Anees et al. for bimodal fluorescene and PA detection of biologically relevant thiols (144).
Scheme 2.
Scheme 2.
(a) Acid-based equilibrium of the pH sensitive, rotaxane encapsulated, croconaine dye 35 reported by Guha et al. (149); (b) Ratiometric PA images of two 35 containing phantoms in pH 5.0 and pH 7.4 buffer at 11–13 mm depth in light scattering media. Reproduced with permission from ref. . Copyright 2016 Royal Society of Chemistry.

References

    1. Bell AG (1880). “Upon the production and reproduction of sound by light.” Telegraph Engineers, Journal of the Society of 9(34): 404–426.
    1. Xu MH and Wang LHV (2006). “Photoacoustic imaging in biomedicine.” Rev. Sci. Instrum. 77(4).
    1. Kim C, Favazza C and Wang LHV (2010). “In Vivo Photoacoustic Tomography of Chemicals: High-Resolution Functional and Molecular Optical Imaging at New Depths.” Chem. Rev. 110(5): 2756–2782. - PMC - PubMed
    1. Ntziachristos V and Razansky D (2010). “Molecular Imaging by Means of Multispectral Optoacoustic Tomography (MSOT).” Chem. Rev. 110(5): 2783–2794. - PubMed
    1. Luo SL, Zhang EL, Su YP, Cheng TM and Shi CM (2011). “A review of NIR dyes in cancer targeting and imaging.” Biomaterials 32(29): 7127–7138. - PubMed

Publication types