. 2018 Sep 17;19(18):1944-1948.
doi: 10.1002/cbic.201800352. Epub 2018 Aug 8.

Super-resolution Imaging of Amyloid Structures over Extended Times by Using Transient Binding of Single Thioflavin T Molecules

Affiliations

Super-resolution Imaging of Amyloid Structures over Extended Times by Using Transient Binding of Single Thioflavin T Molecules

Kevin Spehar et al. Chembiochem. .

Abstract

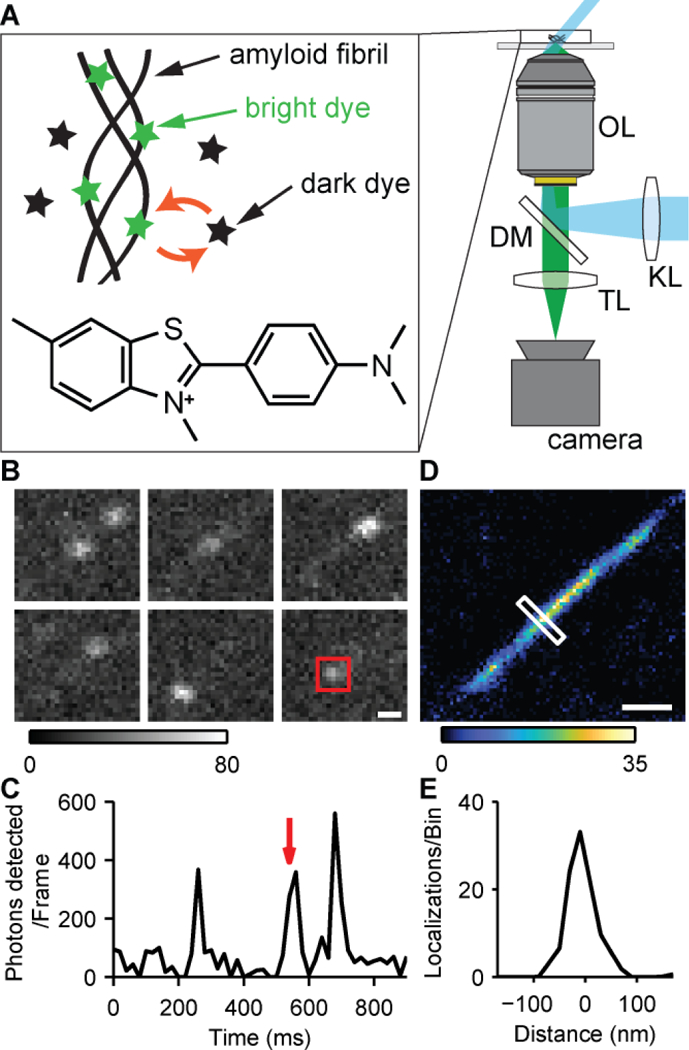
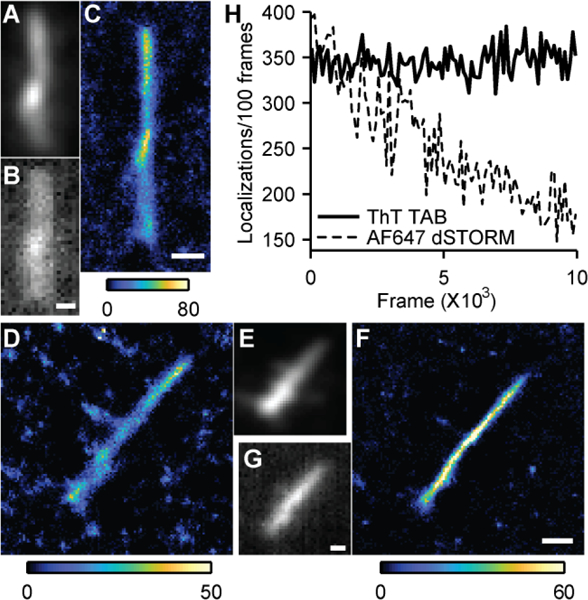
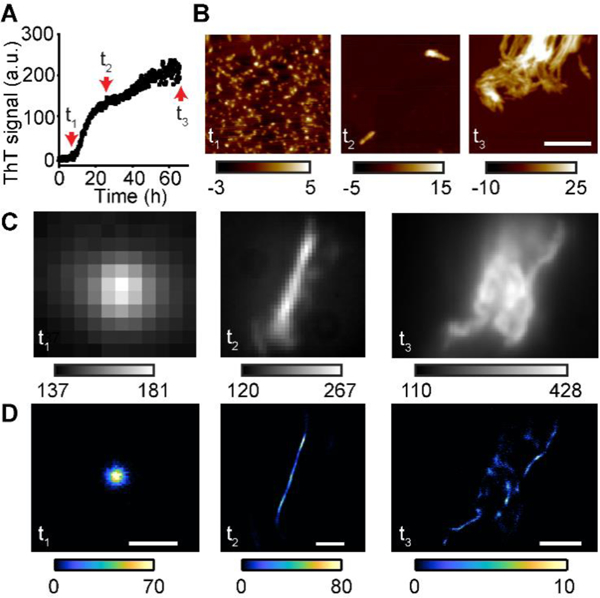
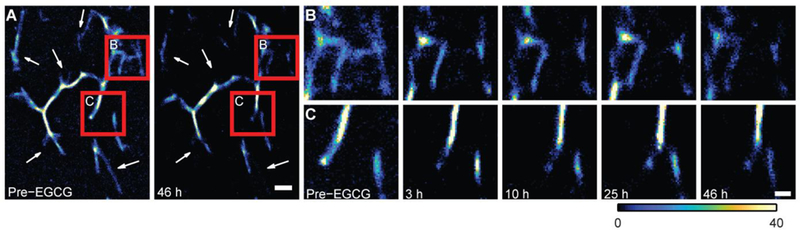
Oligomeric amyloid structures are crucial therapeutic targets in Alzheimer's and other amyloid diseases. However, these oligomers are too small to be resolved by standard light microscopy. We have developed a simple and versatile tool to image amyloid structures by using thioflavin T without the need for covalent labeling or immunostaining. The dynamic binding of single dye molecules generates photon bursts that are used for fluorophore localization on a nanometer scale. Thus, photobleaching cannot degrade image quality, allowing for extended observation times. Super-resolution transient amyloid binding microscopy promises to directly image native amyloid by using standard probes and record amyloid dynamics over minutes to days. We imaged amyloid fibrils from multiple polypeptides, oligomeric, and fibrillar structures formed during different stages of amyloid-β aggregation, as well as the structural remodeling of amyloid-β fibrils by the compound epi-gallocatechin gallate.

Keywords: amyloid beta-peptides; long-term imaging; single-molecule localization microscopy; single-molecule studies.


Figures

Figure 1.
Figure 1.
TAB microscopy. (A) Pseudo-TIRF illumination (cyan) excites fluorophores within the sample, and collected fluorescence (green) is imaged onto a camera. KL, widefield lens; OL, objective lens; DM, dichroic mirror; TL, tube lens. Two epi-fluorescence microscopes (1 and 2) were used for image acquisition (Fig. S1, Table S1). Inset: transient binding, fluorescence activation, and unbinding of ThT and its chemical structure. (B) ThT blinking on an Aβ42 fibril. Scale bar: 300 nm. Grey scale: photons/pixel. (C) Integrated photons detected over time within the red square in B. The red arrow indicates the frame containing the square in B. (D) TAB SR image of the Aβ42 fibril. Scale bar: 300 nm. Color scale: localizations/bin. (E) Cross-section of the white box across the fibril in D.
Figure 2.
Figure 2.
TAB SR imaging compared to conventional labelling. (A) Diffraction-limited image of an intrinsically-labeled Aβ42 fibril (4.2 % Aβ42-Alexa 647). (B) Diffraction-limited ThT image of the fibril in A. (C) TAB SR image of the fibril in A. (D) Conventional SR image of an Aβ42 fibril using Alexa-647 antibody staining. (E) Diffraction-limited image of D using Alexa-647. (F) TAB SR image of D. (G) Diffraction-limited ThT image of D. Color bars: localizations/bin. Scale bars: 300 nm. (H) Localizations per 100 frames over time for TAB and dSTORM imaging.
Figure 3.
Figure 3.
Visualization of Aβ40 structures at various aggregation stages. (A) Aggregation kinetics of Aβ40 measured by ThT fluorescence. t1 (8 h), t2 (24 h), and t3 (66 h) represent oligomers, early fibrils and late fibril clusters, respectively. (B) AFM images of Aβ40 at t1, t2, and t3. Color bar in nm. Scale bars: 350 nm. (C) Diffraction-limited images of Aβ40 aggregates using ThT fluorescence at t1, t2, and t3. (D) TAB SR images of the structures in C. Fluorescence from out-of-focus structures decreased localizations in t3. Scale bars for t1, t2, and t3 are 0.5, 1, and 2.5 μm, respectively.
Figure 4.
Figure 4.
TAB SR images of Aβ42 fibril remodeling. (A) Aβ42 before and after a 46-hour reaction with EGCG (1 mM). White arrows denote regions with distinct changes. Scale bar: 500 nm. (B and C) Time-lapse TAB images of regions denoted by red squares in A, recorded before and 3, 10, 25, and 46 h after adding EGCG; scale bar: 200 nm; color bar denotes localizations/bin.

References

    1. Harper JD, Lansbury PT, Annu. Rev. Biochem. 1997, 66, 385–407. - PubMed
    1. Masters CL, Simms G, Weinman NA, Multhaup G, McDonald BL, Beyreuther K, Proc. Natl. Acad. Sci. 1985, 82, 4245–4249. - PMC - PubMed
    1. Beyreuther K, Masters CL, Brain Pathol. 1991, 1, 241–251. - PubMed
    1. Cohen E, Bieschke J, Perciavalle RM, Kelly JW, Dillin A, Science 2006, 313, 1604–1610. - PubMed
    1. Haass C, Selkoe DJ, Nat. Rev. Mol. Cell Biol. 2007, 8, 101–12. - PubMed

Publication types

MeSH terms

LinkOut - more resources