Review
. 2018 Jun 28;7(13):e008564.
doi: 10.1161/JAHA.118.008564.

Imaging Cardiovascular Calcification

Affiliations
Review

Imaging Cardiovascular Calcification

Ying Wang et al. J Am Heart Assoc. .
No abstract available

Keywords: atherosclerosis; calcification; imaging.


Figures

Figure 1
Figure 1
The link between inflammation, microcalcification, and macrocalcification. A large necrotic core, a thin fibrous cap, and an intense inflammation are key precipitants of acute plaque rupture and myocardial infarction. Intimal calcification is thought to occur as a healing response to this intense necrotic inflammation. However, the early stages of microcalcification (detected by 18F‐fluoride positron emission tomography) are conversely associated with an increased risk of rupture. In part, this is because of residual plaque inflammation and in part because microcalcification itself increases mechanical stress in the fibrous cap, further increasing propensity to rupture. With progressive calcification, plaque inflammation becomes pacified and the necrotic core is walled off from the blood pool. The later stages of macrocalcification (detected by noninvasive imaging techniques such as computed tomography [CT] and magnetic resonance imaging [MRI], and by invasive imaging techniques such as intravascular ultrasound and optical coherence tomography) are, therefore, associated with plaque stability and a lower risk of that plaque rupturing (Illustration credit: Ben Smith). Reprinted from Dweck et al16 with permission. Copyright ©2016, Wolters Kluwer Health, Inc. Promotional and commercial use of the material in print, digital or mobile device format is prohibited without the permission from the publisher Wolters Kluwer. Please contact permissions@lww.com for further information.
Figure 2
Figure 2
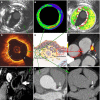
Multimodality imaging of cardiovascular calcification. Representative illustration of current and emerging calcification imaging multimodalities. Each modality offers unique measurements of calcification. Together, they offer the molecular, anatomical, and functional imaging of calcification, which can be used to make sense of current calcific activity, the procession of atherosclerosis, and overall disease burden in patients. A, Grayscale intravascular ultrasound (IVUS) image demonstrating a heavily calcified plaque. B, Integrated backscatter‐IVUS image demonstrating 2‐dimensional color‐coded map (red: calcification, yellow: dense fibrosis, green: fibrosis, blue and purple: lipid pool). C, Virtual histology IVUS image demonstrating coronary plaque with dense calcifications (white color) with corresponding grayscale IVUS image. D, Optical coherence tomography (OCT) image demonstrating coronary arterial calcification (arrows indicate well‐demarcated calcification). E, Pathogenic processes demonstrating the atherosclerotic plaque, including lipid core and calcification. Two forms of calcification can be seen: microcalcification and macrocalcification. Each form of calcification is linked with a related visual imaging modality. Green arrows link macrocalcification with many imaging techniques (including computed tomography [CT], magnetic resonance imaging [MRI], [IVUS], and [OCT]), which can visualize the macrocalcification in plaque, whereas the red arrow links microcalcification with the 18F‐NaF positron emission tomography (PET) imaging technique, which can visualize the microcalcification in plaque. F, 18F‐NaF (PET)–CT image demonstrating high tracer uptake (red arrow) in the left anterior descending artery culprit lesion revealing active plaque microcalcification and no tracer uptake (white arrow) in the nonculprit lesion. G, Three‐dimensional (3D) Isotropic‐Resolution Black‐Blood MRI (3D‐MERGE) image demonstrating clearly calcification of right carotid plaque (arrow). H, Transverse contrast‐enhanced coronary CT angiography image demonstrating an area of calcium (white arrow) in the left anterior descending coronary artery. I, Non‐contrast‐enhanced calcium scoring image demonstrating an area of calcium (white arrow) in the left anterior descending coronary artery. A and C, Reprinted from van Velzen et al18 with permission. Copyright ©2011, Wiley. B, Reprinted from Kawasaki et al19 with permission. Copyright ©2015, MDPI AG, Basel, Switzerland. D, Reprinted from Batty et al20 with permission. Copyright ©2016, Wiley. E, Reprinted from Tarkin et al21 with permission. Copyright ©2014, Wiley. F, Reprinted from Joshi et al22 with permission. Copyright ©2014, Elsevier Inc. G, Reprinted from Balu et al23 with permission Copyright ©2010, Wiley.
Figure 3
Figure 3
18F‐NaF uptake is increased in coronary artery culprit lesions. Joshi et al evaluated 18F‐NaF uptake in the coronary arteries, using positron emission tomography/computed tomography (PET/CT) imaging in the coronary arteries in individuals who had a recent myocardial infarction. A red arrow marks the site of severe stenosis, which is the culprit lesion (left anterior descending artery), while a white arrow marks the site of severe stenosis, which is a bystander non‐culprit lesion (circumflex artery) on invasive coronary angiography for 2 patients (A and C). 18F‐NaF PET imaging in those same individuals (B and D) shows intense 18F‐NaF activity at the site of the culprit left anterior descending artery lesions, but at the site of non‐culprit lesions, the CT image demonstrates obvious calcification, whereas there is no 18F‐NaF activity at this site. Group mean data (E) demonstrate that 18F‐fluoride activity in the culprit lesions is higher than that in non‐culprit vessels. Reprinted from Joshi et al22 with permission. Copyright ©2014, Elsevier Inc.
Figure 4
Figure 4
18F‐Fluoride preferentially binds microcalcification beyond the resolution of computed tomography (CT). Images are taken ex vivo of a carotid endarterectomy specimen excised from a patient who had a recent stroke. A, Histological section of the excised plaque stained for calcium with Alizarin red. B, Filled black arrow shows an area of dense macroscopic calcification that is visible on micro‐CT. By comparison, the empty black arrowhead demonstrates areas of microcalcification that are beyond the resolution of the micro‐CT but by comparison demonstrate avid binding with 18F‐NaF on both autoradiography (C) and micro–positron emission tomography imaging (D). E, A second carotid endarterectomy sample from a patient post stroke demonstrates a large macrocalcific deposit on micro‐CT. F, Autoradiography shows that although 18F‐NaF is able to bind to the surface of the plaque, it is unable to penetrate into the center. G, The amount of fluoride adsorbed to microcalcifications is significantly higher than macrocalcifications (F/Ca ratio in microcalcifications 0.59±0.23 (n=10, individual plaques) ; in macrocalcifications 0.37±0.15 (n=7, individual plaques)); *P<0.02 using an ANOVA and Tukey Kramer post hoc test. As a consequence of this effect, 18F‐NaF binds preferentially to regions of microcalcification compared with macroscopic deposits. Reprinted from Irkle et al17 with permission. Copyright ©2015, Nature Publishing Group, a division of Macmillan Publishers Limited.

References

    1. Hartiala O, Magnussen CG, Kajander S, Knuuti J, Ukkonen H, Saraste A, Rinta‐Kiikka I, Kainulainen S, Kǎhǒnen M, Hutri‐Kǎhǒnen N, Laitinen T, Lehtimǎki T, Viikari JS, Hartiala J, Juonala M, Raitakari OT. Adolescence risk factors are predictive of coronary artery calcification at middle age: the Cardiovascular Risk in Young Finns Study. J Am Coll Cardiol. 2012;60:1364–1370. - PubMed
    1. Abdelbaky A, Corsini E, Figueroa AL, Fontanez S, Subramanian S, Ferencik M, Brady TJ, Hoffmann U, Tawakol A. Focal arterial inflammation precedes subsequent calcification in the same location: a longitudinal FDG‐PET/CT study. Circ Cardiovasc Imaging. 2013;6:747–754. - PubMed
    1. Hayden MR, Tyagi SC, Kolb L, Sowers JR, Khanna R. Vascular ossification–calcification in metabolic syndrome, type 2 diabetes mellitus, chronic kidney disease, and calciphylaxis‐calcific uremic arteriolopathy: the emerging role of sodium thiosulfate. Cardiovasc Diabetol. 2005;4:4. - PMC - PubMed
    1. Vengrenyuk Y, Carlier S, Xanthos S, Cardoso L, Ganatos P, Virmani R, Einav S, Gilchrist L, Weinbaum S. A hypothesis for vulnerable plaque rupture due to stress‐induced debonding around cellular microcalcifications in thin fibrous caps. Proc Natl Acad Sci USA. 2006;103:14678–14683. - PMC - PubMed
    1. Genders TS, Pugliese F, Mollet NR, Meijboom WB, Weustink AC, van Mieghem CA, de Feyter PJ, Hunink MG. Incremental value of the CT coronary calcium score for the prediction of coronary artery disease. Eur Radiol. 2010;20:2331–2340. - PMC - PubMed

Publication types

MeSH terms

LinkOut - more resources