. 2018 Jun 29;360(6396):1447-1451.
doi: 10.1126/science.aas9160.

A method for single-neuron chronic recording from the retina in awake mice

Affiliations

A method for single-neuron chronic recording from the retina in awake mice

Guosong Hong et al. Science. .

Abstract

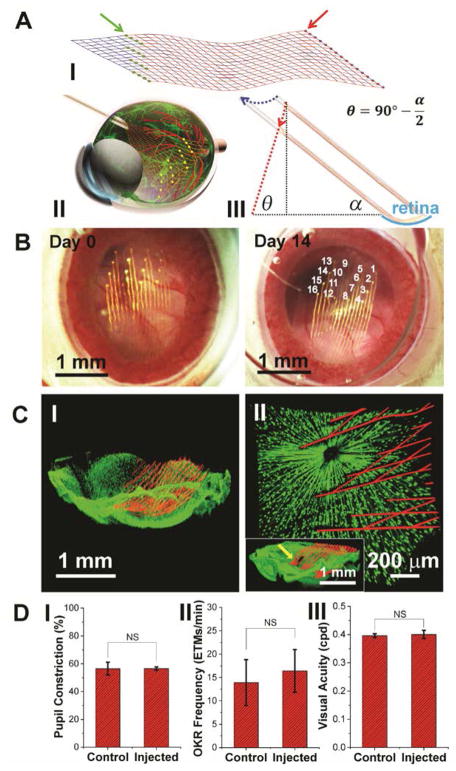
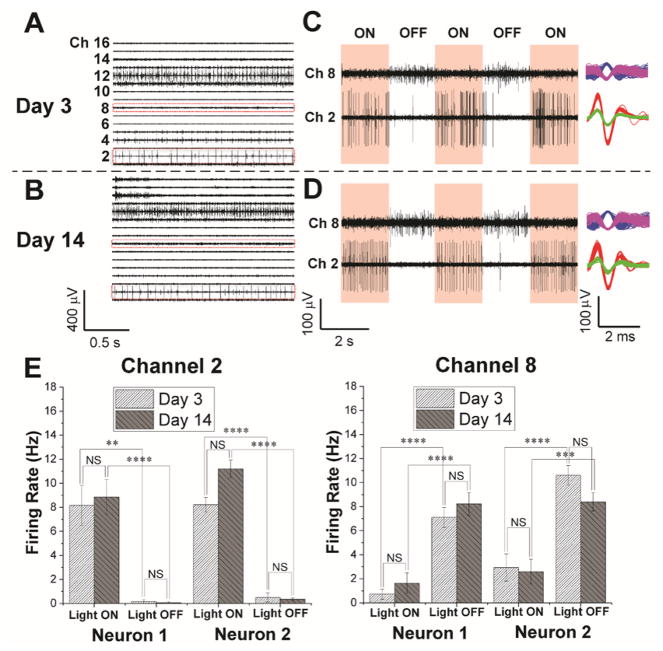
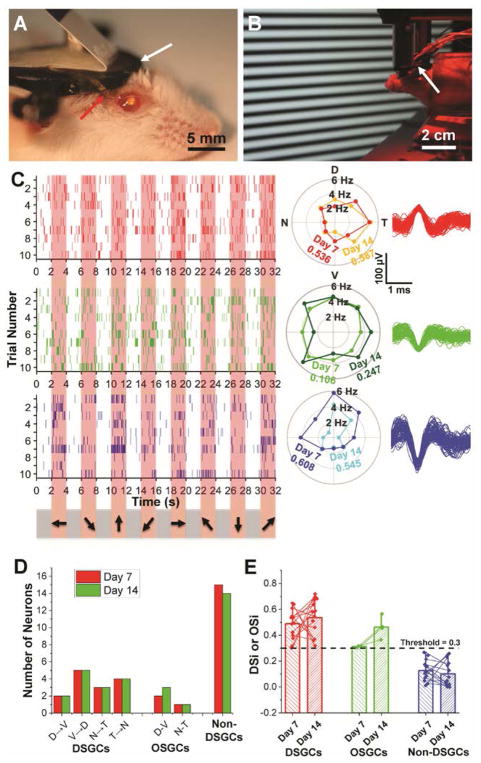
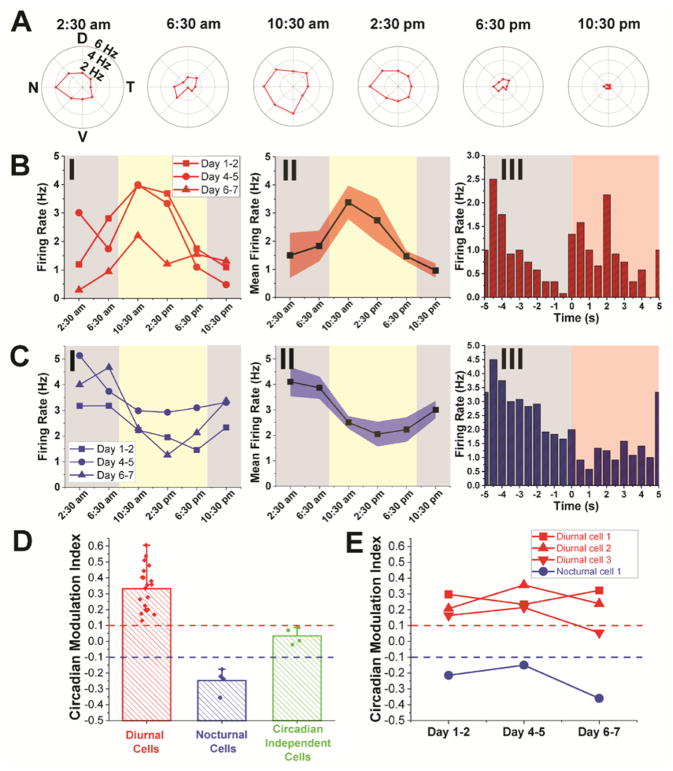
The retina, which processes visual information and sends it to the brain, is an excellent model for studying neural circuitry. It has been probed extensively ex vivo but has been refractory to chronic in vivo electrophysiology. We report a nonsurgical method to achieve chronically stable in vivo recordings from single retinal ganglion cells (RGCs) in awake mice. We developed a noncoaxial intravitreal injection scheme in which injected mesh electronics unrolls inside the eye and conformally coats the highly curved retina without compromising normal eye functions. The method allows 16-channel recordings from multiple types of RGCs with stable responses to visual stimuli for at least 2 weeks, and reveals circadian rhythms in RGC responses over multiple day/night cycles.


Figures

Fig. 1
Fig. 1. Non-coaxial intravitreal injection and conformal coating of mesh electronics on the mouse retina
(A) I, Schematic showing the layout of mesh electronics comprising 16 recording electrodes (green dots indicated by a green arrow) and I/O pads (red dots indicated by a red arrow). II, Schematic showing non-coaxial intravitreal injection of mesh electronics onto the RGC layer. Multiplexed recording electrodes are shown as yellow dots. III, Schematic of non-coaxial injection that allows controlled positioning of mesh electronics on the concave retina surface (cyan arc). The blue and red dotted arrows indicate the motion of the needle and desired trajectory of the top end of the mesh, respectively (see fig. S1 for details) (22). (B) In vivo through-lens images of the same mouse eye fundus on Day 0 and Day 14 post-injection of mesh electronics, with electrode indexing in the Day 14 image (22). (C) Ex vivo imaging of the interface between injected mesh electronics (red, mesh polymer elements) and the retina (green dots, RGCs) on Day 0 (I) and 7 (II) post-injection. The inset of II shows the region indicated by a yellow arrow where the high-resolution image was taken (22). (D) Comparison of pupillary reflex (n = 3), OKR (n = 5) and visual acuity (n = 3) between control and injected mouse eyes. The error bars indicate ±1 standard deviation (s.d.). NS, not significant (P > 0.05). One-way ANOVA test is used for statistical analyses.
Fig. 2
Fig. 2. Chronic 16-channel in vivo electrophysiology of single RGCs measured with mesh electronics
(A and B) Representative 16-channel recordings from the same mesh electronics delivered onto a mouse retina on Day 3 (A) and 14 (B) post-injection. (C and D) Light modulation of two representative channels (Ch2 and Ch8) in red dashed boxes in panels (A) and (B) on Day 3 (C) and 14 (D) post-injection. The red shaded and unshaded regions indicate the light ‘ON’ and ‘OFF’ phases, respectively. Representative sorted spikes assigned to different neurons on both days are shown in the rightmost column for each channel. Each distinct color in the sorted spikes represents a unique identified neuron. (E) Firing rates of all sorted neurons from Ch2 and Ch8 during light modulations on Day 3 and 14 post-injection (22). The error bars indicate ±1 standard error of the mean (s.e.m.). **, ***, **** indicate P value of < 0.01, < 0.001, < 0.0001, respectively, and NS is not significant (P > 0.05), respectively. One-way ANOVA test is used for statistical analyses. n = 5 for mice used for multiplexed recordings.
Fig. 3
Fig. 3. Chronic in vivo recording and tracking of the same DSGCs
(A) Photograph showing a mouse immediately after mesh injection. The red and white arrows indicate part of mesh electronics outside of the eye and a head-plate for head fixation. (B) Red-light photograph showing in vivo recording of DSGCs in response to moving grating stimulations (22). (C) Raster (left), polar plots (center) and overlaid spike waveforms (right) of single-unit firing events of three neurons with corresponding colors, from Ch8 in response to moving grating stimulations on Day 7 and 14 post-injection. In the raster plots, the pink shaded regions correspond to times when gratings were displayed on the screen with moving directions indicated by arrows on the bottom (22). Only the raster plots on Day 7 are shown. In the polar plots, DSi for each cell on different days is labeled with corresponding colors. (D) Bar chart summarizing numbers of identified DSGCs, OSGCs and non-DSGCs on Day 7 (red bars) and Day 14 (green bars) post-injection. (E) Bar chart with overlaid scatter plot of DSi or OSi of all RGCs on Day 7 and 14, with thin lines of corresponding colors connecting the same neurons identified on both days. The bar height and the whisker indicate the mean and maximum of DSi/OSi values, respectively. n = 4 for mice used for direction and orientation selectivity studies, while data from one representative mouse is shown in this figure.
Fig. 4
Fig. 4. Chronic circadian modulation of individual RGC activity
(A) Representative polar plots of a DSGC at different times in one complete circadian cycle on Days 4–5 post-injection. All graphs are plotted in same range of firing frequencies. (B) Firing rates of the same DSGC in (A)averaged over preferred directions in three complete circadian cycles on Days 1–2, 4–5 and 6–7 post-injection (I), and the mean firing rate by taking the average over these three circadian cycles (II). This DSGC is identified as an ON-OFF transient type (III). (C) Firing rates of another DSGC averaged over preferred directions on three complete circadian cycles on Days 1–2, 4–5 and 6–7 post-injection (I), and the mean firing rate by taking the average over these three circadian cycles (II). This DSGC is identified as an OFF transient type (III). The yellow and gray shaded regions in panels I and II of both (B) and (C) indicate diurnal and nocturnal circadian times, respectively, while the red shaded and white regions in panel III of both (B) and (C) indicate light ON and OFF phases, respectively. Red and blue shaded regions in panels (B), II and (C), II reflect ±1 s.e.m. (D) Bar chart with overlaid scatter plot of the CMi of diurnal cells (red bars), nocturnal cells (blue bars) and circadian independent cells (green bars) (22). The bar height and the whisker indicate the mean and maximum of CMi values, respectively. (E) Plots showing the evolution of CMi values for four representative cells (three diurnal cells and one nocturnal cells) that were recorded for three complete circadian cycles. Red and blue dashed lines in both (D) and (E) indicate the threshold for defining diurnal and nocturnal cells, respectively. n = 3 for mice used for circadian modulation study of RGC activity.

References

    1. Masland RH. The neuronal organization of the retina. Neuron. 2012;76:266–280. - PMC - PubMed
    1. Hoon M, Okawa H, Della Santina L, Wong RO. Functional architecture of the retina: development and disease. Prog Retin Eye Res. 2014;42:44–84. - PMC - PubMed
    1. Sanes JR, Masland RH. The Types of Retinal Ganglion Cells: Current Status and Implications for Neuronal Classification. Annu Rev Neurosci. 2015;38:221–246. - PubMed
    1. Baden T, et al. The functional diversity of retinal ganglion cells in the mouse. Nature. 2016;529:345–350. - PMC - PubMed
    1. Lewis CM, Bosman CA, Fries P. Recording of brain activity across spatial scales. Curr Opin Neurobiol. 2015;32:68–77. - PubMed

Publication types