. 2018 Jun 28;9(1):2532.
doi: 10.1038/s41467-018-04770-z.

Quantitative spatial analysis of haematopoiesis-regulating stromal cells in the bone marrow microenvironment by 3D microscopy

Affiliations

Quantitative spatial analysis of haematopoiesis-regulating stromal cells in the bone marrow microenvironment by 3D microscopy

Alvaro Gomariz et al. Nat Commun. .

Abstract

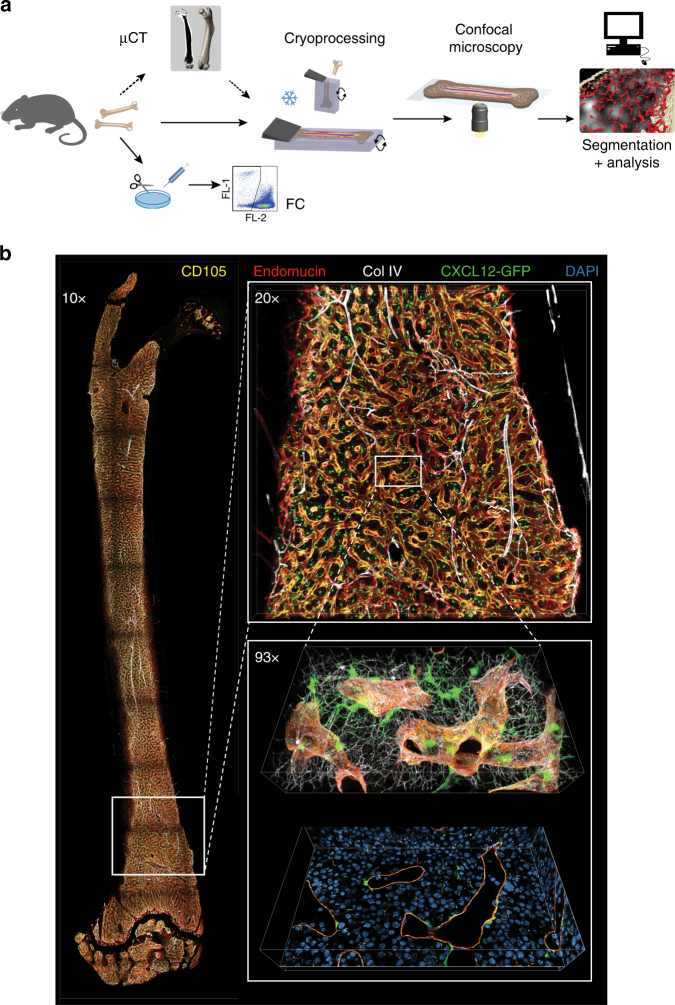
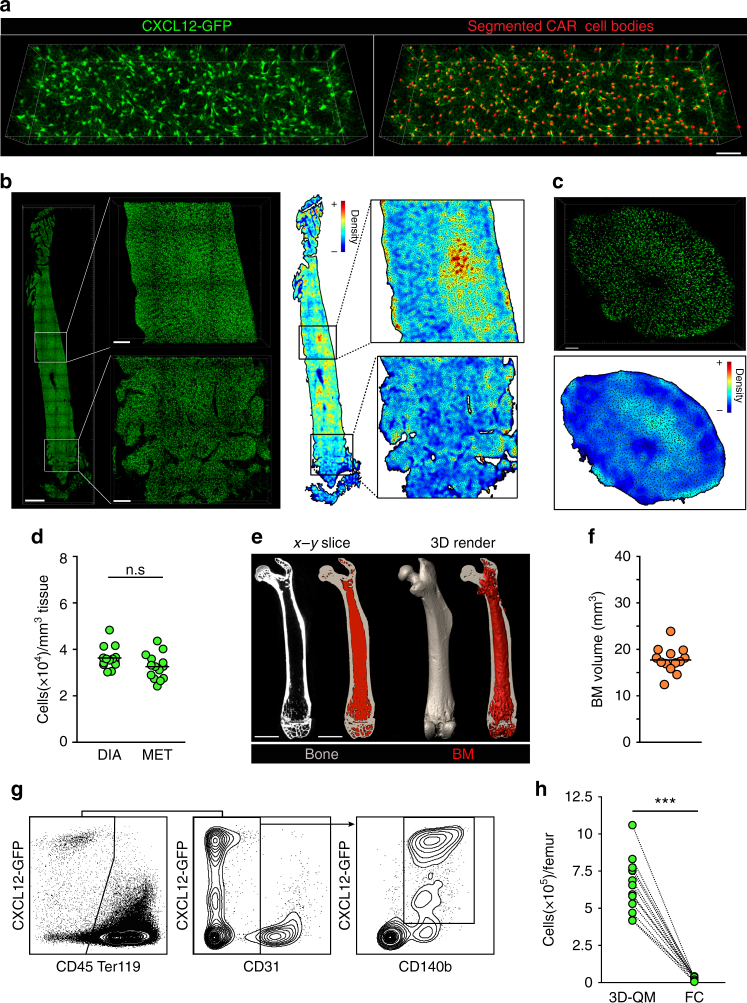
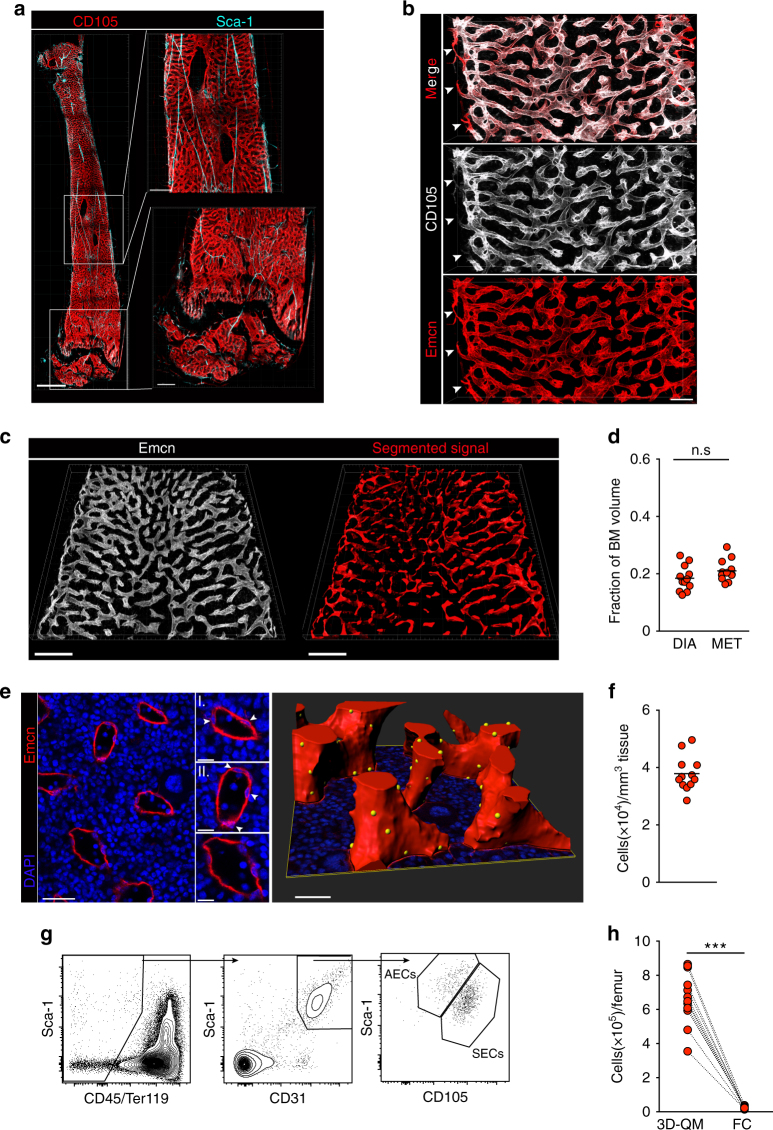
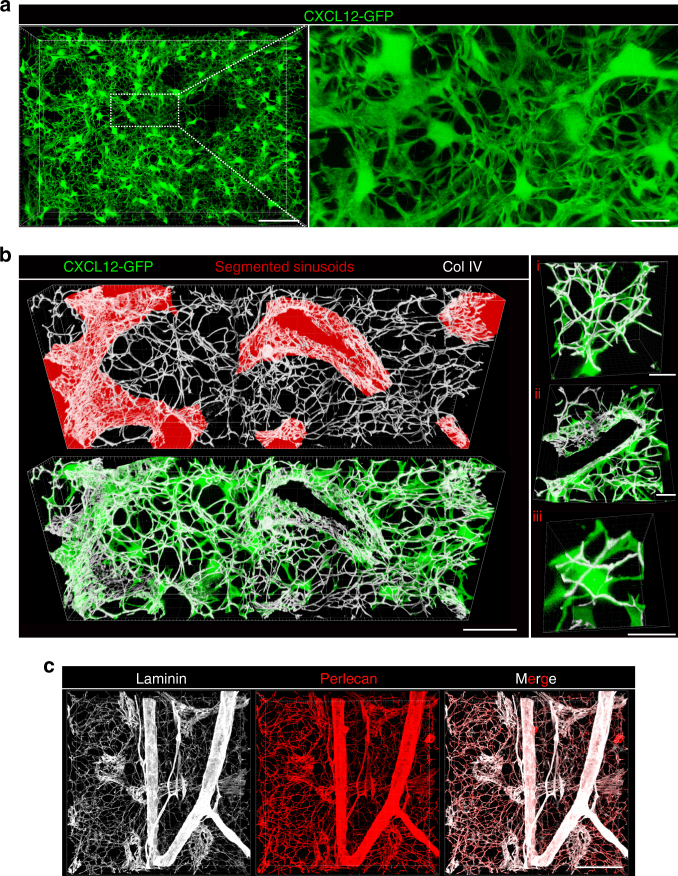
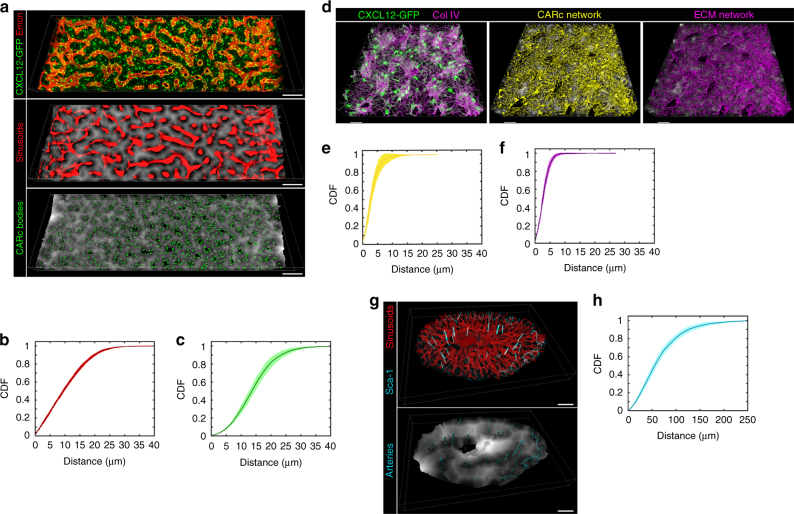
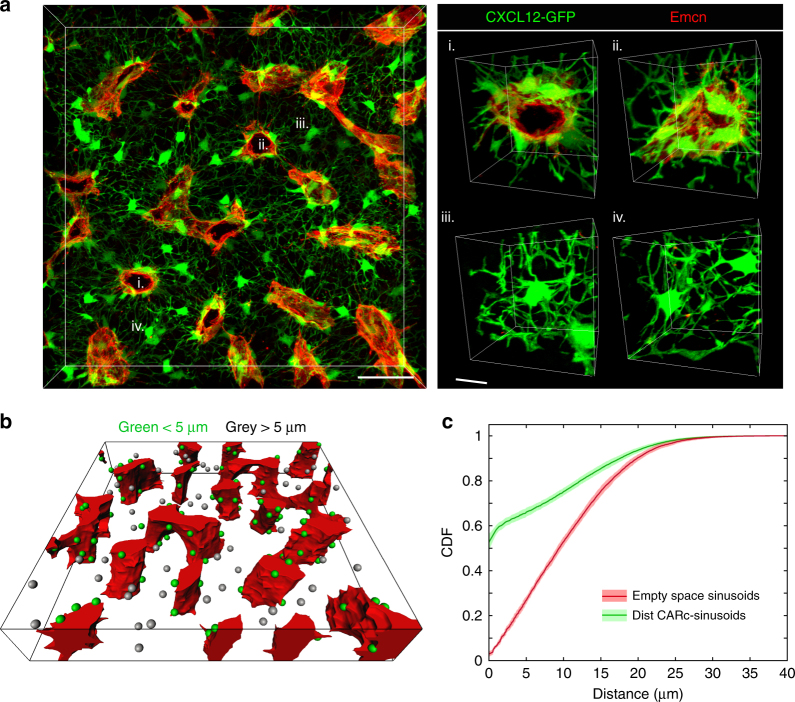
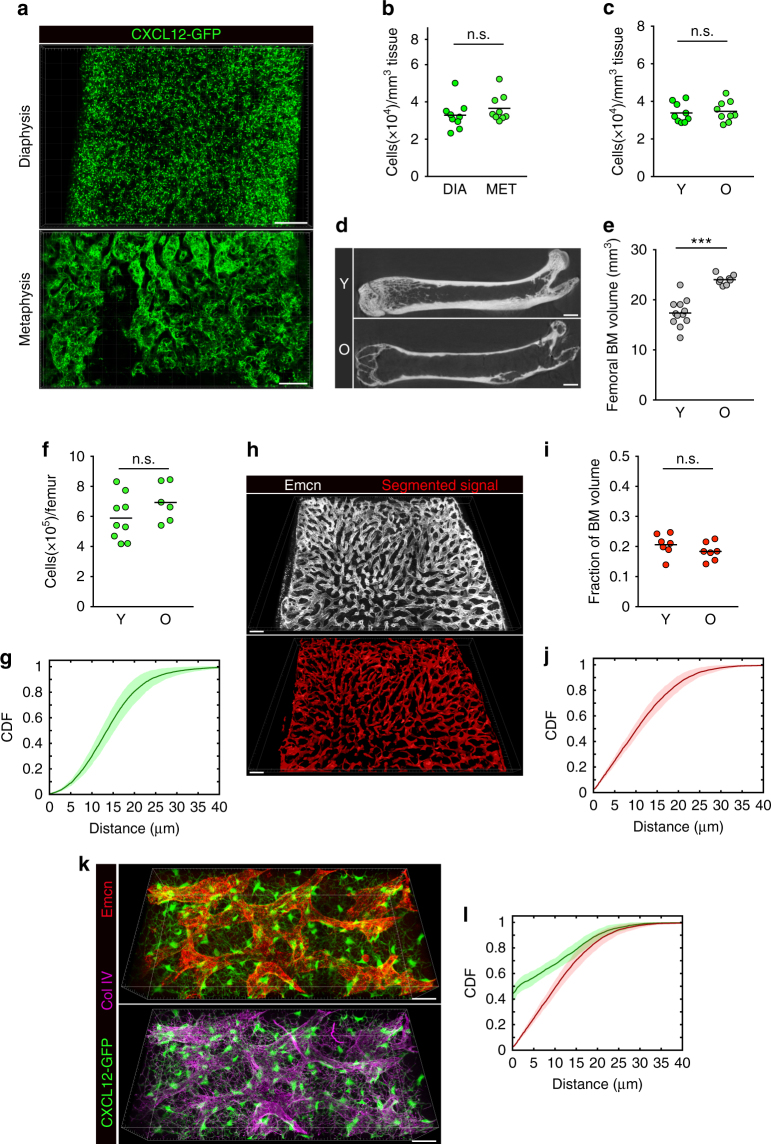
Sinusoidal endothelial cells and mesenchymal CXCL12-abundant reticular cells are principal bone marrow stromal components, which critically modulate haematopoiesis at various levels, including haematopoietic stem cell maintenance. These stromal subsets are thought to be scarce and function via highly specific interactions in anatomically confined niches. Yet, knowledge on their abundance, global distribution and spatial associations remains limited. Using three-dimensional quantitative microscopy we show that sinusoidal endothelial and mesenchymal reticular subsets are remarkably more abundant than estimated by conventional flow cytometry. Moreover, both cell types assemble in topologically complex networks, associate to extracellular matrix and pervade marrow tissues. Through spatial statistical methods we challenge previous models and demonstrate that even in the absence of major specific interaction forces, virtually all tissue-resident cells are invariably in physical contact with, or close proximity to, mesenchymal reticular and sinusoidal endothelial cells. We further show that basic structural features of these stromal components are preserved during ageing.


Conflict of interest statement

The authors declare no competing interests.

Figures

Fig. 1
Fig. 1
3D quantitative microscopy (3D-QM) of murine BM femoral cavities. a Schematic representation of the experimental workflow for preparation, image acquisition and software-based analysis in multiscale imaging of BM tissues. For quantification of total BM volume, femurs are first scanned by µ-CT and then cryopreserved and sectioned for subsequent confocal microscopy. The resulting 3D images are processed and analysed by 3D-QM to quantify mean cellular densities. Cell suspensions from contralateral femurs are prepared and analysed by flow cytometry (FC) when a pairwise comparison of data generated by both methodologies is required. b Examples of images acquired at different magnifications covering the entire femoral slice, to subcellular levels of resolution of an immunostained BM from a Cxcl12-Gfp transgenic mouse (10×, 20× and 93× magnification). Lower image depicts a single optical section and an orthogonal slice of a confocal image stack in which dimensions in the z-axis and details on the nuclear staining with DAPI are visible. See also Supplementary Movie 1
Fig. 2
Fig. 2
3D-QM reveals significant underestimation of CARcs by FC-based methods. a Representative 3D image of a region from the femoral diaphysis showing the typical distribution and morphology of CARcs (left). Annotated image in which all CARc bodies are automatically detected using the Spots module of Imaris software (red spheres). Scale bar, 50 µm. b Representative 3D images of CARcs (green) distribution in longitudinal slices of entire BM cavities (left; scale bar, 1 mm) diaphysis (top) and metaphysis (bottom; scale bars, 200 µm). Colour-coded tissue density maps based on the detection and quantification of CARc presence are shown on the right. c Representative 3D image of a transversal slice of the femoral bone from a Cxcl12-Gfp mouse sectioned at the level of the diaphysis (top; scale bar, 100 µm) and its corresponding tissue density map (bottom) created as in b. CARcs are shown in green. d Density of CARcs in diaphysis (DIA) and metaphysis (MET) expressed as cells per mm3 of BM tissue (n = 14). The tissue volume visualized and quantified for CARc presence was 0.17 ± 0.03 µL/femur. e Determination of absolute BM volume contained in single femoral bones using µ-CT. Raw images of 2D cross-sections are processed to segment BM (red) and bone (grey; left). Scale bar, 2 mm. A 3D rendering of the entire femur is shown here where the extracted total marrow volume is visible (right). f Quantification by µ-CT of BM tissue volumes contained in the femurs from Cxcl12-Gfp mice (n = 13). g Representative FC dot plots and the employed gating strategy for the quantification of CARc frequencies and absolute numbers after enzymatic tissue processing into cell suspensions. h Pairwise comparisons of total CARc numbers as enumerated by 3D-QM and FC. Lines connect dots corresponding to contralateral femurs of the same individual mice (n = 12). For 3D-QM, individual dots correspond to values obtained from calculating the weighted average of two images from different BM regions. Significance was analysed using the Mann–Whitney test ***P < 0.0001; n.s. not significant with P < 0.01. In d, f bars show the mean and dots represent data from single femurs from different mice
Fig. 3
Fig. 3
3D-QM analysis of BM sinusoidal endothelial structures. a Representative images of the BM microvascular compartment of an entire femoral cavity (left; scale bar 1 mm), including arterial (light blue) and sinusoidal vessels (red). Zoomed-in images (right) reveal distinct features of BM sinusoids and arteries in diaphysis (top) and metaphysis of femurs (bottom). Scale bars, 300 µm. b 3D reconstruction of a confocal image stack acquired in a large region of a femoral diaphysis immunostained for the sinusoidal endothelial markers CD105 (white) and Endomucin (Emcn, red). Scale bar, 100 µm. Transitional zone (type H) vessels present mostly at the junction of arterioles and sinusoids in the endosteal regions are strongly positive for Endomucin and weakly express CD105 (marked by arrowheads). c Endomucin signal (white) was used as input for our customized algorithm to reconstruct sinusoids in diaphysis (DIA) and metaphysis (MET) of femoral BM cavities. Scale bar 200 µm. See also Supplementary Fig. 4. d Fraction of entire BM space occupied by intrasinusoidal volumes in femoral diaphysis and metaphysis (n = 11). Bars show the mean and dots represent data from single femurs from different mice. e Left panel depicts a representative high-resolution image of a 2D optical section in which the nuclei of SECs are visible and can be manually annotated. Scale bar, 30 µm. Three zoomed-in pictures with examples of detected SEC nuclei (marked by arrows) are shown. Scale bars, 10 µm. The resulting 3D reconstruction of SEC nuclei (yellow) on the segmented sinusoids (red) is shown on the right panel. Scale bar, 30 µm. f Quantification of SEC nuclei per mm3 of BM tissue volume. Individual dots correspond to values obtained from one single femur by calculating the weighted average of two images from different BM regions (n = 12) and bars depict mean values. g Gating strategy for identification of BMECs and distinction and quantification of AECs and SECs by FC. h Comparison of total SECs per femur as determined by 3D-QM and FC. Lines connect dots corresponding to values determined for contralateral femurs of the same individual mice (n = 11). Significance was analysed using Mann–Whitney test. ***P < 0.0001; n.s. not significant with P < 0.01
Fig. 4
Fig. 4
CARcs assemble as dense pervasive networks associated to ECM fibres. a 3D high-resolution reconstruction of CARc networks present in femoral BM cavities of Cxcl12-Gfp mice. Scale bar, 50 µm. Details of the mesh of CARc cytoplasmic projections connecting the entire network are shown in the zoomed-in image on the right panel. Scale bar, 10 µm. b 3D representative image of BM from Cxcl12-Gfp mice immunostained for ECM marker (collagen IV-Col IV white) and a sinusoidal marker (Endomucin red). Scale bar, 30 µm. High-magnification images of boxed regions are shown on the right panels. Examples of CARc cytoplasmic projections running along ECM fibres (i), prominent ECM deposition around sinusoidal vessel walls (ii) and a CARc body enwrapped in fine ECM bundles (iii) are depicted. Scale bars, 10 µm. c Immunostaining of BM ECM for prototypical markers Laminin and Perlecan showing prominent ECM deposition in arterial walls. Scale bar, 50 µm
Fig. 5
Fig. 5
Spatial coverage of BM spaces by SECs and CARc networks. a Representative examples of BM reconstructions from confocal image stacks (top) employed to automatically segment sinusoids (middle) and CARc bodies (bottom). Scale bar, 100 µm. The 3D ESD depicts in grey scale the distance from every voxel in extravascular spaces to the closest voxel containing either SECs or CARcs. b, c CDF of ESD to the closest (b) sinusoid (n = 6) and (c) CARc soma (n = 6). d High-resolution 3D reconstructions employed to visualize and segment entire CARc networks (cellular bodies and projections) and ECM fibres stained with Collagen IV (Col IV). 3D ESD (grey scale) to segmented CARcs (middle) and ECM (right) networks. Scale bars, 30 µm. e, f Cumulative distribution functions of the ESD to CARcs (n = 7) (e) and ECM (n = 7) (f) networks. g 3D image of a transversal femoral section depicting Sca-1 signal and segmented sinusoids (top). In the bottom panel the arterial Sca-1 signal is segmented and the ESD to arteries is shown in grey scale within the same image. h CDF of the ESD to arteries/arterioles (n = 5 bones in which data from metaphysis and diaphysis are combined). In b, c, e, f, h, the mean accumulated frequencies at each distance are represented by solid lines, with the standard deviations shown as the envelope
Fig. 6
Fig. 6
CARcs accumulate in close physical contact with sinusoidal vessel walls. a Representative 3D image of BM tissues depicting immunostained sinusoidal vessels (red) and GFP+ CARcs (left). Scale bar, 50 µm. Right panels show higher magnification images of perisinusoidal clusters of CARcs (top) and examples of large, non-perivascular CARcs (bottom) Scale bar, 10 µm. b Rotated 3D view of a rendered volume from the segmented image in a, in which CARc subsets are classified and colour coded according to distance to nearest sinusoid. From the quantitative analysis, two populations of perisinusoidal and non-perisinusoidal are evident (non-perisinusoidal > 5 µm distance from CARc surface to closest sinusoidal surface). c Side-by-side comparison of the CDF of the distance to nearest sinusoid evaluated at all positions, as well as evaluated at CARc centroids. Solid lines represent mean distance and envelopes indicate standard deviations. Graphs correspond to the pooled data from a total of 3 different regions per bone and 6 different bones. Statistical significance was analysed using two-sample Kolmogorov–Smirnov and P < 10−42 for all samples
Fig. 7
Fig. 7
Analysis of CARc and sinusoidal vessel networks in ageing. a, b Representative 3D images and quantification of CARc densities in the femoral metaphysis and diaphysis of old (O) mice. Scale bars, 200 µm. c Mean CARc densities in femoral BM of young (Y, 2–3 m/o) and old (O, 20–24m/o) mice. b, c Bars show the mean and dots represent individual values for single femurs from different mice (n = 9 per group). d, e Representative µ-CT images (orthogonal projection corresponding to a 200 µm thickness; scale bar, 1 mm) and quantification of total BM volume of Y and O mice (***P < 0.0001). Bars show the mean and dots represent individual values for single femurs from different mice (n = 12 per group). f Absolute numbers of CARcs in single femurs of Y and O mice. h Confocal image and segmented reconstruction of the Emcn signal in BM of aged mice. Scale bars, 100 µm. i Fraction of BM volume occupied by sinusoids in femurs from Y and O mice. Bars show the mean and dots represent individual values for different femurs (n = 7 per group) (n.s. not significant with P < 0.01). gj CDF of the ESD to CARcs (g) and sinusoidal vessels (j) in aged BM. k High-resolution image of CARc networks, ECM and sinusoidal vessels in femoral BM from one aged mouse. Scale bar, 20 µm. l CDF of the distance to nearest sinusoid evaluated at all positions (red), as well as evaluated at CARc centroids (green) in BM from old mice. Solid lines represent mean distance and envelopes indicate standard deviations. Statistical significance was analysed using two-sample Kolmogorov–Smirnov and P < 10−21 for all samples. Data in g, j, l correspond to images of large BM regions of metaphysis and diaphysis of femoral bones from seven different mice

References

    1. Nombela-Arrieta C, Manz MG. Quantification and three-dimensional microanatomical organization of the bone marrow. Blood Adv. 2017;1:407–416. doi: 10.1182/bloodadvances.2016003194. - DOI - PMC - PubMed
    1. Kondo M, et al. Biology of hematopoietic stem cells and progenitors: implications for clinical application. Annu. Rev. Immunol. 2003;21:759–806. doi: 10.1146/annurev.immunol.21.120601.141007. - DOI - PubMed
    1. Takizawa H, Boettcher S, Manz MG. Demand-adapted regulation of early hematopoiesis in infection and inflammation. Blood. 2012;119:2991–3002. doi: 10.1182/blood-2011-12-380113. - DOI - PubMed
    1. Lee Y, Decker M, Lee H, Ding L. Extrinsic regulation of hematopoietic stem cells in development, homeostasis and diseases. Wiley Interdiscip Rev. Dev. Biol. 2017;6:e279–23. doi: 10.1002/wdev.279. - DOI - PMC - PubMed
    1. Morrison SJ, Scadden DT. The bone marrow niche for haematopoietic stem cells. Nature. 2014;505:327–334. doi: 10.1038/nature12984. - DOI - PMC - PubMed

Publication types

MeSH terms