. 2018 Jun 28;9(1):2529.
doi: 10.1038/s41467-018-04839-9.

Go/No-Go task engagement enhances population representation of target stimuli in primary auditory cortex

Affiliations

Go/No-Go task engagement enhances population representation of target stimuli in primary auditory cortex

Sophie Bagur et al. Nat Commun. .

Abstract

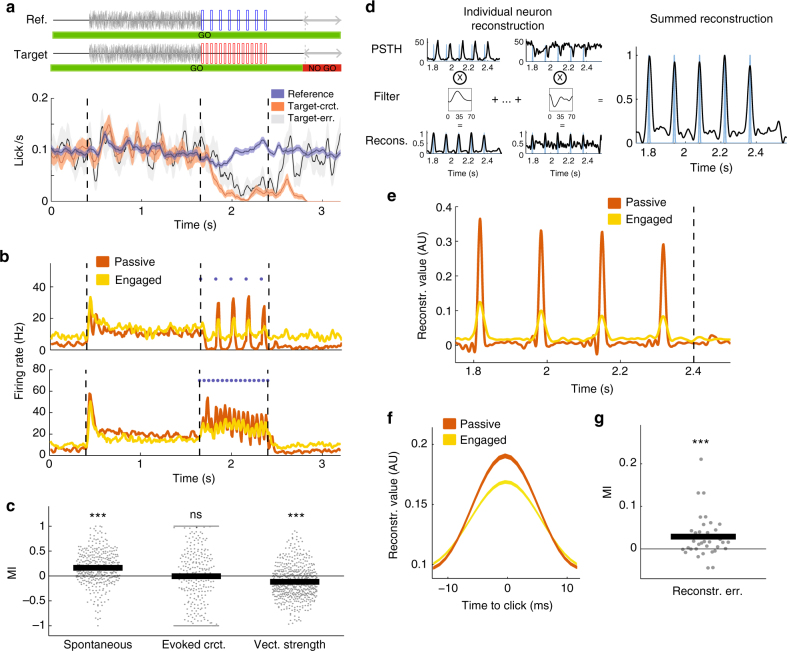
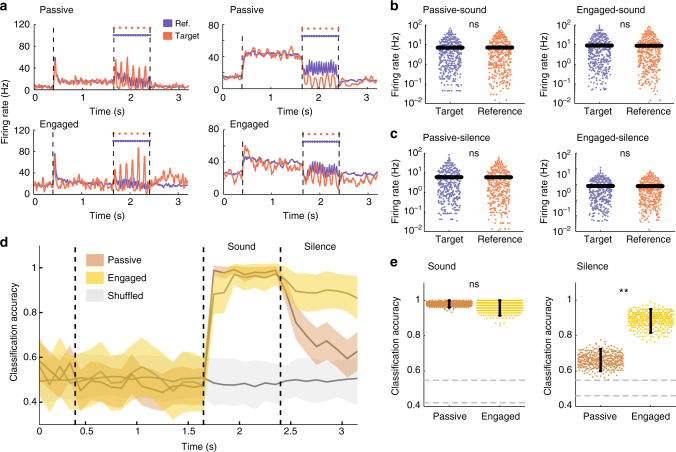
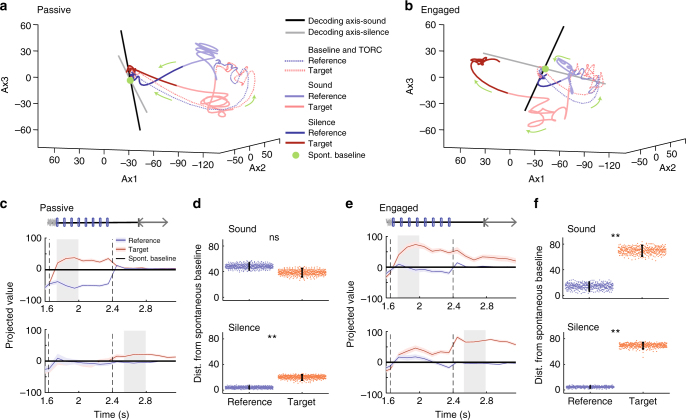
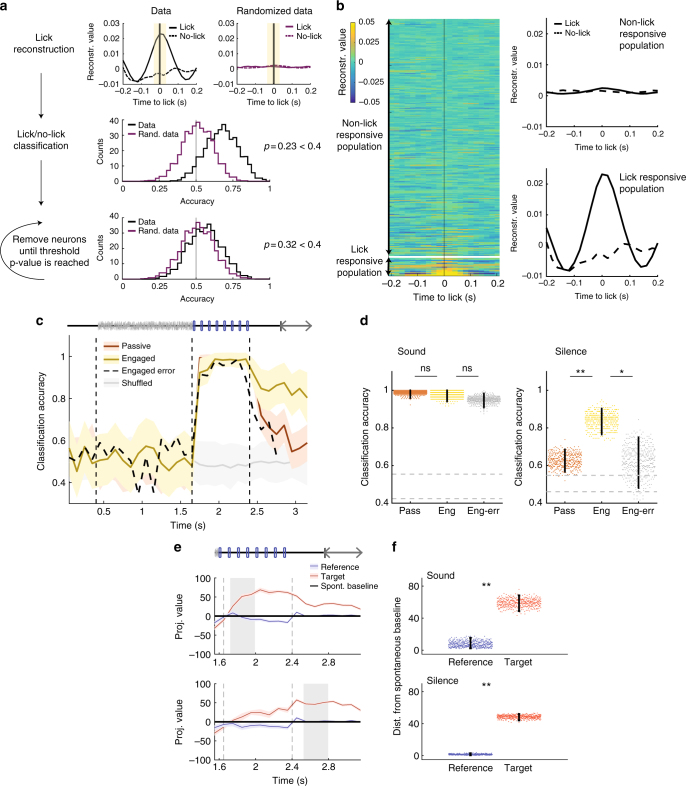
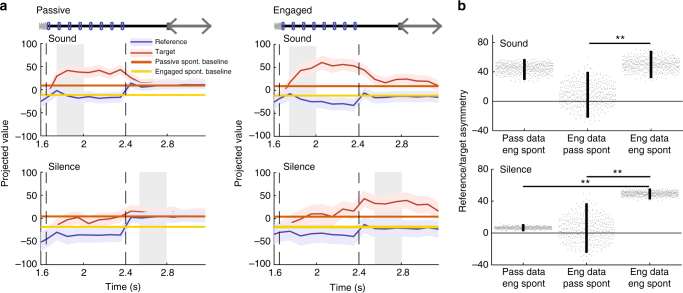
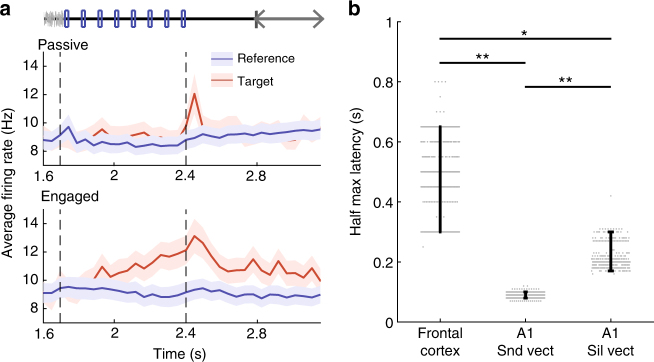
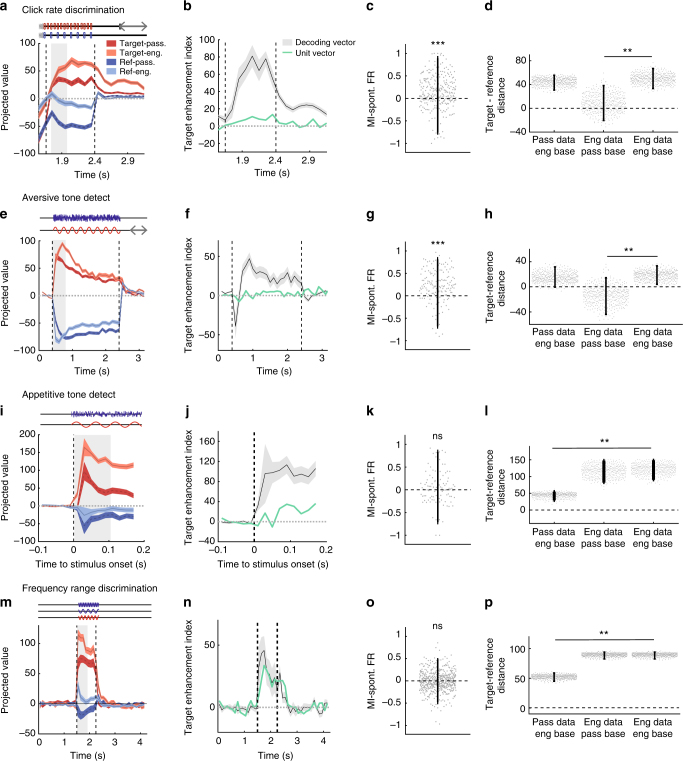
Primary sensory cortices are classically considered to extract and represent stimulus features, while association and higher-order areas are thought to carry information about stimulus meaning. Here we show that this information can in fact be found in the neuronal population code of the primary auditory cortex (A1). A1 activity was recorded in awake ferrets while they either passively listened or actively discriminated stimuli in a range of Go/No-Go paradigms, with different sounds and reinforcements. Population-level dimensionality reduction techniques reveal that task engagement induces a shift in stimulus encoding from a sensory to a behaviorally driven representation that specifically enhances the target stimulus in all paradigms. This shift partly relies on task-engagement-induced changes in spontaneous activity. Altogether, we show that A1 population activity bears strong similarities to frontal cortex responses. These findings indicate that primary sensory cortices implement a crucial change in the structure of population activity to extract task-relevant information during behavior.


Conflict of interest statement

The authors declare no competing interests.

Figures

Fig. 1
Fig. 1
Task structure and neural encoding of click times in A1. a Structure of the click-train discrimination task and average behavior of the two animals. Each sound sequence is composed of 0.4 s silence then a 1.25 s long white noise burst followed by a 0.8 s click train and a 0.8 s silence. On each block, the ferret is presented with a random number (1–7) of reference stimuli (top) followed by a target stimulus (bottom), except on catch trials with no target presentations. On blocks including a target, the animal had to refrain from licking during the final 0.4 s of the trial, the no-go period, to avoid a mild tail shock (error bars are +/− SEM). b PSTH of two example units during reference sequences in the passive and engaged state. Note that, in the task-engaged state, the units show enhanced firing during the initial silent period of spontaneous activity and reduced phase locking to the stimulus. c Modulation index of each unit for spontaneous firing rate, spontaneous-corrected click-evoked firing rate, and vector strength showing higher spontaneous firing rates and lower vector strength in the task-engaged state. The vector strength was only calculated for units firing above 1 Hz and values for both reference and target are shown. SEM error bars are not shown because not visible at this scale: 0.017, 0.037, and 0.013, respectively (one-sample two-sided Wilcoxon signed-rank test with mean 0, n = 370, 574, 370, zval = −8.99, p = 2.57e-19; zval = −0.07, p = 0.94; zval = −8.82, p = 1.16e-18; ***p < 0.001). d Schematic of stimulus reconstruction algorithm. Using PSTHs from half of the trials, a time-lagged filter is fitted to allow optimal reconstruction of the stimulus for each individual unit. Individual reconstructions are summed to obtain a population reconstruction (far right). e Stimulus reconstruction from an example session showing degraded reconstruction in the task-engaged state. f Mean click reconstruction in passive and engaged states. g Modulation index of each session for stimulus reconstruction error. SEM error bar is not shown because it is not visible at this scale: 0.0014 (one-sample two-sided Wilcoxon signed-rank test with mean 0, n = 36; zval = −3.4092, p = 6.51e-4; ***p < 0.001)
Fig. 2
Fig. 2
Discrimination of target and reference stimuli based on A1 activity. a PSTHs of two example units during reference (blue) and target (red) trials in the passive (top) and task-engaged (bottom) state. The unit on the left is target-preferring and the unit on the right is reference-preferring. b, c Comparison of average firing rates on a log scale in passive (left) and engaged (right) between target and reference stimuli during the sound (b) and during the post-stimulus silence (c) periods. SEM error bars are not shown because it is not visible at this scale. (two-sided Wilcoxon signed rank, n = 370; zval = 0.34, p = 0.73; zval = 0.35, p = 0.79; zval = −0.47, p = 0.64; zval = −0.35, p = 0.73) (d) Accuracy of stimulus classification in passive and engaged states. In gray, chance-level performance evaluated on label-shuffled trials. Error bars represent 1 std calculated over 400 cross-validations. e Mean classifier accuracy during the sound (left) and silence period (right) in both conditions. Gray dotted lines give 95% confidence interval of shuffled trials. Error bars represent 95% confidence intervals. (n = 400 cross-validations; p = 0.29 and p < 0.0025; **p < 0.01)
Fig. 3
Fig. 3
Task engagement induces shift from symmetric to asymmetric representation of target and reference stimuli. a Population response during target and reference stimuli in the passive state along the first three components identified using GPFA (see Methods) on single trial data. The session begins at the baseline (green dot), followed by the TORC presentation, (dotted line) then the click presentation of either the target and the reference sound (light red and blue, respectively) and finally the post-sound silence period (dark red and blue). Note in particular that, in the passive state, the reference and target activities move away symmetrically from the baseline point given by projection of spontaneous activity. b As in a, for the task-engaged state. Note that, in this state, target activity makes a much larger excursion from the baseline than reference activity. The axes are the same as in a, as the GPFA analysis was performed jointly on passive and engaged data. c Projection onto the decoding axis of trial-averaged reference- and target-evoked responses for the whole neural population. A baseline value computed from prestimulus spontaneous activity was subtracted for each unit, so that the origin corresponds to the projection of spontaneous activity (shown by black line). Decoding axes determined during sound presentation and post-stimulus silence are, respectively, used for projections in the top and bottom rows. The periods used to construct the decoding axis are shaded in gray. Error bars represent 1 std calculated using decoding vectors from cross-validation. This procedure allows for the visualization of the distance between reference- and target-evoked projections (that corresponds to decoding strength) and the distance of the stimuli-evoked responses from the baseline of spontaneous activity can be interpreted as the contribution of each stimulus to decoding accuracy. d Distance of reference and target projections from baseline in each condition during the sound and silence period. Error bars represent 95% confidence intervals (n = 400 cross-validations; p = 0.15 and p < 0.0025; **p< 0.01). e As in c for the engaged state. f As in d for the engaged state. (n = 400 cross-validations; p < 0.0025 and p < 0.0025; **p < 0.01)
Fig. 4
Fig. 4
Relation between A1, motor activity, and behavioral outcome a Schematic of the approach used to identify lick-responsive units. First, we reconstructed licks using optimal filters as for click reconstruction (Fig. 1). The filter is applied during licks and also during randomly selected time points with no licks (top left). We evaluated the accuracy of classifying lick and no-lick time events using a linear decoder (black distribution, middle panel). In both cases, the significance was tested using randomized data (top right and purple distribution, middle panel). We iteratively removed the best classification units (bottom plot) until the p value was >0.4 and the two distributions were indistinguishable. b Results of reconstruction of lick events and removal of lick units. Left: heatmap of average lick reconstruction for all neurons ordered by classification weight. Right: average reconstruction of lick and no-lick events using units retained for population analysis (non-lick responsive) and units excluded from the population analysis (lick responsive). c Accuracy of stimulus classification in passive and engaged states using only non-lick-responsive units. Note that, after removal of lick-responsive units, the discrimination during post-stimulus silence is still enhanced in the task-engaged state on correct trials but is low during error trials. Error bars represent 1 std calculated over 400 cross-validations. d Comparison of mean accuracy on passive, task-engaged correct and task-engaged error trials, during sound (left) and post-stimulus silence periods (right). Error bars represent 95% confidence intervals. (n = 400 cross-validations; sound: pass/eng p = 0.22, eng/err: p = 0.87; silence: pass/eng p < 0.0025, eng/err: p = 0.012; *p < 0.05, **p < 0.01) e Projection onto the decoding axis of baseline-subtracted population vectors during the engaged condition constructed using activity of non-lick-responsive units only for the reference and target stimuli. Projections are shown onto the decoding axes obtained on early sound (top) and silence periods (bottom) (shaded epochs). The origin corresponds to the projection of spontaneous activity (shown by black line). Error bars represent 1 std (cross-validation n = 400). f Distance of reference and target projections from baseline in the engaged condition during sound and silence periods. Error bars represent 95% confidence intervals (n = 400 cross-validations; p < 0.0025 and p < 0.0025; **p < 0.01)
Fig. 5
Fig. 5
Shift in spontaneous activity contributes to change in asymmetry. a Projection onto the engaged decoding axis of reference- and target-evoked activity in the passive (left column) and engaged state (right column). Decoding axes determined during sound presentation and post-stimulus silence are, respectively, used for projections in the top and bottom rows. This figure differs from Fig. 3c in which the spontaneous activity is subtracted before projection, so 0 corresponds to the null space of the projection. Passive and engaged spontaneous activities after projection are shown by continuous lines. Error bars represent 1 std calculated using decoding vectors from cross-validation (n = 400). b Comparison of reference/target asymmetry for evoked responses in different states compared to different baselines given by passive or engaged spontaneous activity. Reference/target asymmetry is the difference of the distance of reference and target projected data to a given baseline. We examine three cases: (i) passive evoked responses, distances calculated relative to engaged spontaneous activity; (ii) engaged evoked responses, distances calculated relative to passive spontaneous activity; (iii) engaged evoked responses, distances calculated relative to engaged spontaneous activity. These values are shown during the sound (top) and the silence (bottom). In all three cases, the engaged decoding axis was used for projections. Decoding axes determined during sound presentation and post-stimulus silence are, respectively, used for projections in the top and bottom rows Note that all analysis in this figure is done after excluding lick-responsive units in A1 as described in Fig. 4. Error bars represent 95% confidence intervals (n = 400 cross-validations; sound: p(col1,col3) = 0.29 and p(col2,col3) < 0.0025; silence: p(col1,col3) < 0.0025 and p(col2,col3) < 0.0025; **p < 0.01)
Fig. 6
Fig. 6
Persistent, asymmetric response to target and reference stimuli in frontal cortex a Average PSTHs of all frontal cortex units in response to target and reference stimuli in both passive and engaged conditions. Note that the response to the target in the task-engaged state is very clear and appears late during the sound. Error bars: SEM over all units (n = 102). b Latency to half-maximum response for frontal cortex (for average PSTHs) and primary auditory cortex (for projected target-elicited data) in the task-engaged state. For the auditory cortex, data is projected either on the sound decoding vector or the silence decoding vector. Error bars represent 95% confidence intervals. (400 cross-validations. p ≤ 0.0025, p ≤ 0.0025 and p = 0.011; **p < 0.01; *p < 0.05). Note that all analysis in this figure is done after excluding lick-responsive units in A1 as described in Fig. 4
Fig. 7
Fig. 7
Enhanced representation of target stimuli in a range of auditory Go/No-Go tasks. Each line of four panels represent the same analysis for all four tasks; statistics are given in order of appearance in the figure. a, e, i, m Projection onto the decoding axis determined during the sound period of trial-averaged reference (blue) and target (ref) activity during the passive (dark colors) and the engaged (light colors) sessions. A baseline value computed from spontaneous activity was subtracted for each neuron, so that the origin corresponds to the projection of spontaneous activity (shown by black line). Note that the target-driven activity is further from the baseline in the engaged state and the reference-driven activity is closer. The periods used to construct the decoding axis are shaded in gray. Error bars represent 1 std (cross-validation n = 400). b, f, j, n Index of target enhancement induced by task engagement based on projections using the decoding axis determined during the sound. In green, same index computed instead by giving the same weight to all units. The difference between the green and black curved indicates that the change in asymmetry induced by task engagement cannot be detected using the population averaged firing rate alone. Error bars represent 1 std (cross-validation n = 400). c, g, k, o Modulation index of each unit for spontaneous firing rate after exclusion of lick-related units. Error bars are 95% CI (one-sample two-sided Wilcoxon signed-rank test with mean 0, n = 277, zval = 6.35, p = 2.1e-10; n = 161, zval = 7.22, p = 5.4e-13; n = 99, zval = 1.01, p = 0.30; n = 520, zval = −0.78, p = 0.47; ***p < 0.001). d, h, l, p Comparison of reference/target asymmetry for evoked responses in different states relative to different baselines given by passive or engaged spontaneous activity. Reference/target asymmetry is the difference of the distance of target and reference projected data to a given baseline. We examine three cases: (i) passive evoked responses, distances calculated relative to engaged spontaneous activity; (ii) engaged evoked responses, distances calculated relative to passive spontaneous activity; (iii) engaged evoked responses, distances calculated relative to engaged spontaneous activity. In all three cases, the engaged decoding axis was used for projections. Error bars represent 95% confidence intervals (n = 400 cross-validations; p(col1,col3) = 0.29 and p(col2,col3) < 0.0025; p(col1,col3) = 0.38 and p(col2,col3) < 0.0025; p(col1,col3) < 0.0025 and p(col2,col3) = 0.16; p(col1,col3) < 0.0025 and p(col2,col3) = 0.92; **p < 0.01)

References

    1. Chechik G, et al. Reduction of information redundancy in the ascending auditory pathway. Neuron. 2006;51:359–368. doi: 10.1016/j.neuron.2006.06.030. - DOI - PubMed
    1. Chechik G, Nelken I. Auditory abstraction from spectro-temporal features to coding auditory entities. Proc. Natl Acad. Sci. USA. 2012;109:18968–18973. doi: 10.1073/pnas.1111242109. - DOI - PMC - PubMed
    1. de Lafuente V, Romo R. Neural correlate of subjective sensory experience gradually builds up across cortical areas. Proc. Natl Acad. Sci. USA. 2006;103:14266–14271. doi: 10.1073/pnas.0605826103. - DOI - PMC - PubMed
    1. Siegel M, Buschman TJ, Miller EK. Brain processing. Cortical information flow during flexible sensorimotor decisions. Sci. (80-.). 2015;348:1352–1355. doi: 10.1126/science.aab0551. - DOI - PMC - PubMed
    1. Vergara J, Rivera N, Rossi-Pool R, Romo R. A neural parametric code for storing information of more than one sensory modality in working memory. Neuron. 2016;89:54–62. doi: 10.1016/j.neuron.2015.11.026. - DOI - PubMed

MeSH terms

LinkOut - more resources