. 2018 Jun 28;9(1):2517.
doi: 10.1038/s41467-018-04893-3.

Single-cell transcriptomics reveal the dynamic of haematopoietic stem cell production in the aorta

Affiliations

Single-cell transcriptomics reveal the dynamic of haematopoietic stem cell production in the aorta

Chloé S Baron et al. Nat Commun. .

Abstract

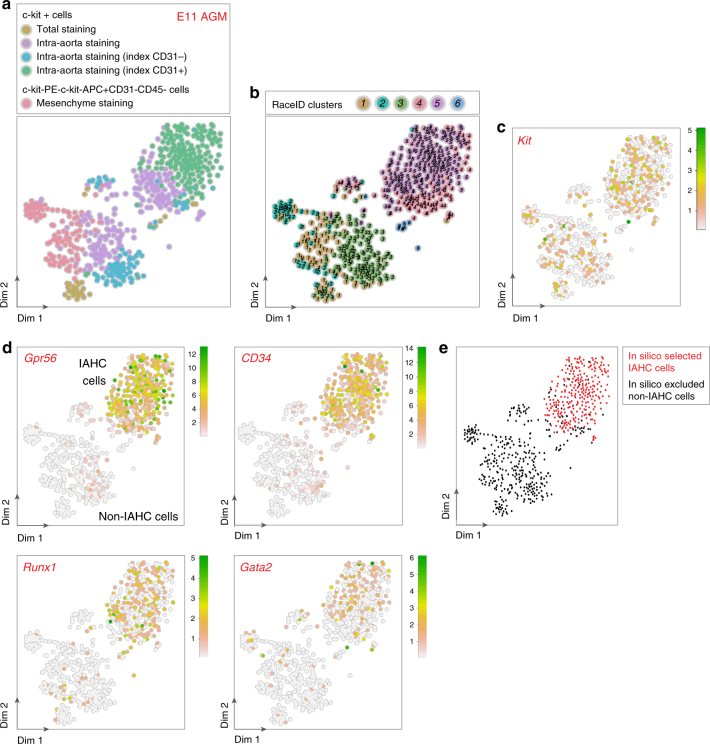
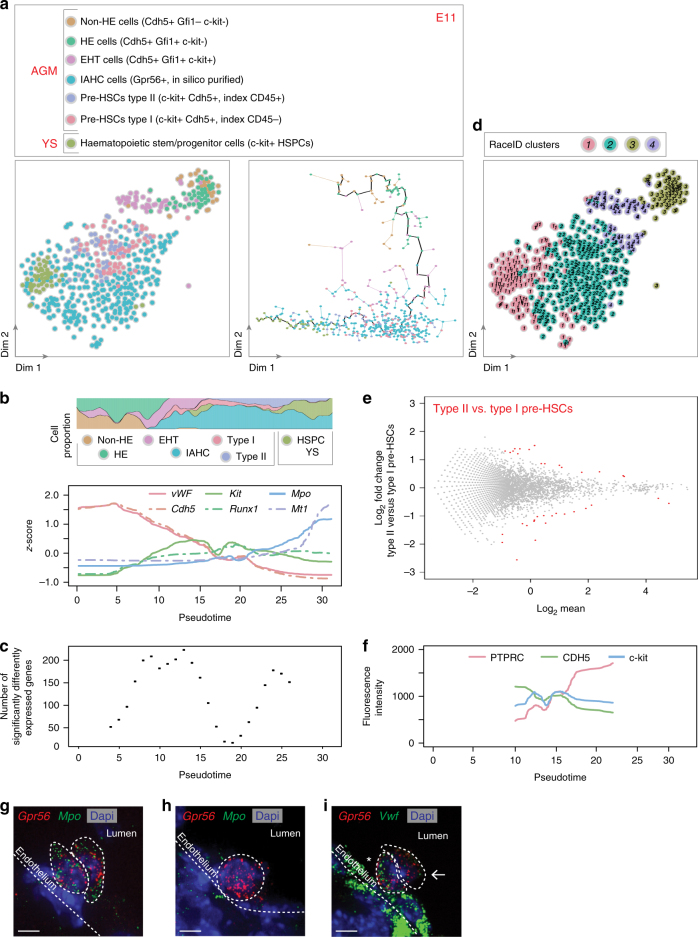
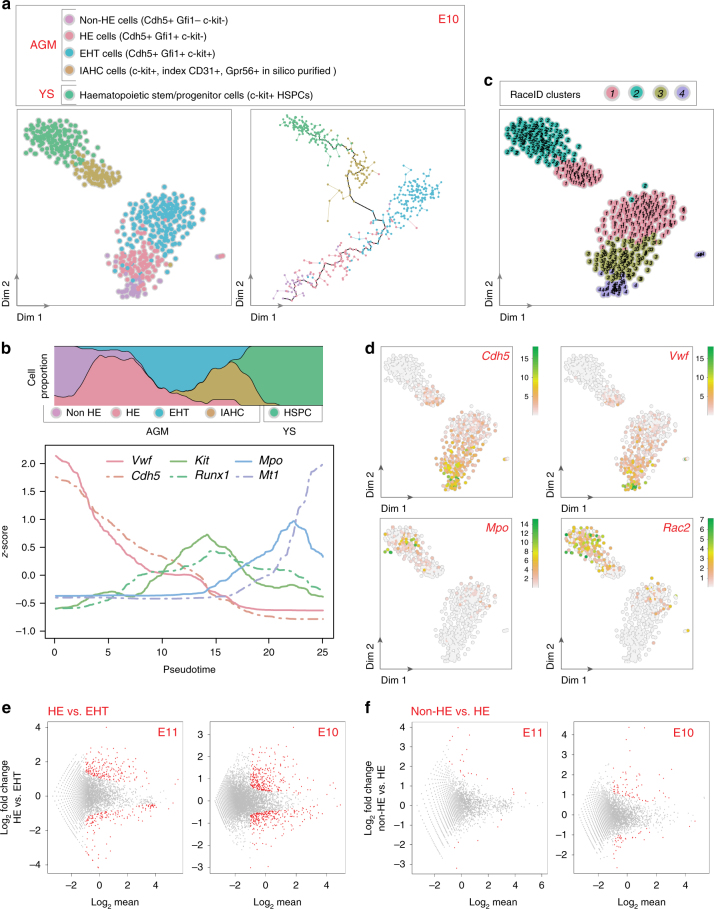
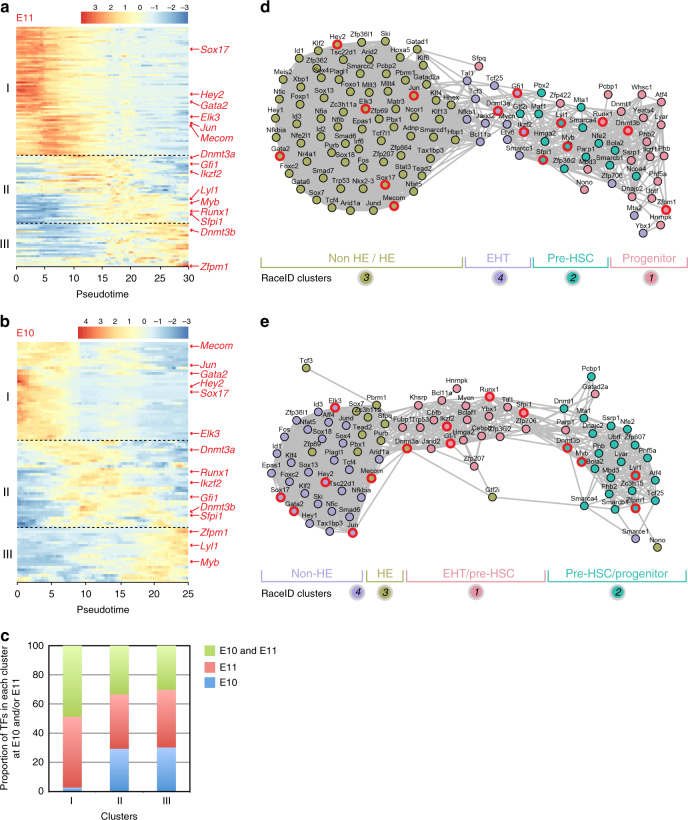
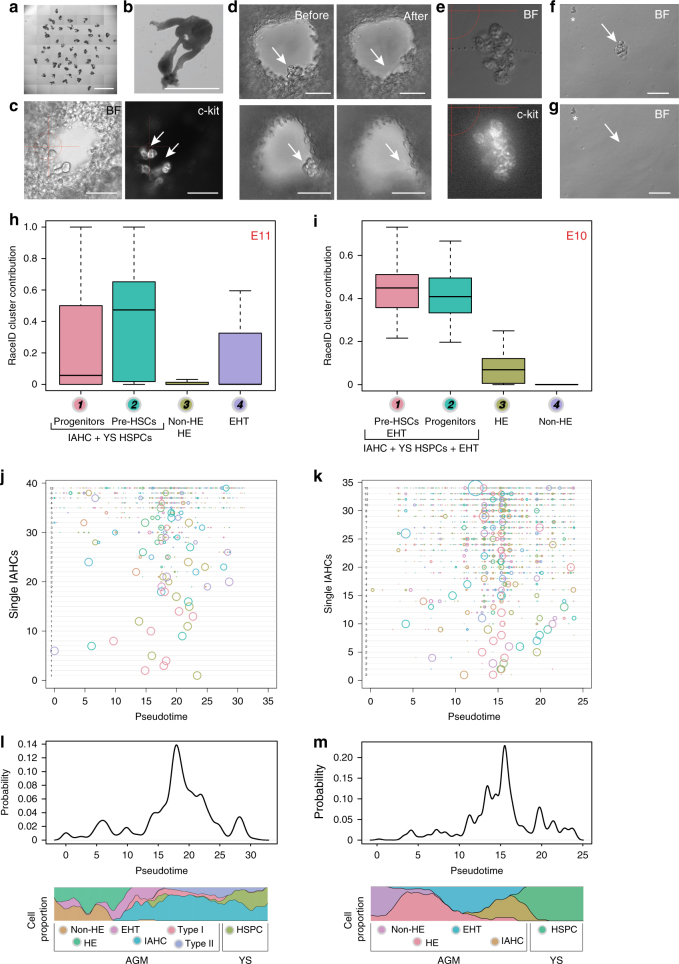
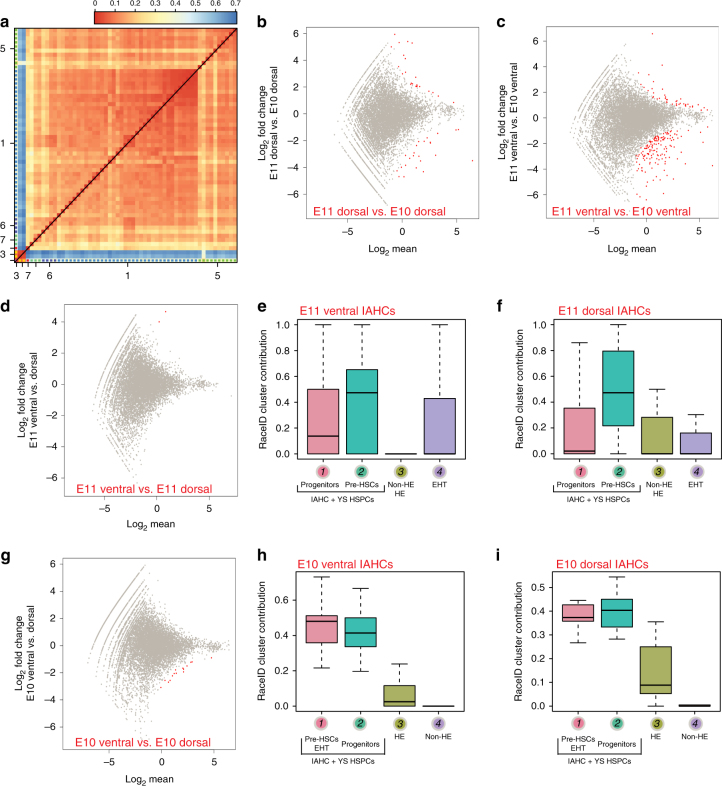
Haematopoietic stem cells (HSCs) are generated from haemogenic endothelial (HE) cells via the formation of intra-aortic haematopoietic clusters (IAHCs) in vertebrate embryos. The molecular events controlling endothelial specification, endothelial-to-haematopoietic transition (EHT) and IAHC formation, as it occurs in vivo inside the aorta, are still poorly understood. To gain insight in these processes, we performed single-cell RNA-sequencing of non-HE cells, HE cells, cells undergoing EHT, IAHC cells, and whole IAHCs isolated from mouse embryo aortas. Our analysis identified the genes and transcription factor networks activated during the endothelial-to-haematopoietic switch and IAHC cell maturation toward an HSC fate. Our study provides an unprecedented complete resource to study in depth HSC generation in vivo. It will pave the way for improving HSC production in vitro to address the growing need for tailor-made HSCs to treat patients with blood-related disorders.


Conflict of interest statement

The authors declare no competing interests.

Figures

Fig. 1
Fig. 1
scRNA-Seq allows in silico purification of IAHC cells from E11 AGM. ad t-SNE maps displaying as colored dots 542 single cells isolated from the aorta–gonad–mesonephros (AGMs) region of E11 embryos. a t-SNE map displaying 37 c-kit+ cells sorted after total staining (brown dots), 215 c-kit+ cells sorted after intra-aorta staining (purple dots), c-kit+ cells sorted with CD31 fluorescence intensity index after intra-aorta staining (92 c-kit+CD31 cells, blue dots; 198 c-kit+CD31+ cells, green dots), and 114 c-kitPEc-kitAPC+CD31CD45 cells (pink dots). b t-SNE map displaying single cells from a in clusters identified after RaceID analysis. Different numbers and colors highlight the different RaceID clusters. c, d Expression of (c) Kit and (d) Gpr56, CD34, Runx1, and Gata2 marker genes projected on t-SNE maps. Color bars, number of transcripts. Dim dimension. e t-SNE map displaying in silico selected IAHC cells (in red) and excluded non-IAHC cells (in black)
Fig. 2
Fig. 2
Pre-HSCs and progenitors are discernible by opposing gradients of endothelial and haematopoietic transcripts in E11 IAHCs. a t-SNE map of 554 single cells isolated from E11 embryo AGM and yolk sac (YS). a (left panel) t-SNE map displaying 27 sorted non-haemogenic endothelial cells (non-HE cells, Cdh5+Gfi1c-kit-, brown dots), 45 haemogenic endothelial cells (HE cells, Cdh5+Gfi1+c-kit, green dots), 43 cells undergoing endothelial-to-haematopoietic transition (EHT cells, Cdh5+Gfi1+c-kit+, purple dots), 282 IAHC cells (turquoise dots; c-kit+ cells in silico purified based on Gpr56 expression from Fig. 1a), and HSC precursors (58 pre-HSCs type I [c-kit+Cdh5+, index CD45, pink dots] and 55 type II [c-kit+Cdh5+, index CD45+, violet dots]) from AGMs. 44 c-kit+ cells were also sorted from YS (haematopoietic stem and progenitor cells, HSPCs, khaki dots). a (right panel) Pseudotime analysis by Monocle algorithm of the cells shown in a (left panel) (same color code). b Top panel, proportion of each cell type shown in a along pseudotime; Bottom panel, endothelial and haematopoietic marker gene expression along pseudotime (vWF [von Willebrand factor], Cdh5 [VE-cadherin], Kit, Runx1, Mpo [Myeloperoxydase], Mt1 [Metallothionein 1]). c Number of significantly differentially expressed genes along pseudotime. d t-SNE plot displaying the single cells shown in a in clusters identified by RaceID analysis. e DE-Seq analysis showing the differential gene expression between type I and type II pre-HSCs (36 genes were significantly differentially expressed, red dots). f Fluorescence intensity of markers used to sort pre-HSCs along pseudotime (PTPRC [CD45], CDH5, c-kit). gi E11 embryo cryosections hybridized with smFISH probes against Gpr56 (red dots) (gi) and Mpo (green dots) (g, h) or Vwf (green dots) (i). IAHC cells (Gpr56+) expressing high (asterisk) or low/no levels (arrow) of Vwf in (i). Dash lines delimitate the position of the aortic endothelium and IAHC cells. Dapi marks the nuclei (blue)
Fig. 3
Fig. 3
Non-HE and HE cells have different transcriptome at E10. a t-SNE map displaying 464 single cells isolated from E10 embryo AGM. a (left panel) t-SNE map displayed 39 sorted non-hemogenic endothelial (HE) cells (purple dots), 96 HE cells (pink dots), 116 EHT cells (blue dots), and 73 IAHC cells (in silico purified on Gpr56 expression; brown dots) from E10 AGM, and 140 HSPCs from E10 YS (green dots). a (right panel) Pseudotime analysis by Monocle algorithm of the sorted cells shown in a (left panel) (same color code). b Top panel, proportion of each cell type shown in a along pseudotime; Bottom panel, endothelial and haematopoietic marker gene expression along pseudotime (Vwf, Cdh5, Kit, Runx1, Mpo, Mt1). c t-SNE plot displaying single cells from a in clusters identified by RaceID analysis. Different numbers and colors highlight different RaceID clusters. d Expression of Cdh5, Vwf, Mpo, and Rac2 marker genes projected on t-SNE maps. Color bars, number of transcripts. Dim dimension. e DE-Seq analysis showing the differential gene expression between HE and EHT cells at E11 (e, left panel, 370 genes significantly differentially expressed, red dots) and E10 (e, right panel, 572 genes). f DE-Seq analysis showing the differential gene expression between non-HE and HE cells at E11 (f, left panel, 30 genes) and E10 (f, right panel, 109 genes). Non-significantly differentially expressed genes, gray dots
Fig. 4
Fig. 4
Transcription factor networks involved during IAHC formation at E11 and E10. a, b Heatmap of differentially expressed transcription factors (TFs) at a E11 and b E10 between the different cell types (non-HE, HE, EHT, IAHC cells, and YS HSPCs), according to pseudotime. Three distinct expression patterns are identified as clusters I, II, and III. c Proportion of transcription factors that are present in clusters I, II, or III at both E10 and E11, only at E11 or only at E10. d, e Network of TFs related to different expression patterns as determined in a and b, respectively. Color-coded circles are related to RaceID analysis shown in Figs. 2d and 3c, respectively. TFs mentioned in the results section are outlined in red
Fig. 5
Fig. 5
Transcriptome comparison of pure whole IAHCs mechanically picked-up inside the aorta. a E10 embryo slices embedded in agarose. Scale bar, 5 mm. b Close-up showing an embryo slice. Scale bar, 1 mm. c Close-up showing c-kit+ IAHCs attached to the aortic endothelium of an E10 embryo slice (left panel, bright filter (BF); right panel, c-kit fluorescence). Scale bar, 50 μm. d Two examples (upper and lower panels) of single IAHCs mechanical pick-up. Before pick-up, IAHCs were attached to the ventral side of the aorta (left panel, arrow). After pick-up, IAHCs were no longer visible in the aorta (right panel, arrow). e Example of a single mechanically picked-up IAHC (whole IAHC or wIAHC). Upper panel, BF; lower panel, c-kit fluorescence. f Presence of a wIAHC (arrow) and contaminating single cells (asterisk) after wIAHC first pick-up. g The wIAHC was picked-up a second time to eliminate the contaminating cells that remained in the medium drop (asterisk). h, i Box plots showing the RaceID cluster contribution to E11 (h) and E10 (i) wIAHCs. Color-coded boxes are related to RaceID analysis shown in Fig. 2d and Fig. 3c, respectively. j, k Probability for each cell to contribute to single wIAHCs at E11 (j) and E10 (k). Each horizontal line depicts a single wIAHC. The size of the circle is proportional to the probability for the cell at that position in pseudotime to contribute to that particular wIAHC. The number (next to the y-axis, inside the graph) depicts the total number of cells present in that particular wIAHC. l, m Probability density along pseudotime for contributing to wIAHCs
Fig. 6
Fig. 6
Ventral and dorsal wIAHCs have a similar transcriptome at E10 and E11. a Heatmap representing the transcriptome similarities measured by the Euclidean distance of the transcriptome correlation matrix for single E10 and E11 wIAHCs. Cluster numbers are shown along the axis for the major clusters. bd, g DE-Seq analysis showing the differential gene expression between E11 and E10 dorsal wIAHCs (51 genes significantly differentially expressed as shown by red dots) (b), between E11 and E10 ventral wIAHCs (199 genes) (c), between E11 ventral and dorsal wIAHCs (2 genes) (d), and between E10 ventral and dorsal wIAHCs (16 genes) (g). e, f Box plots of the RaceID cluster contribution to E11 ventral (e) and dorsal (f) wIAHCs. Color-coded boxes are related to RaceID analysis shown in Fig. 2d. h, i Box plots of the RaceID cluster contribution to E10 ventral (h) and dorsal (i) wIAHCs. Color-coded boxes are related to RaceID analysis shown in Fig. 3c

References

    1. Sandler VM, et al. Reprogramming human endothelial cells to haematopoietic cells requires vascular induction. Nature. 2014;511:312–318. doi: 10.1038/nature13547. - DOI - PMC - PubMed
    1. Lis R, et al. Conversion of adult endothelium to immunocompetent haematopoietic stem cells. Nature. 2017;545:439–445. doi: 10.1038/nature22326. - DOI - PMC - PubMed
    1. Sugimura R, et al. Haematopoietic stem and progenitor cells from human pluripotent stem cells. Nature. 2017;545:432–438. doi: 10.1038/nature22370. - DOI - PMC - PubMed
    1. Pearson S, Cuvertino S, Fleury M, Lacaud G, Kouskoff V. In vivo repopulating activity emerges at the onset of hematopoietic specification during embryonic stem cell differentiation. Stem Cell Rep. 2015;4:431–444. doi: 10.1016/j.stemcr.2015.01.003. - DOI - PMC - PubMed
    1. Medvinsky A, Dzierzak E. Definitive hematopoiesis is autonomously initiated by the AGM region. Cell. 1996;86:897–906. doi: 10.1016/S0092-8674(00)80165-8. - DOI - PubMed

Publication types

MeSH terms