. 2019 May;26(5):796-811.
doi: 10.1038/s41418-018-0152-1. Epub 2018 Jun 28.

FHL3 links cell growth and self-renewal by modulating SOX4 in glioma

Affiliations

FHL3 links cell growth and self-renewal by modulating SOX4 in glioma

Wei Han et al. Cell Death Differ. 2019 May.

Abstract

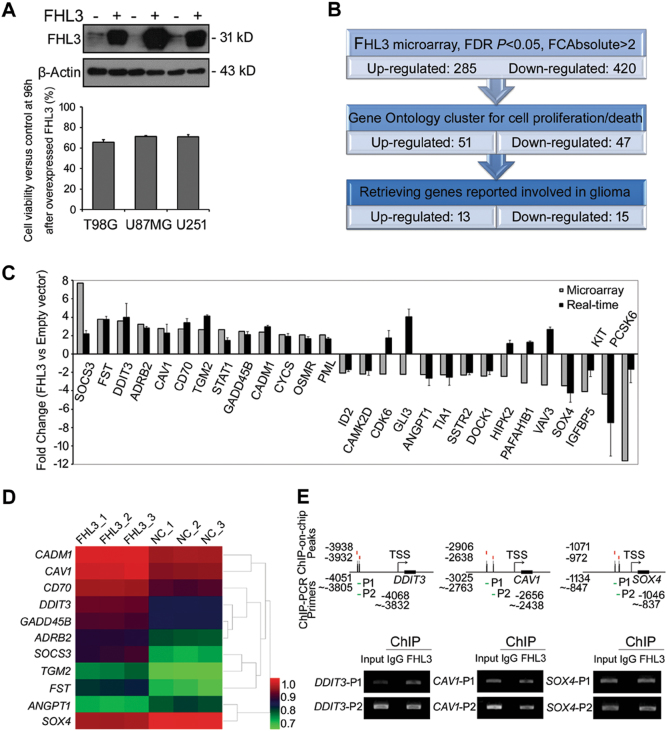
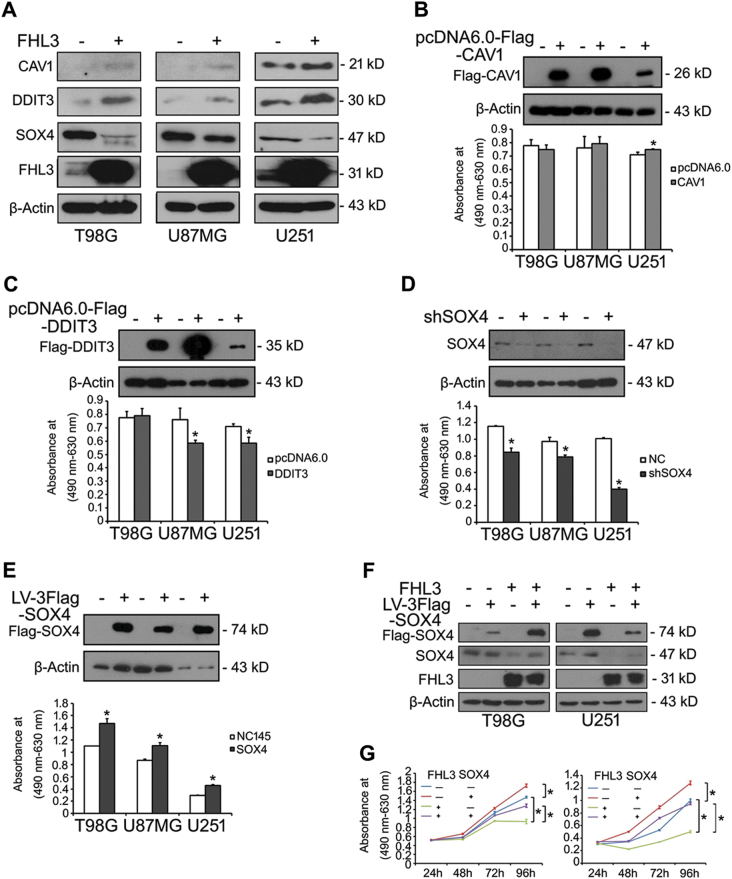
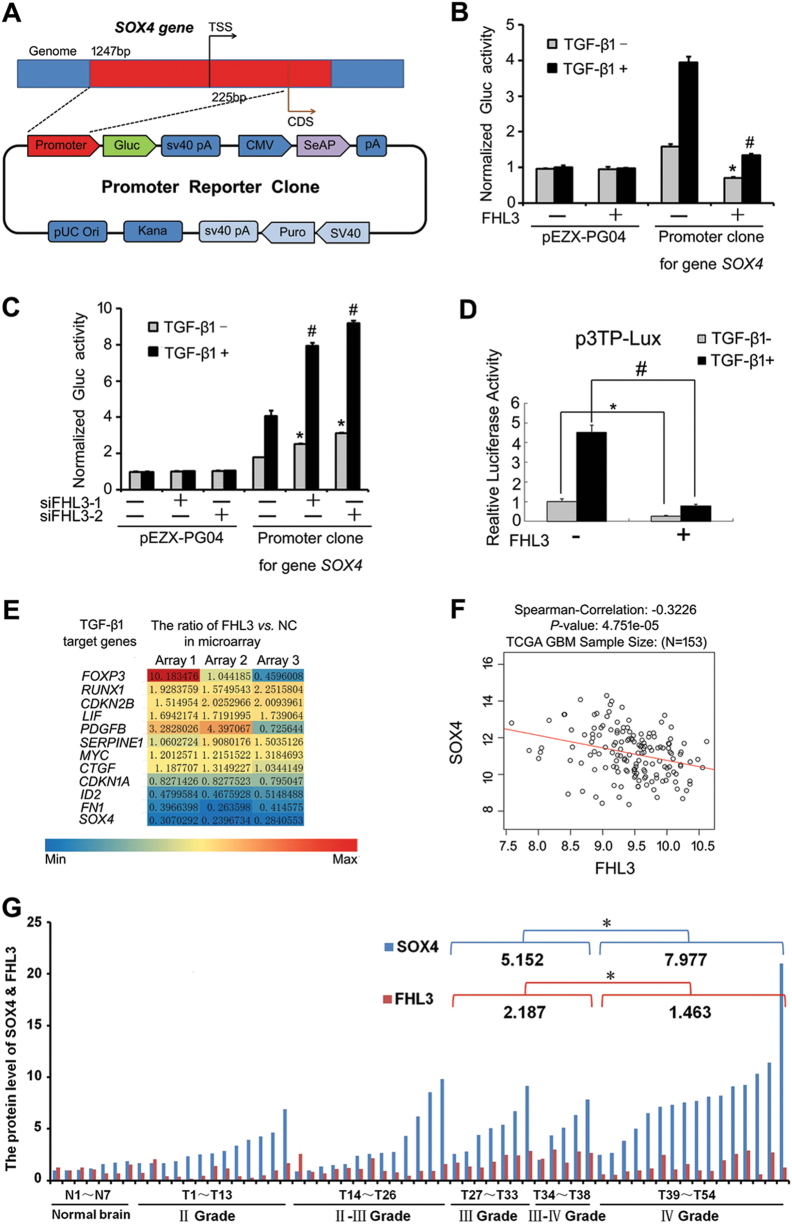
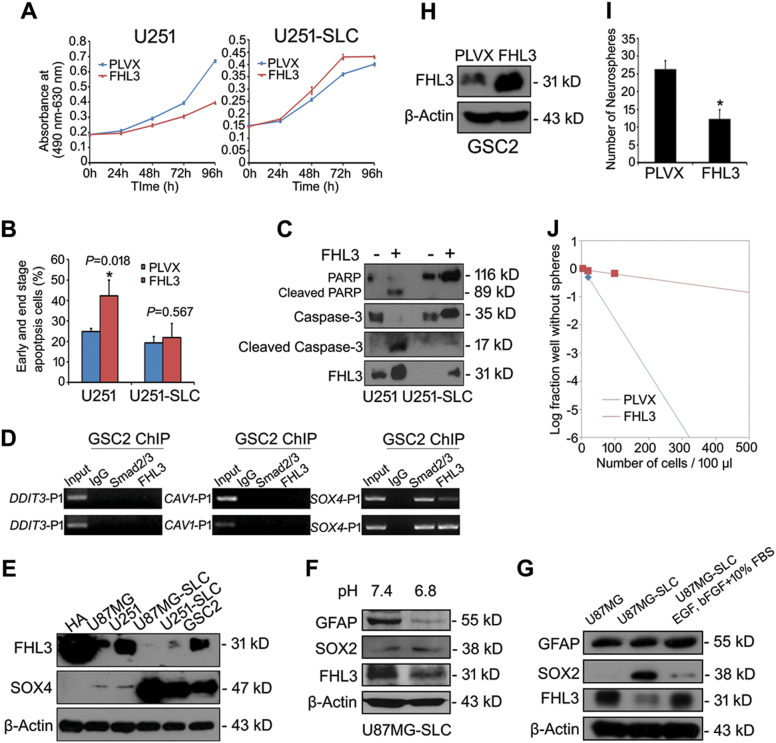
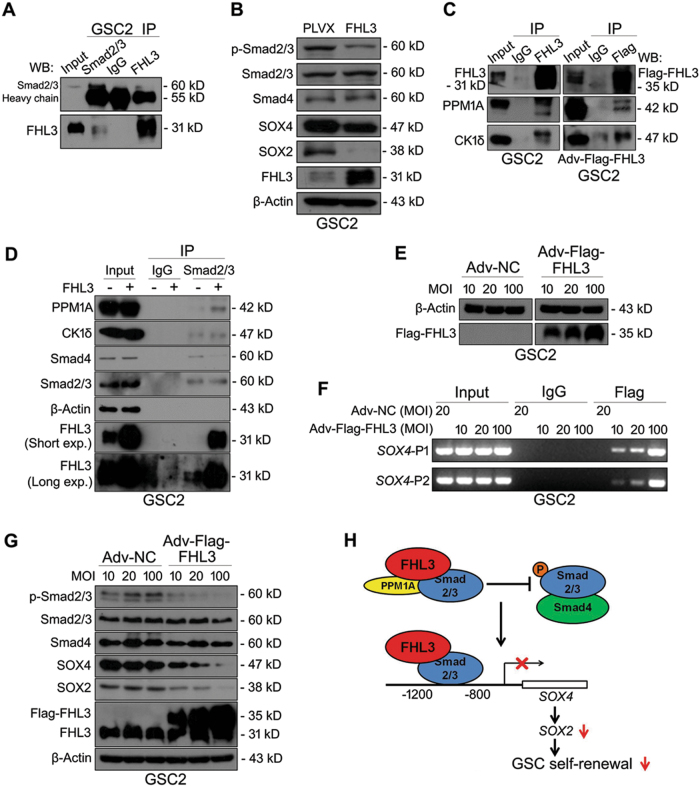
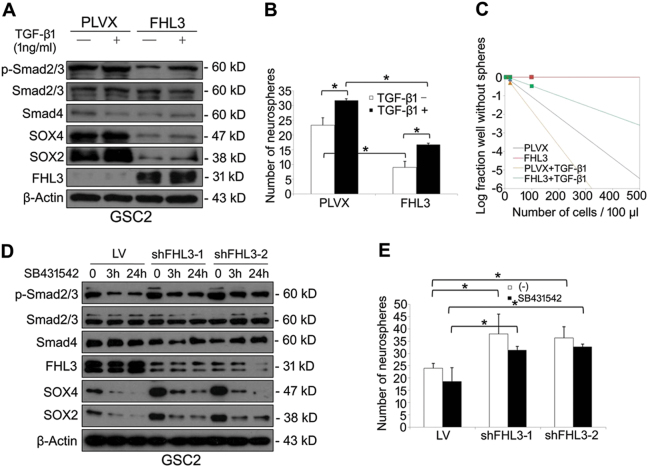
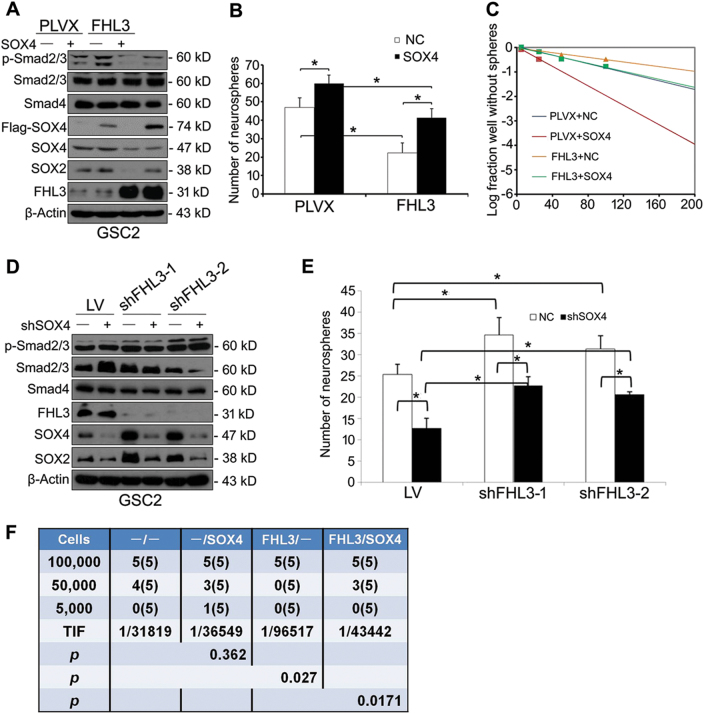
Differentiation status significantly affects the properties of malignant glioma cells, with non-stem cells inducing tumor enlargement and stem-like cells driving tumor initiation and treatment resistance. It is not completely understood how the same protein can have a distinct role in these cell populations. Here, we report that four and a half LIM domain protein 3 (FHL3) has an inhibitory effect on proliferation in non-stem glioma cells and a non-proliferative effect in glioma stem cells (GSCs). In GSCs, we show that FHL3 interacts with the Smad2/3 protein complex at the SOX4 promoter region, inhibits SOX4 transcriptional activity by recruiting PPM1A phosphatase to Smad2/3, and then suppresses GSC tumor sphere formation and self-renewal in vitro and in vivo via downregulation of SOX2 expression. Altogether, these findings highlight the role of FHL3 as a stemness-suppressor in regulation of the Smad2/3-SOX4-SOX2 axis in glioma.


Conflict of interest statement

The authors declare that they have no conflict of interest.

Figures

Fig. 1
Fig. 1
FHL3 regulates the target genes SOX4, CAV1, and DDIT3 in glioma cells. a Glioma cell lines (T98G, U87MG, and U251) were transfected with PLVX empty vector (−) or FHL3 overexpression plasmid (+). Lysates were collected 48 h post-transfection and immunoblotted for the indicated proteins. β-Actin was used as a loading control. The bar graph shows cell viability relative to the control groups 96 h post-transfection. b Schematic illustration of the procedure used to screen and refine the set of FHL3-regulated target genes identified by three independent glioma microarray data replicates. c Twenty-eight indicated genes reported to be involved in glioma were assessed by microarray (gray bars) and real-time PCR (black bars). GAPDH was used as a housekeeping gene. d Heatmaps illustrating the expression profiles of the 11 differentially expressed genes verified by microarray experiments (n = 3 for each biological replicate). e Soluble chromatin was subjected to immunoprecipitation with IgG or anti-FHL3 antibodies in T98G cells. We designed two pairs of primers (P1 and P2) to amplify the predicted binding regions upstream of each gene, as peaks were identified in these regions in the ChIP-on-chip assay. The locations of the peaks identified by the ChIP-on-chip assay are denoted as short red bars. Immunoprecipitated DNA was PCR amplified with primers (locations indicated with short green bars) that annealed to the proximal region of the DDIT3, CAV1, or SOX4 promoters. The lengths of the amplified fragments are 247 bp (DDIT3-P1), 237 bp (DDIT3-P2), 263 bp (CAV1-P1), 219 bp (CAV1-P2), 288 bp (SOX4-P1), and 210 bp (SOX4-P2)
Fig. 2
Fig. 2
FHL3 inhibits glioma cell proliferation mainly through the downregulation of SOX4 expression. a Representative western blot showing CAV1, DDIT3, SOX4, and FHL3 protein levels in FHL3-overexpressing (+) glioma cell lines. b, c Western blot analysis of T98G, U87MG, and U251 glioma cell lines transfected with pcDNA6.0-Flag-CAV1 (b), pcDNA6.0-Flag-DDIT3 (c) or control vector (−). An anti-Flag antibody was used to detect target gene overexpression. Bar graphs show the results of MTS assays in the same three glioma cell lines 96 h after transfection with plasmids. d, e Western blot analysis of SOX4 knockdown and overexpression in T98G, U87MG, and U251 glioma cell lines following lentiviral infection with shSOX4 (d), LV-3Flag-SOX4 (e), or a control (−). Anti-SOX4 and anti-Flag antibodies were separately used to detect SOX4 knockdown and overexpression, respectively. Bar graphs show the results of MTS assays performed 96 h after lentiviral infection in the same three glioma cell lines. f Western blot showing SOX4 and FHL3 protein levels in T98G and U251 glioma cell lines overexpressing either FHL3 or SOX4 alone or co-overexpressing FHL3 and SOX4. g Growth curves in T98G and U251 glioma cells overexpressing either FHL3 or SOX4 alone or co-overexpressing both FHL3 and SOX4. Data are presented as the mean ± SD of three independent experiments. *P < 0.05
Fig. 3
Fig. 3
FHL3 suppresses SOX4 transcriptional activity and TGF-β-responsive transcription in a TGF-β1-independent manner. a Schematic diagram of the SOX4 promoter reporter construct. b, c T98G cells were co-transfected with an FHL3 overexpression construct (b) or FHL3 siRNAs (c), and either the dual luciferase reporter vector pEZX-PG04 or a SOX4 promoter reporter. Cells were treated with (+) or without (−) TGF-β1 and analyzed for Gaussia Luciferase (GLuc) and Secreted Alkaline Phosphatase (SEAP) activities, using the SEAP signal as an internal control. The normalized signals (ratio of GLuc to SEAP activities) are represented as the mean ± SD of three independent experiments. *P < 0.05 versus empty vector (b) or control siRNA (c) without TGF-β1. #P < 0.05 versus empty vector (b) or control siRNA (c) with TGF-β1. d T98G cells were co-transfected with the TGF-β signaling pathway reporter p3TP-Lux and either an FHL3 overexpression construct or empty vector. Cells were treated with (+) or without (–) TGF-β1 and analyzed for luciferase activity. Values are presented as the mean ± SD of three independent experiments. *P < 0.05 versus empty vector without TGF-β1. #P < 0.05 versus empty vector with TGF-β1. e Microarray results showing changes in the expression of TGF-β-responsive genes upon FHL3 overexpression. Red represents upregulated genes, while blue represents downregulated genes. f The correlation between FHL3 and SOX4 mRNA in TCGA GBM samples was analyzed on the LinkedOmics website using a Spearman correlation test. g Relative SOX4 and FHL3 protein levels in 13 grade II, 13 grade II–III, 7 grade III, 5 grade III–IV, and 16 grade IV glioma tissues compared with 7 normal brain tissue controls. Western blotting results were quantified using ImageJ software and are shown as the relative ratios of SOX4/β-Actin or FHL3/β-Actin protein levels (average values shown above the blots). *P < 0.05. P values were generated using an unpaired t-test
Fig. 4
Fig. 4
FHL3 inhibits the self-renewal of glioma stem cells. a MTS assays demonstrating the growth of U251 (left) glioma cells and U251-SLC (right) stem cell-like glioma cells after transfection with either an FHL3 overexpression plasmid or a control vector (PLVX). b Flow cytometry-based quantification of apoptosis by Annexin V/PI staining in U251 and U251-SLC cells ~72 h following transfection. Early end stage apoptotic cell ratios were calculated and plotted on the histogram. c Representative western blot showing (cleaved) caspase-3 and its substrate, (cleaved) poly (ADP-ribose) polymerase (PARP) in transfected U251 and U251-SLC cells. d ChIP-PCR assays in GSC2 glioma stem cells. Soluble chromatin was prepared from GSC2 cells and subjected to immunoprecipitation with rabbit IgG (as a negative control) or the indicated antibodies. An anti-Smad2/3 antibody was used as a positive control for enrichment of the SOX4 promoter. PCR primers were designed to amplify the DDIT3, CAV1, or SOX4 promoter regions, as described previously. e Western blot analysis of FHL3 and SOX4 protein levels in HA normal human astrocytes, U87MG and U251 glioma cell lines, and U87MG-SLC, U251-SLC, and GSC2 stem cell-like glioma cells. f U87MG stem cell-like glioma cells were cultured in pH 7.4 or pH 6.8 medium. Western blot showing GFAP, SOX2, and FHL3 protein levels under these pH conditions. g Western blot showing FHL3 protein levels during the differentiation of U87MG stem cell-like glioma cells. GFAP was used as a marker of cell differentiation. SOX2 was used as a marker of stemness. h Western blot analysis of FHL3 expression in GSC2 cells infected with PLVX (control) or FHL3-overexpressing lentivirus. i Sphere formation assay in GSC2 cells infected with PLVX (control) or FHL3-overexpressing lentivirus. Neurospheres (diameter ≥ 50 μm) were counted. j GSC2 self-renewal capacity was measured using a limiting dilution assay. Cells infected with PLVX lentivirus were used as controls. For each cell plating density, wells not containing spheres (diameter ≥ 50 μm) were quantified. Data are presented as the mean ± SD of three independent experiments. *P < 0.05
Fig. 5
Fig. 5
FHL3 regulates Smad2/3 phosphorylation and suppresses the Smad2/3–SOX4–SOX2 axis. a For coimmunoprecipitation assays, GCS2 cells were fractionated and proteins were immunoprecipitated using anti-Smad2/3 or anti-FHL3 antibodies or pre-immune control serum (IgG). Precipitates were analyzed by western blotting with the indicated antibodies. b Representative western blot showing levels of FHL3 and Smad2/3–SOX4–SOX2 axis-related proteins in GSC2 cells infected with PLVX or PLVX-FHL3 lentivirus. c Non-infected and Flag-FHL3 adenovirus-infected GSC2 cells were fractionated and proteins were immunoprecipitated with an anti-FHL3 antibody and an anti-Flag antibody, respectively. Anti-PPM1A and anti-CK1δ antibodies were used to detect interactions with FHL3 protein by western blot. d GSC2 cells infected with PLVX (−) or PLVX-FHL3 (+) lentivirus were immunoprecipitated with an anti-Smad2/3 antibody or IgG. Precipitates were analyzed by western blotting with the indicated antibodies. e GSC2 cells were infected with adenovirus at 10, 20, and 100 multiplicities of infection (MOI). An anti-Flag antibody was used to detect increases in Flag-FHL3 levels. Adv-NC was used as a control. f ChIP-PCR assays in GSC2 cells infected with adenovirus at the indicated MOI. Soluble chromatin was subjected to immunoprecipitation with rabbit IgG or anti-Flag antibodies. Immunoprecipitated DNA was subjected to PCR to amplify the SOX4 promoter region using the primers described previously. g Representative western blot showing Smad2/3–SOX4–SOX2 axis-related proteins and FHL3 protein levels in GSC2 cells infected with Adv-NC or Adv-Flag-FHL3 at the indicated MOI. h Proposed model of FHL3 modulation of the Smad2/3–SOX4–SOX2 axis
Fig. 6
Fig. 6
FHL3 antagonizes TGF-β1-mediated activation of the Smad2/3–SOX4–SOX2 axis. a Representative western blot showing Smad2/3–SOX4–SOX2 axis-related proteins and FHL3 protein levels in GSC2 cells infected with PLVX vector or PLVX-FHL3 lentivirus with or without 1 ng/ml TGF-β1. b Sphere formation assay in GSC2 cells with or without 1 ng/ml TGF-β1. c Limiting dilution neurosphere assay in GSC2 cells infected with PLVX vector or PLVX-FHL3 lentivirus with or without 1 ng/ml TGF-β1. d GSC2 cells after infection with either the control shRNA lentivirus (LV) or an shFHL3 lentivirus (shFHL3-1 and shFHL3-2) were cultured with a TGF-β1 inhibitor (SB431542, 1 µM) for 0, 3, and 24 h. Representative western blot showing Smad2/3–SOX4–SOX2 axis-related proteins and FHL3 protein levels in these stem cell-like glioma cells. e Sphere formation assay in infected GSC2 cells treated with a TGF-β1 inhibitor (SB431542, 1 µM) for 0 and 7 days. Data are presented as the mean ± SD of three independent experiments. *P < 0.05
Fig. 7
Fig. 7
SOX4 rescues FHL3-mediated inhibition of SOX2 (stemness marker) expression and sphere-forming ability in glioma stem cells. a Following infection with PLVX vector or PLVX-FHL3 lentivirus, GSC2 cells were re-infected with control or Flag-SOX4 lentivirus. Representative western blot showing expression of FHL3 and Smad2/3–SOX4–SOX2 axis-related proteins in the infected GSC2 cells. b Sphere formation assay in the infected GSC2 cells. c Limiting dilution neurosphere assay in the infected GSC2 cells. d Following infection with control shRNA lentivirus (LV) or shFHL3 lentivirus (shFHL3-1 and shFHL3-2), GSC2 cells were re-infected with control or shSOX4 lentivirus. Representative western blot showing expression levels of Smad2/3–SOX4–SOX2 axis-related proteins and FHL3 in the infected GSC2 cells. e Sphere formation assay in the shRNA lentivirus-infected GSC2 cells. f Limiting dilution assay showing rescue of GSC2 tumor-initiating capacity by SOX4 in vivo. Limiting dilutions of the infected GSC2 cells were subcutaneously implanted into nude mice. The table shows the number of mice that grew tumors at week 10 (out of a total of 5 mice per group). Tumor-initiating frequency (TIF) was calculated using ELDA software. P < 0.05 was used as the significance threshold for comparisons between the FHL3-overexpression group and the control group as well as the FHL3 and SOX4 co-overexpression group and the FHL3-overexpression group. Data are presented as the mean ± SD of three independent experiments. *P < 0.05

Similar articles

Cited by

References

    1. Ostrom QT, Gittleman H, Fulop J, Liu M, Blanda R, Kromer C, et al. CBTRUS statistical report: primary brain and central nervous system tumors diagnosed in the United States in 2008-2012. Neuro Oncol. 2015;17:iv1–62. doi: 10.1093/neuonc/nov189. - DOI - PMC - PubMed
    1. Vescovi AL, Galli R, Reynolds BA. Brain tumour stem cells. Nat Rev Cancer. 2006;6:425–36. doi: 10.1038/nrc1889. - DOI - PubMed
    1. Chen J, Li Y, Yu TS, McKay RM, Burns DK, Kernie SG, et al. A restricted cell population propagates glioblastoma growth after chemotherapy. Nature. 2012;488:522–6. doi: 10.1038/nature11287. - DOI - PMC - PubMed
    1. Godek KM, Venere M, Wu Q, Mills KD, Hickey WF, Rich JN, et al. Chromosomal instability affects the tumorigenicity of glioblastoma tumor-initiating cells. Cancer Discov. 2016;6:532–45. doi: 10.1158/2159-8290.CD-15-1154. - DOI - PMC - PubMed
    1. Liau BB, Sievers C, Donohue LK, Gillespie SM, Flavahan WA, Miller TE, et al. Adaptive chromatin remodeling drives glioblastoma stem cell plasticity and drug tolerance. Cell Stem Cell. 2017;20:233–46. doi: 10.1016/j.stem.2016.11.003. - DOI - PMC - PubMed

Publication types