. 2018 Oct;12(10):2544-2558.
doi: 10.1038/s41396-018-0065-5. Epub 2018 Jun 28.

Methanotrophy across a natural permafrost thaw environment

Affiliations

Methanotrophy across a natural permafrost thaw environment

Caitlin M Singleton et al. ISME J. 2018 Oct.

Abstract

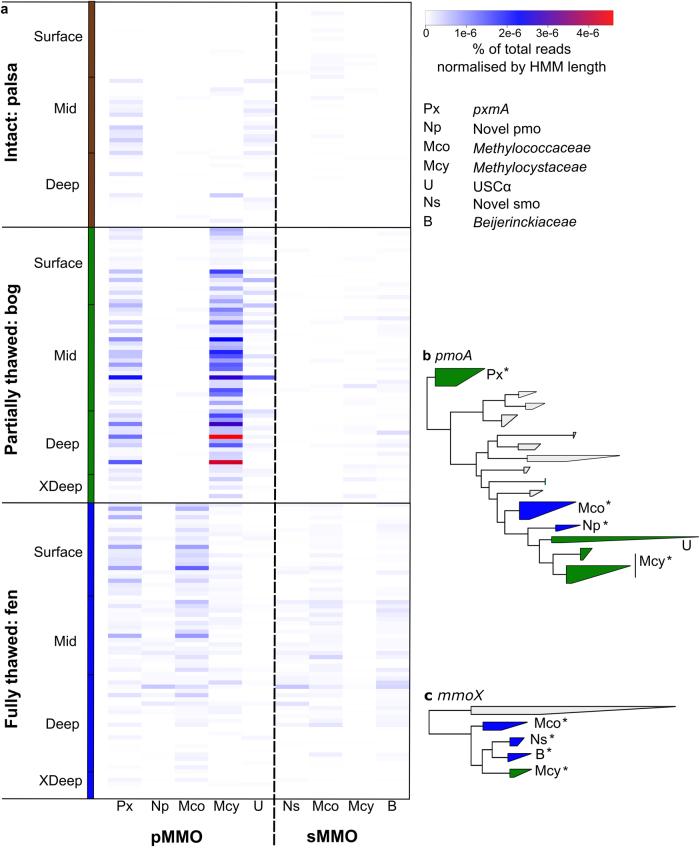
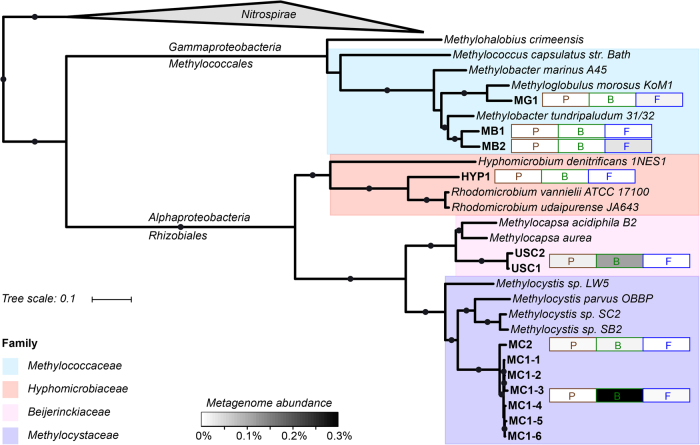
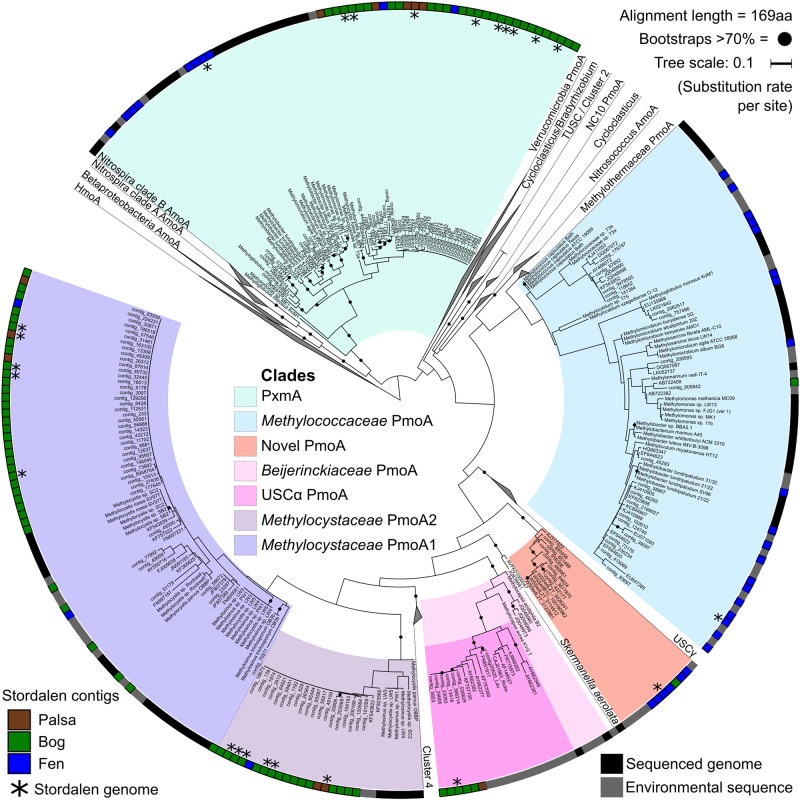
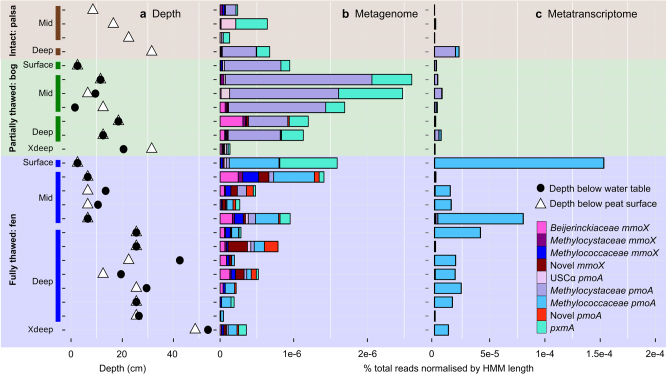
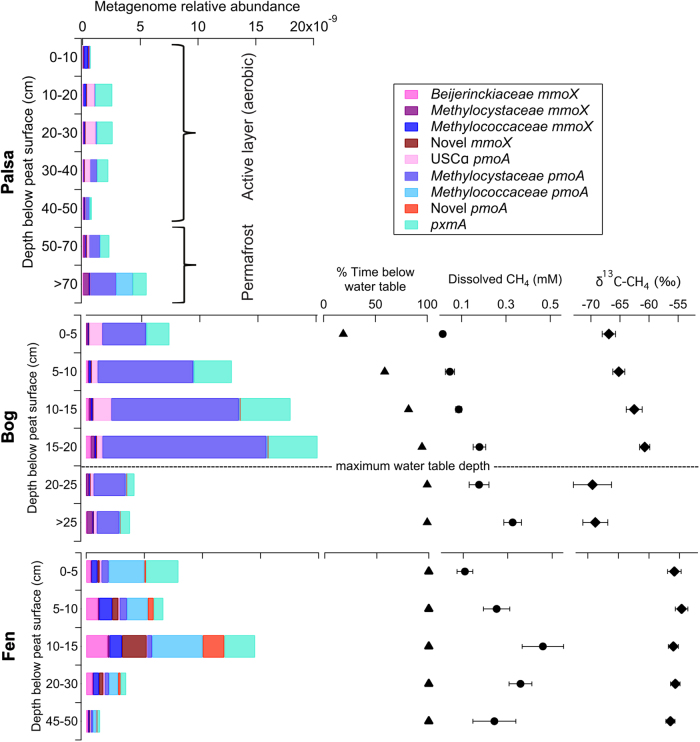
The fate of carbon sequestered in permafrost is a key concern for future global warming as this large carbon stock is rapidly becoming a net methane source due to widespread thaw. Methane release from permafrost is moderated by methanotrophs, which oxidise 20-60% of this methane before emission to the atmosphere. Despite the importance of methanotrophs to carbon cycling, these microorganisms are under-characterised and have not been studied across a natural permafrost thaw gradient. Here, we examine methanotroph communities from the active layer of a permafrost thaw gradient in Stordalen Mire (Abisko, Sweden) spanning three years, analysing 188 metagenomes and 24 metatranscriptomes paired with in situ biogeochemical data. Methanotroph community composition and activity varied significantly as thaw progressed from intact permafrost palsa, to partially thawed bog and fully thawed fen. Thirteen methanotroph population genomes were recovered, including two novel genomes belonging to the uncultivated upland soil cluster alpha (USCα) group and a novel potentially methanotrophic Hyphomicrobiaceae. Combined analysis of porewater δ13C-CH4 isotopes and methanotroph abundances showed methane oxidation was greatest below the oxic-anoxic interface in the bog. These results detail the direct effect of thaw on autochthonous methanotroph communities, and their consequent changes in population structure, activity and methane moderation potential.


Conflict of interest statement

The authors declare that they have no conflict of interest.

Figures

Fig. 1
Fig. 1
Methanotroph diversity across the Stordalen Mire thaw gradient. a Heatmap of the relative abundance of methanotrophs as a proportion of the total metagenome based on the particulate methane monooxygenase (pMMO; left) and the soluble methane monooxygenase (sMMO; right). Abundances are indicated by the coloured scale (from white, to blue, to red). The trees used by GraftM to classify the reads are shown for pmoA (b) and mmoX (c). The colour of the clades indicates the environment where these clades are most often found (green = bog, blue = fen). Asterisks indicate significantly different abundances based on one-way ANOVA tests and Bonferroni corrected pairwise t-tests (p value < 0.05; see Supplementary Table 6)
Fig. 2
Fig. 2
Genome tree of the methanotroph population genomes recovered from Stordalen Mire. Solid circles represent bootstrap support of over 70%. Heatmap bars indicate average relative abundance per environment (P = palsa (brown), B = bog (green), F = fen (blue)) as a percentage of the total metagenome library (Supplementary Information). Raw values and standard deviation are presented in Supplementary Table 8. The highest abundances are observed for MC1 (1.85% in a deep bog sample) and USC1 (1.6% in a mid-depth bog sample)
Fig. 3
Fig. 3
Phylogenetic tree of PmoA proteins recovered from Stordalen Mire. This tree is constructed from isolate-derived protein sequences (colour strip = black), Stordalen sequences (colour strip: palsa = brown; bog = green; fen = blue) and translated environmental sequences compiled by Knief [18] (colour strip = grey), with additional sequences from He et al. [43], Ricke et al. [26] and Lau et al. [22] (colour strip = grey). The asterisks indicate sequences that are within population genomes
Fig. 4
Fig. 4
Metabolic reconstruction of the alphaproteobacterial population genomes MC1, HYP1 and USC1. Colours indicate the genome or combination of genomes (Venn diagram) in which the cycle or enzymes are found. Abbreviations: H4F tetrahydrofolate pathway, H4MPT tetrahydromethanopterin pathway, TCA tricarboxylic acid cycle, EMC ethylmalonyl-CoA pathway, EMP Embden–Meyerhof–Parnas pathway (glycolysis), CBB Calvin–Benson–Bassham cycle, PHB polyhydroxybutyrate pathway, LPS lipopolysaccharide, CODH carbon monoxide dehydrogenase, NiFe nickel iron hydrogenase, nitrogenase (NifHDK), pMMO particulate methane monooxygenase, pMMO2 particulate methane monooxygenase isozyme II, sMMO soluble methane monooxygenase, pXMO homologue of particulate methane monooxgyenase, CH3OH methanol, I complex I NADH dehydrogenase, II complex II succinate dehydrogenase, III complex III cytochrome bc1, IV cytochrome c oxidase, IV cbb3 complex IV cytochrome cbb3 oxidase, cyd complex IV cytochrome bd oxidase, FDH formate dehydrogenase, EHR energy converting hydrogenase related (part of formate hydrogenlyase complex), SO42− sulphate, MoO42− molybdate, Zn zinc, PO43− phosphate, CHOH formaldehyde, sulphate adenylyltransferase (SatAB), APS adenosine 5'-phosphosulphate, SO32− sulphite, adenylylsulphate reductase (AprAB), dissimilatory sulphite reductase (DsrAB), H2S hydrogen sulphide, dissimilatory sulphite reductase electron transport complex (DsrK representing the DsrKMJOP complex), SoxYZ/SoxAX/SoxB/SoxCD = sulphur oxidising proteins. See Supplementary Fig. 7 for detailed gene presence/absence and Supplementary Table 3 for the list of additional abbreviations
Fig. 5
Fig. 5
Methanotroph abundance and activity in the 24 samples with paired metagenomes and metatranscriptomes from Stordalen Mire. For spatial orientation, distance from the water table and peat surface is shown in a. The metagenome abundances are indicated in b and the transcript expression in c. Methanotroph pmoA and mmoX read abundances are presented as a percentage of total reads normalised by HMM length for both metagenomes and metatranscriptomes
Fig. 6
Fig. 6
Depth profiles of palsa, bog and fen methanotroph community abundances (as pmoA and mmoX gene reads normalised by total library and HMM length) and relationship to water table, dissolved CH4 concentration and δ13C signature (no porewater present at the palsa site). Metagenome and porewater chemistry data from 2011 and 2012 was averaged across all dates by depth category; error bars represent ± 1 standard error. This shows a link between methanotroph abundances and dissolved CH4 concentration across the thaw gradient. At the bog site, δ13C-CH4 patterns track the depth distribution of the methanotroph community, with the heaviest (most oxidised) CH4 occurring just above the maximum water table depth where methanogen populations are highest and the lightest (least oxidised) CH4 occurring in permanently inundated peat where methanotroph abundances are low

References

    1. Froese DG, Westgate JA, Reyes AV, Enkin RJ, Preece SJ. Ancient permafrost and a future, warmer Arctic. Science. 2008;321:1648. doi: 10.1126/science.1157525. - DOI - PubMed
    1. Schuur EAG, Mcguire AD, Schadel C, Grosse G, Harden JW, Hayes DJ, et al. Climate change and the permafrost carbon feedback. Nature. 2015;520:171–9. doi: 10.1038/nature14338. - DOI - PubMed
    1. Tarnocai C, Riley WJ, Canadell JG, Schuur EAG, Kuhry P, Mazhitova G, Zimov S. Soil organic carbon pools in the northern circumpolar permafrost region. Glob Biogeochem Cycles. 2009;23:GB2023. doi: 10.1029/2008GB003327. - DOI
    1. Koven CD, Riley WJ, Stern A. Analysis of permafrost thermal dynamics and response to climate change in the CMIP5 earth system models. J Clim. 2013;26:1877–1900. doi: 10.1175/JCLI-D-12-00228.1. - DOI
    1. Nazaries L, Murrell JC, Millard P, Baggs L, Singh BK. Methane, microbes and models: fundamental understanding of the soil methane cycle for future predictions. Environ Microbiol. 2013;15:2395–417. doi: 10.1111/1462-2920.12149. - DOI - PubMed

Publication types