. 2018 Jun 28;8(1):9793.
doi: 10.1038/s41598-018-28124-3.

Sample-to-Answer Droplet Magnetofluidic Platform for Point-of-Care Hepatitis C Viral Load Quantitation

Affiliations

Sample-to-Answer Droplet Magnetofluidic Platform for Point-of-Care Hepatitis C Viral Load Quantitation

Dong Jin Shin et al. Sci Rep. .

Abstract

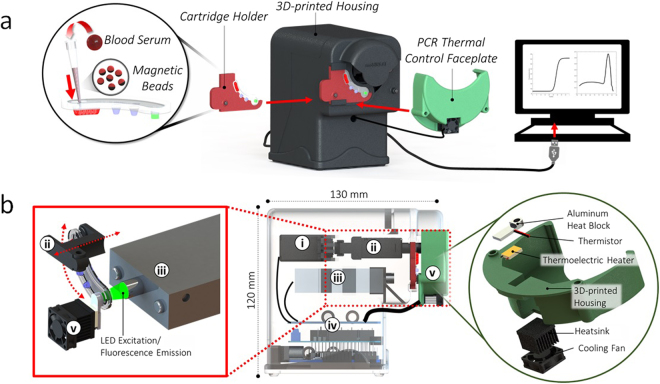
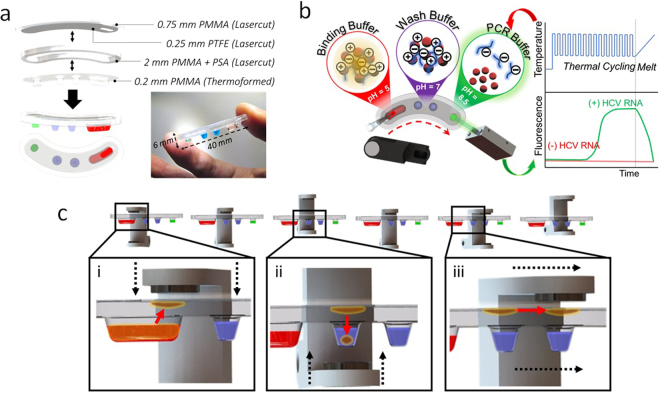
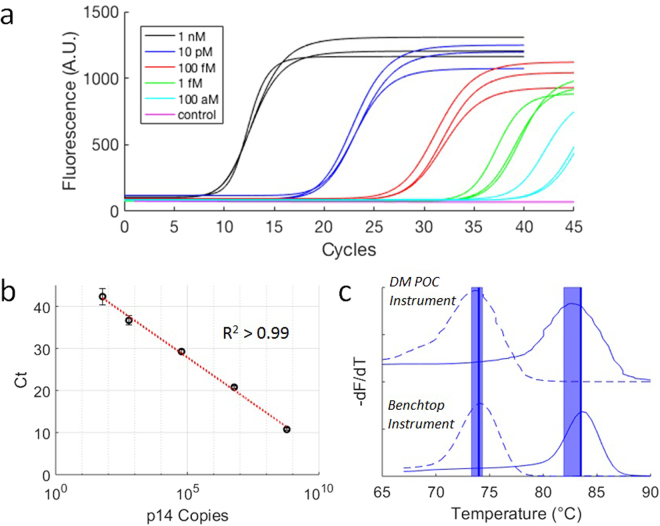
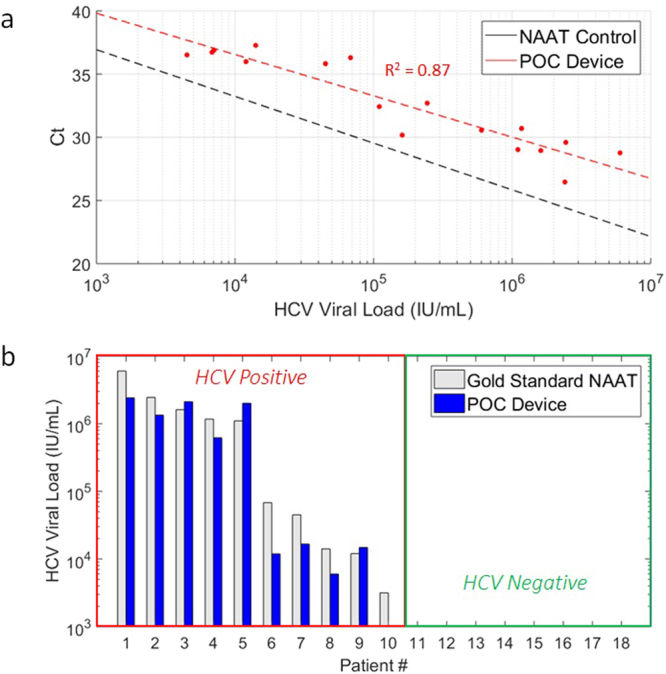
Gold standard quantitative nucleic acid tests for diagnosis of viral diseases are currently limited to implementation in laboratories outside of the clinic. An instrument for conducting nucleic acid testing at the point-of-care (POC) that is easily operable by the clinician would reduce the required number of visits to the clinic and improve patient retention for proper treatment. Here we present a droplet magnetofluidic (DM) platform, which leverages functionalized magnetic particles to miniaturize and automate laboratory assays for use in the clinic at the POC. Our novel thermoformed disposable cartridge coupled to a portable multiaxial magnetofluidic instrument enables real-time PCR assays for quantitative and sensitive detection of nucleic acids from crude biosamples. Instead of laborious benchtop sample purification techniques followed by elution and spiking into PCR buffer, the user simply injects the biosample of interest into a cartridge with magnetic particles and loads the cartridge into the instrument. We demonstrate the utility of our platform with hepatitis C virus (HCV) RNA viral load quantitation from blood serum in approximately 1 hour. Clinical serum samples (n = 18) were directly processed on cartridges with no false positives and a limit of detection of 45 IU per 10 µl sample injection.


Conflict of interest statement

The authors declare no competing interests.

Figures

Figure 1
Figure 1
Device operation and instrumentation (a) the complete user-operation steps are illustrated here from left to right including injection of serum with magnetic particles into the cartridge, cartridge mounting in a holder with insertion into the instrument, assembly of the faceplate onto the cartridge for thermal cycling, and USB readout of PCR results. (b) A profile view of the instrument with ghosted housing reveals internal components including (i) rotational servo and (ii) linear servo for magnetic particle transferal between cartridge wells and in/out of reagent droplets respectively, (iii) confocal epifluorescence detector for PCR fluorescence acquisition, (iv) microcontroller electronics for integrated control of magnetic manipulation, algorithmic heating, triggering fluorescence detection, and serial communication for data storage and analysis, (v) PCR thermal control faceplate with a fan-cooled heatsinked thermoelectric heating element attached to an aluminum heat block that fits over the cartridge PCR well with an embedded thermistor probe for monitoring temperature.
Figure 2
Figure 2
Cartridge Design. (a) Cartridges are fabricated with three parts: a lasercut top layer of poly(methyl methacrylate) (PMMA) with a coating of poly(tetrafluoroethylene) (PTFE) tape for smooth particle plug transfer between wells, a middle laser cut layer of PMMA as a spacer for containing silicone oil in the transition region between wells, and a bottom vacuum-formed PMMA layer with extruded wells for containing reagents. Pressure sensitive adhesives (PSA) applied to both surfaces of the middle spacer generates a leak-proof seal upon cartridge assembly. (b) Overview of nucleic acid purification and PCR assay droplet reagents with their arrangement within cartridge wells. Samples of interest are injected with magnetic particles into the first well containing 40 µl of a binding buffer (pH = 5) through an opening in the top of the cartridge. At this low pH, the polyhistidine coating of the magnetic particles is positively-charged, which allows binding to negatively-charged nucleic acids by electrostatic forces. Transfer of magnetic particles through two wash buffers (pH = 7) purifies the captured nucleic acids via desorption of unbound cellular debris or proteins that may inhibit the PCR reaction. Final transfer into the PCR solution (pH = 8.5) neutralizes the charge of the magnetic particle surface allowing for elution of nucleic acids for thermal cycling and subsequent melt analysis coupled with fluorescence detection. (c) Particle transfer actuation is accomplished by (i) descent of the upper magnet to draw particle plug into oil for collection at the PTFE surface, (ii) ascent of the lower magnet to introduce particle plug into reagent droplets, and (iii) magnet rotation for particle transfer between wells.
Figure 3
Figure 3
PCR temperature consistency. (a) Thermal cycling profile as measured by thermistors within the heat block (dashed line) and embedded within a test cartridge PCR well (solid line). PCR assays demonstrated here used a 2-minute hot-start at 95 °C followed by 45 cycles of 20 seconds at 65 °C anneal and 5 seconds at 95 °C denature. (b) Temperature ramp profile demonstrating close agreement between the targeted temperature with the actual measured temperature in the cartridge with error measuring <1 °C throughout the relevant range of temperatures for melt analysis of amplified nucleic acid products.
Figure 4
Figure 4
PCR Thermal Cycling Characterization. (a) Cross-sectional schematic of the aluminum heat block with inserted PCR well of thermoformed cartridge. Thermally conductive paste was used to ensure complete contact and heat transfer between the heat block and cartridge. (b) Comparison of maximum, average, and minimum temperature of the PCR solution tracked during finite-element COMSOL simulation versus actual temperature measured by a separate thermistor directly within the cartridge well during thermal cycling. (c) Temperature heat-map snapshots from cross-section of the finite-element simulation. The top row follows cooling from a uniform temperature of 95 °C while the bottom row shows the heating back to 95 °C. Uniform temperature distribution within ~1 °C of the target annealing and denaturation temperatures is evident throughout the entire PCR solution delineated by the rectangle at the bottom of the well at the end of each heating and cooling phase.
Figure 5
Figure 5
Cartridge PCR and melt performance. (a) Real-time fluorescence of PCR thermal cycling on cartridge using 10 µl PCR solutions directly spiked with dilutions of synthetic p14(ARF) oligonucleotide targets ranging from 1 nM to 100 aM in concentration (n = 3 for each dilution). No specific amplification was detected with a negative control (pink). (b) Standard curve generated from the cycle threshold (Ct) values calculated from the PCR in (a). (c) Comparison of p14(ARF) amplicon melt curves generated by our instrument (top) with those generated by a commercial benchtop thermocycler (bottom). The dashed lines indicate the low melt temperature curve of a shorter nonspecific product that is amplified when a PCR solution is left at room temperature for several hours, while the solid lines are melt curves of the desired amplicon products produced when the target is present in the PCR solution. The dark vertical lines represent the benchtop thermal cycler melt temperatures (Tm = 74 °C and 83.5 °C) which had a 0.5 °C resolution and were consistent between runs. The broader vertical bars denote one standard deviation from the average melt temperatures detected with the cartridges (Tm = 73.8 ± 0.5 °C and 82.7 ± 0.8 °C).
Figure 6
Figure 6
Clinical serum viral load evaluation. (a) Standard curve for threshold cycles versus HCV RNA input generated from cartridge (red) compared to standard curve obtained from NAAT control conducted on a benchtop thermocycler (Fig. S7). Nine HCV-infected clinical blood serum samples (undiluted and 10% serum in water, n = 18) were injected into cartridges in 10 µl aliquots. The limit of detection was found to be approximately 45 IU of HCV RNA. (b) Measurement of HCV RNA from 10 µl undiluted serum samples using DM-PCR assay cartridges. Estimates of HCV IU (blue bars) were calculated by substituting Ct values from each cartridge PCR test into the fitted relationship represented by the dotted red line in (a). The actual values (gray bars) were based on HCV IU concentrations for each patient reported by clinical laboratory processing. Only patient 10 with the lowest viral load (3,160 IU/ml) went undetected out of all positive samples (n = 10). No false positives were detected through cartridge processing of the cleared HCV negative patient samples (n = 8).

Similar articles

Cited by

References

    1. Edlin BR, Eckhardt BJ, Shu MA, Holmberg SD, Swan T. Toward a more accurate estimate of the prevalence of hepatitis C in the United States. Hepatology. 2015;62:1353–1363. doi: 10.1002/hep.27978. - DOI - PMC - PubMed
    1. IOM (Institute of Medicine). Hepatitis and Liver Cancer: A National Strategy for Prevention and Control of Hepatitis B and C, 10.17226/12793 (The National Academies Press, 2010). - PubMed
    1. Hagan H, et al. Self-reported hepatitis C virus antibody status and risk behavior in young injectors. Public Health Rep. 2006;121:710–719. doi: 10.1177/003335490612100611. - DOI - PMC - PubMed
    1. Rein DB, et al. The cost-effectiveness of birth-cohort screening for hepatitis C antibody in U.S. primary care settings. Ann. Intern. Med. 2012;156:263–270. doi: 10.7326/0003-4819-156-4-201202210-00378. - DOI - PMC - PubMed
    1. Linas, B. P. et al. The hepatitis C cascade of care: Identifying priorities to improve clinical outcomes. Plos One9 (2014). - PMC - PubMed

Publication types