

Transmission ratio distortion is frequent in Arabidopsis thaliana controlled crosses
- PMID: 29955170
- PMCID: PMC6169738
- DOI: 10.1038/s41437-018-0107-9
Transmission ratio distortion is frequent in Arabidopsis thaliana controlled crosses
Abstract
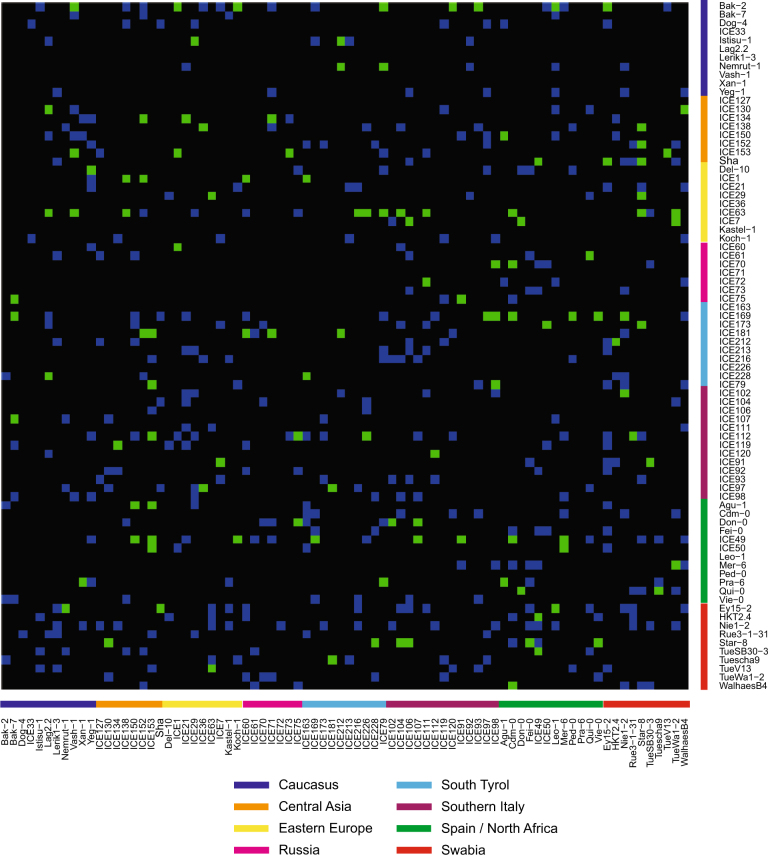
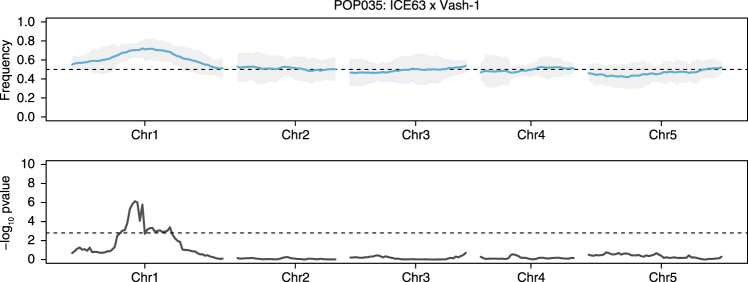
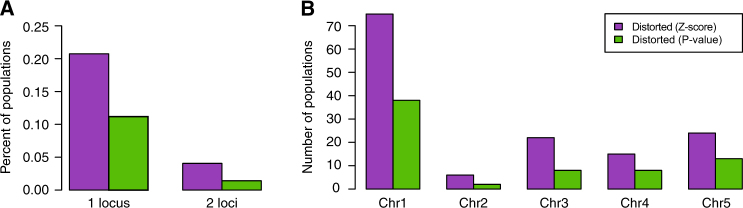
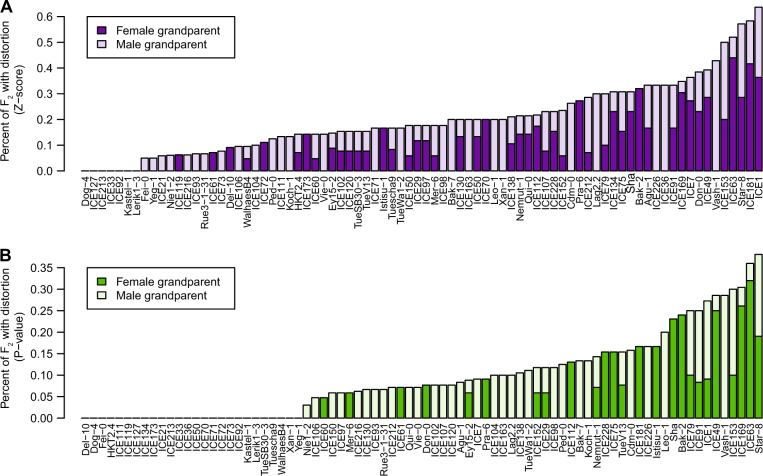
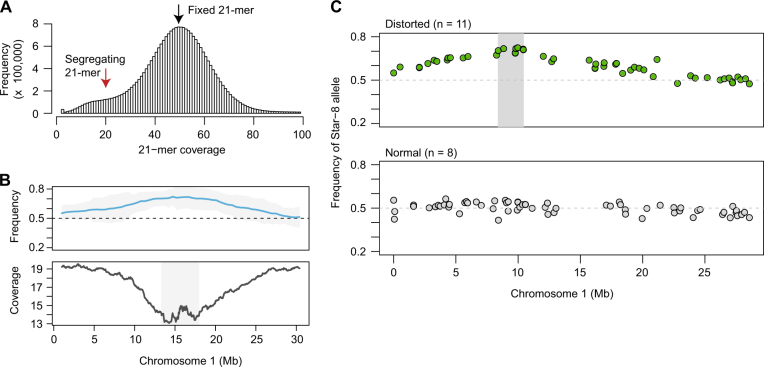
The equal probability of transmission of alleles from either parent during sexual reproduction is a central tenet of genetics and evolutionary biology. Yet, there are many cases where this rule is violated. The preferential transmission of alleles or genotypes is termed transmission ratio distortion (TRD). Examples of TRD have been identified in many species, implying that they are universal, but the resolution of species-wide studies of TRD are limited. We have performed a species-wide screen for TRD in over 500 segregating F2 populations of Arabidopsis thaliana using pooled reduced-representation genome sequencing. TRD was evident in up to a quarter of surveyed populations. Most populations exhibited distortion at only one genomic region, with some regions being repeatedly affected in multiple populations. Our results begin to elucidate the species-level architecture of biased transmission of genetic material in A. thaliana, and serve as a springboard for future studies into the biological basis of TRD in this species.
Conflict of interest statement
The authors declare that they have no conflict of interest.
Figures
Similar articles
-
Genome-wide dissection of segregation distortion using multiple inter-subspecific crosses in rice.Sci China Life Sci. 2019 Apr;62(4):507-516. doi: 10.1007/s11427-018-9452-8. Epub 2019 Mar 7. Sci China Life Sci. 2019. PMID: 30863959
-
Implementation of Bayesian methods to identify SNP and haplotype regions with transmission ratio distortion across the whole genome: TRDscan v.1.0.J Dairy Sci. 2019 Apr;102(4):3175-3188. doi: 10.3168/jds.2018-15296. Epub 2019 Feb 7. J Dairy Sci. 2019. PMID: 30738671
-
Genome scans for transmission ratio distortion regions in mice.Genetics. 2012 May;191(1):247-59. doi: 10.1534/genetics.111.135988. Epub 2012 Feb 23. Genetics. 2012. PMID: 22367040 Free PMC article.
-
Transmission ratio distortion: review of concept and implications for genetic association studies.Hum Genet. 2013 Mar;132(3):245-63. doi: 10.1007/s00439-012-1257-0. Epub 2012 Dec 15. Hum Genet. 2013. PMID: 23242375 Review.
-
Standard Deviations: The Biological Bases of Transmission Ratio Distortion.Annu Rev Genet. 2019 Dec 3;53:347-372. doi: 10.1146/annurev-genet-112618-043905. Epub 2019 Sep 10. Annu Rev Genet. 2019. PMID: 31505133 Review.
Cited by
-
Recurrent breakdown and rebalance of segregation distortion in the genomes: battle for the transmission advantage.aBIOTECH. 2020 Jul 8;1(4):246-254. doi: 10.1007/s42994-020-00023-0. eCollection 2020 Oct. aBIOTECH. 2020. PMID: 36304131 Free PMC article. Review.
-
Influence of Gender Bias on Distribution of Hybrid Sterility in Rice.Front Plant Sci. 2022 Jul 12;13:898206. doi: 10.3389/fpls.2022.898206. eCollection 2022. Front Plant Sci. 2022. PMID: 35903237 Free PMC article. Review.
-
Genomic screening of allelic and genotypic transmission ratio distortion in horse.PLoS One. 2023 Aug 9;18(8):e0289066. doi: 10.1371/journal.pone.0289066. eCollection 2023. PLoS One. 2023. PMID: 37556504 Free PMC article.
-
OlCHR, encoding a chromatin remodeling factor, is a killer causing hybrid sterility between rice species Oryza sativa and O. longistaminata.iScience. 2024 Apr 17;27(5):109761. doi: 10.1016/j.isci.2024.109761. eCollection 2024 May 17. iScience. 2024. PMID: 38706863 Free PMC article.
-
Whole-genome resequencing reveals loci with allelic transmission ratio distortion in F1 chicken population.Mol Genet Genomics. 2021 Mar;296(2):331-339. doi: 10.1007/s00438-020-01744-z. Epub 2021 Jan 6. Mol Genet Genomics. 2021. PMID: 33404883
References
-
- Alonso-Blanco C, Peeters AJ, Koornneef M, Lister C, Dean C, van den Bosch N, et al. Development of an AFLP based linkage map of Ler, Col and Cvi Arabidopsis thaliana ecotypes and construction of a Ler/Cvi recombinant inbred line population. Plant J. 1998;14(2):259–271. - PubMed
Publication types
MeSH terms
Grants and funding
LinkOut - more resources
Full Text Sources
Other Literature Sources
Miscellaneous
