. 2019 Jun;16(6):590-601.
doi: 10.1038/s41423-018-0058-3. Epub 2018 Jun 28.

An altered CD8+ T cell epitope of insulin prevents type 1 diabetes in humanized NOD mice

Affiliations

An altered CD8+ T cell epitope of insulin prevents type 1 diabetes in humanized NOD mice

Mengjun Zhang et al. Cell Mol Immunol. 2019 Jun.

Abstract

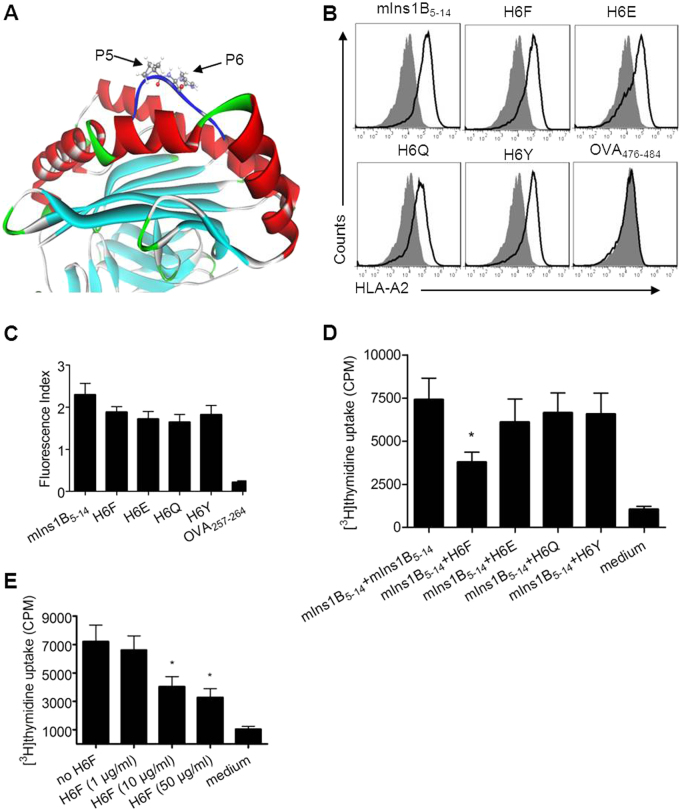
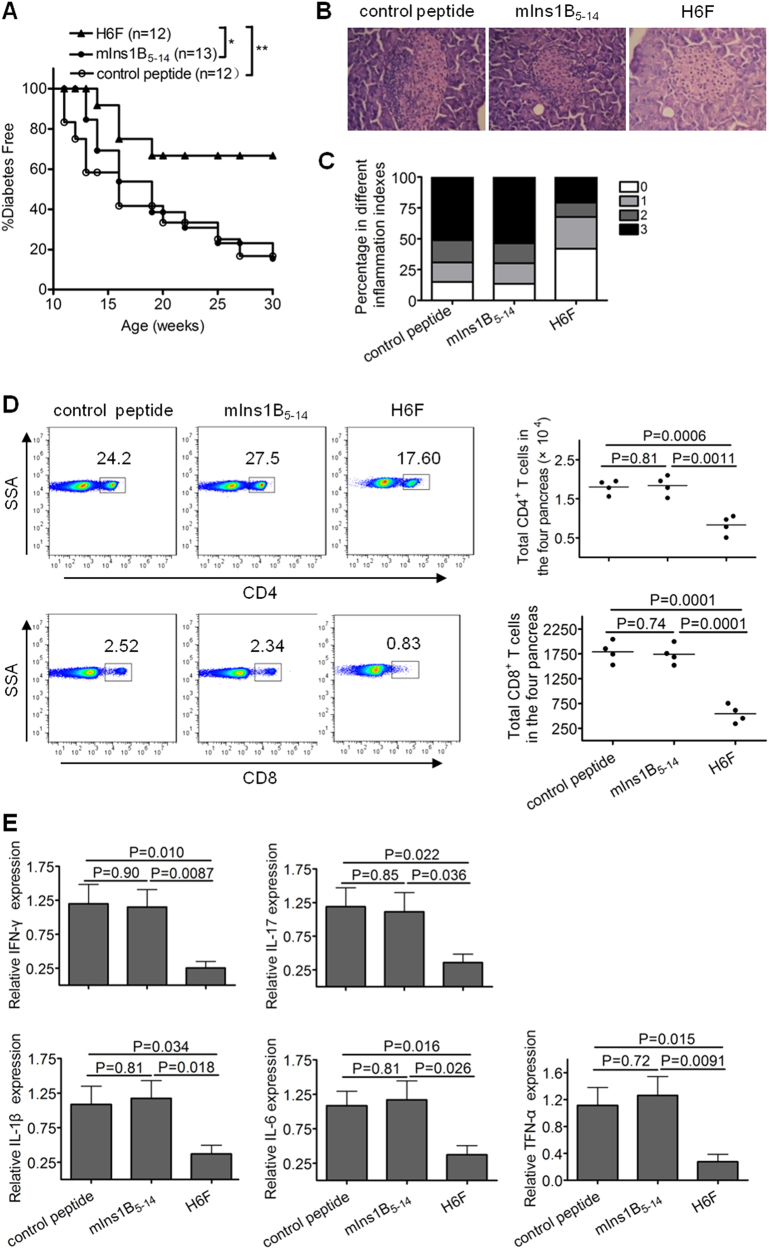
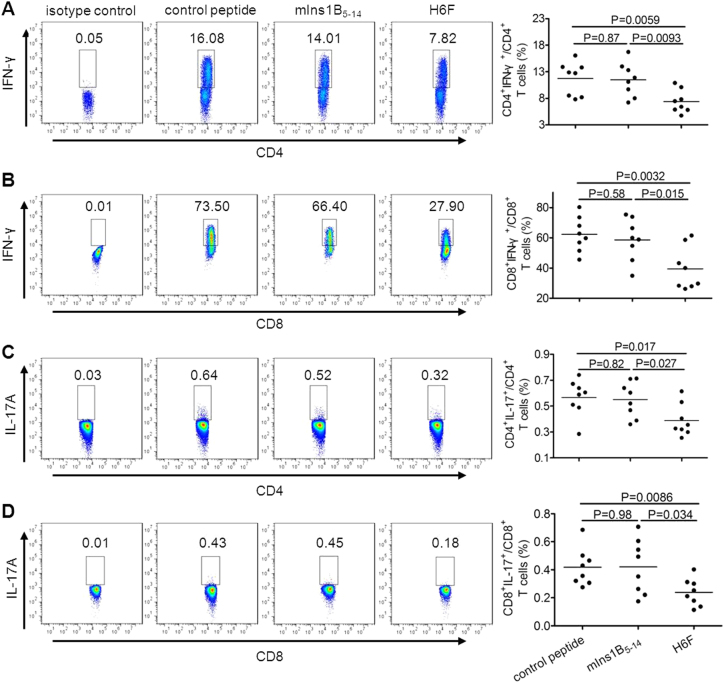
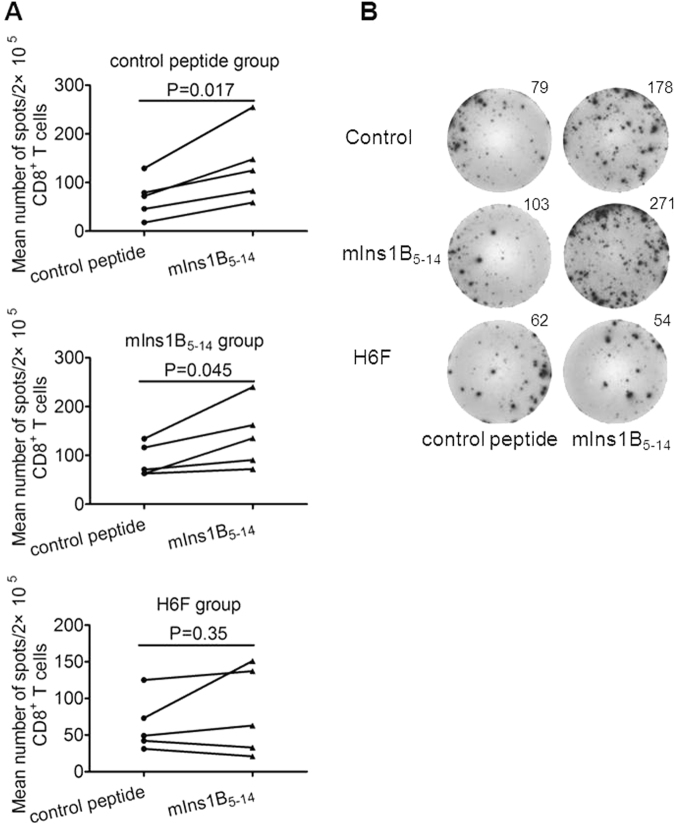
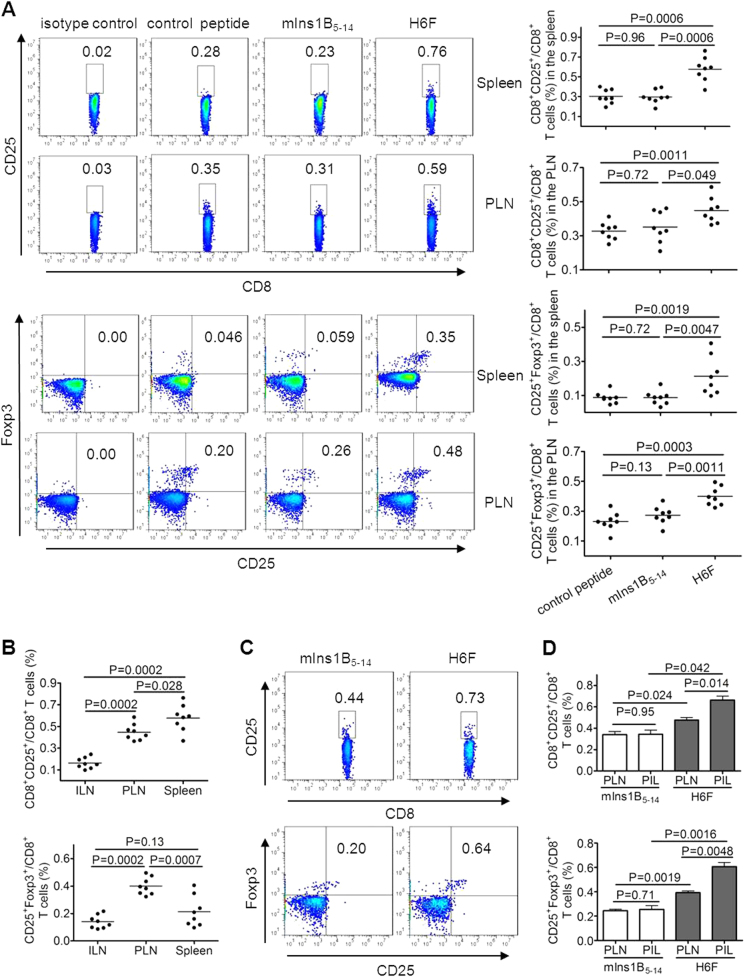
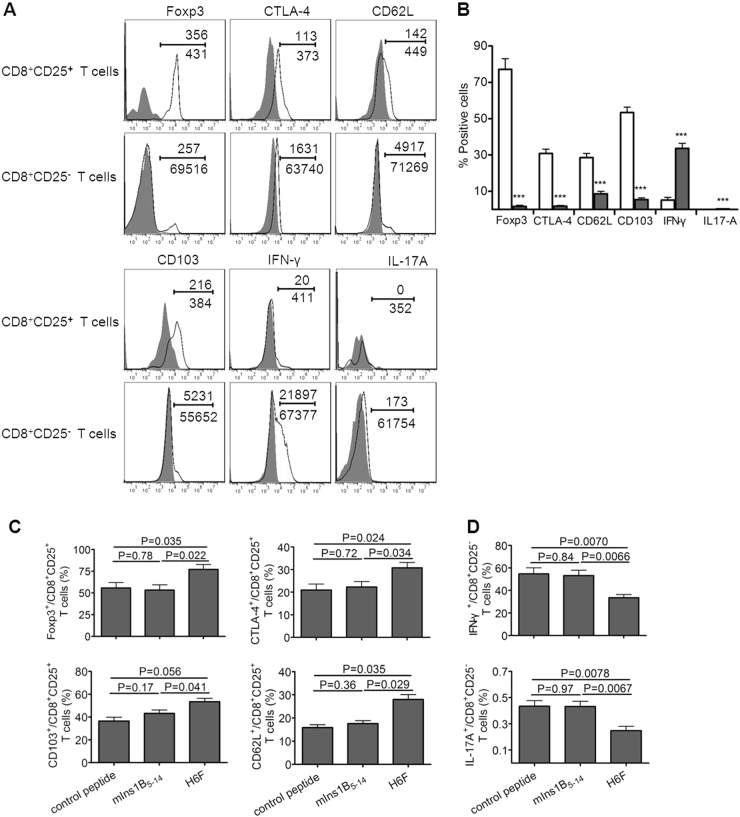
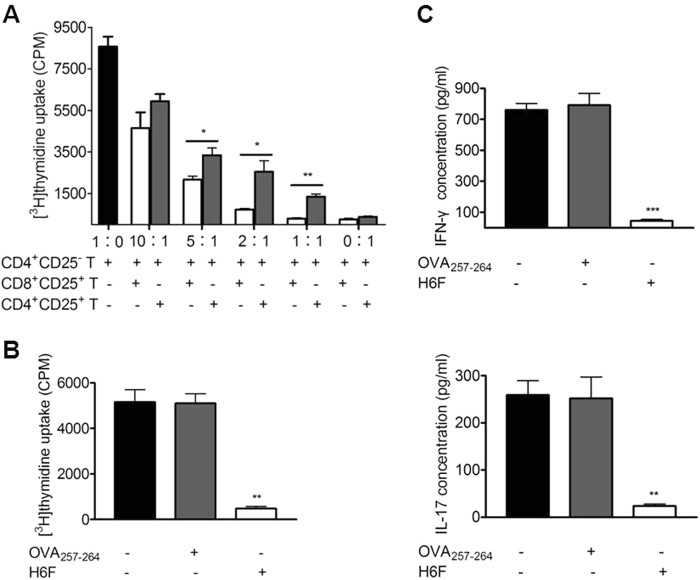
Autoreactive CD8+ T cells, which play an indispensable role in β cell destruction, represent an emerging target for the prevention of type 1 diabetes (T1D). Altered peptide ligands (APLs) can efficiently induce antigen-specific T cells anergy, apoptosis or shifts in the immune response. Here, we found that HLA-A*0201-restricted CD8+ T cell responses against a primary β-cell autoantigen insulin epitope InsB15-14 were present in both NOD.β2mnull.HHD NOD mice and T1D patients. We generated several APL candidates for InsB15-14 by residue substitution at the p6 position. Only H6F exhibited an inhibitory effect on mInsB15-14-specific CD8+ T cell responses in vitro. H6F treatment significantly reduced the T1D incidence, which was accompanied by diminished autoreactive CD8+ T cell responses to mInsB15-14, inhibited infiltration of CD8+ and CD4+ T cells in the pancreas and reduced pro-inflammatory cytokine production in pancreatic and splenic T cells in NOD.β2mnull.HHD mice. Mechanistically, H6F treatment significantly augmented a tiny portion of CD8+CD25+Foxp3+ T cells in the spleen and especially in the pancreas. This subset exhibited typical Treg phenotypes and required peptide-specific restimulation to exert immunosuppressive activity. Therefore, this APL H6F may be a promising candidate with potential clinical application value for antigen-specific prevention of T1D.

Keywords: Altered peptide ligand; CD8+CD25+Foxp3+ regulatory T cells; InsB15–14; NOD.β2m null .HHD mice; Type 1 diabetes.


Conflict of interest statement

The authors declare no competing interests.

Figures

Fig. 1
Fig. 1
Design and selection of a potential antagonist peptide for mIns1B5–14. a The modeled structure of the mIns1B5–14-HLA-A*0201 complex showing that the p5 and p6 positions of mIns1B5–14 bulged out of the binding groove, which were more accessible for TCR inspection. b T2 cell-based peptide binding assays for HLA-A*0201 were performed by FACS analysis. T2 cells were incubated with or without the indicated peptides (10 μg/ml) and the level of surface HLA-A2 molecules was detected by flow cytometry. The H-2Kb-binding peptide OVA257-264 was used as a negative control. Filled histograms, no peptide; open histograms, plus peptide. c The fluorescence index (FI) was calculated as follows: FI = (mean fluorescence intensity with the given peptide―mean fluorescence intensity without peptide)/(mean fluorescence intensity without peptide). Bars represent the mean ± SEM of three independent experiments. d, e The proliferation of splenocytes stimulated with mIns1B5–14 (10 μg/ml) plus itself (10 μg/ml) or the indicated APLs (10 μg/ml) (d) and H6F at four different concentrations (e) was measured by [3H] thymidine incorporation. Bars represent the mean ± SEM of seven independent experiments. Significance was determined by an unpaired t-test
Fig. 2
Fig. 2
Intraperitoneal immunization with the APL H6F prevented the onset of T1D in NOD.β2mnull.HDD mice. Female NOD.β2mnull.HHD mice received weekly intraperitoneal injections of 100 μg of peptide H6F, mIns1B5-14, or OVA257-264 from 4 to 9 weeks of age (n = 12 or 13). a The mice were monitored for diabetes development. Data were obtained from three independent experiments. *P < 0.05 and ** P < 0.01. b, c Histopathological evaluation of pancreatic sections from indicated peptide-treated NOD.β2mnull.HHD mice at the age of 12 weeks. Pancreatic sections were stained with H&E and scored for insulitis. Representative micrographs (200× magnification) (b) and histologic scores (c) from each group (n = 10) are shown. Insulitis scoring was performed according to the following criteria: 0, no infiltration; 1, peri-insulitis; 2, insulitis with <50% islet area infiltration; and 3, insulitis with >50% islet area infiltration. d Frequencies and absolute numbers of CD4+ and CD8+ T cells (pre-gated on a live CD3+ population) infiltrated in pancreata from the indicated peptide-treated NOD.β2mnull.HHD mice at the age of 12 weeks. The results for absolute numbers of these CD4+ and CD8+ T cells are expressed as the mean ± SD (each symbol represents a sample of pooled pancreatic infiltrating cells from four mice). e The mRNA expression levels of indicated cytokines in the pancreas in each peptide-treated group of nondiabetic mice (n = 6) were quantified by real-time RT-PCR. The data are presented as fold-change compared to the mRNA levels expressed in pancreata from control peptide-treated mice. Significance was determined by an unpaired t-test
Fig. 3
Fig. 3
Treatment with H6F notably reduced IFN-γ and IL-17 secretion by splenic T cells in the NOD.β2mnull.HDD mice. The percentages of CD4+IFN-γ+ (a), CD8+IFN-γ+ (b), CD4+IL-17A+ (c), and CD8+IL-17A+ (d) T cells in spleens from the indicated peptide-treated nondiabetic NOD.β2mnull.HHD mice at 12 weeks of age (n = 8) were determined by flow cytometry. Representative FACS density plots and statistical analyses are shown. The data are expressed as the mean ± SD. Significance was determined by an unpaired t-test
Fig. 4
Fig. 4
Treatment with H6F resulted in loss of mIns1B5–14 autoreactive CD8+ T cell responses. a Representative statistical analysis of the average number of IFN-γ-positive spots derived from splenic CD8+ T cell responses to control peptide or mIns1B5-14 within a treatment group (n = 5) are shown. The data are expressed as the mean ± SEM. Significance was determined by a paired t-test. b A representative image of IFN-γ ELISPOT assay for monitoring mIns1B5-14-specific splenic CD8+ T cell responses in each peptide-treated group of nondiabetic NOD.β2mnull.HHD mice at the age of 12 weeks. The average number of IFN-γ-positive spots per 2 × 105 splenic CD8+ T cells in triplicate cultures was calculated. T2 cells pulsed with mIns1B5-14 or control peptide (50 µg/ml) were used as stimulators
Fig. 5
Fig. 5
Treatment with H6F notably increased the frequency of CD8+CD25+Foxp3+ T cells in NOD.β2mnull.HHD mice. Spleen-, pancreatic lymph node (PLN)-, inguinal lymph node (ILN)- and pancreas-infiltrating (PIL) cells were freshly isolated from the indicated peptide-treated nondiabetic NOD.β2mnull.HHD mice at the age of 12 weeks (n = 8–16). a The percentages of CD8+CD25+ T cells and CD8+CD25+Foxp3+ T cells in the spleen and PLNs were determined by flow cytometry. The data are expressed as the mean ± SD. b Comparison of the frequencies of CD8+CD25+ and CD8+CD25+Foxp3+ T cells in ILNs, PLNs, and spleens from H6F-treated nondiabetic NOD.β2mnull.HHD mice (n = 8). The data are expressed as the mean ± SD. c Representative FACS plots showing the frequencies of CD8+CD25+ and CD8+CD25+Foxp3+ T cells among PIL cells pooled from four nondiabetic NOD.β2mnull.HHD mice with the indicated peptide treatments. d Comparison of the frequencies of CD8+CD25+Foxp3+ T cells among PIL cells and PLNs from the same group of NOD.β2mnull.HHD mice treated with mIns1B5-14 or H6F (n = 16). The results of the PIL cells are expressed as the mean ± SD (n = 4, each sample derived from pooled pancreatic infiltrating cells from four mice), and the PLN results are expressed as the mean ± SD (n = 16). Significance was determined by the Mann–Whitney test
Fig. 6
Fig. 6
Phenotypic characterization of CD8+CD25+ T cells in the NOD.β2mnull.HHD mice. CD8+CD25+ and CD8+CD25 T cells were freshly isolated from the spleens of H6F-treated nondiabetic NOD.β2mnull.HHD mice at the age of 12 weeks (n = 5) and these cells were phenotyped by flow cytometry analysis. a Representative flow cytometry phenotypic profiles of CD8+CD25+ and CD8+CD25- T cells in H6F-treated NOD.β2mnull.HHD mice. The numbers above the line indicate the event numbers of cells with a positive phenotype in the indicated cell subsets, and the numbers below the line indicate the total numbers of the indicated CD8+CD25+ T cells or CD8+CD25- T cells. b The mean percentages of Foxp3+, CTLA-4+, CD62L+, CD103+, IFN-γ+ and IL-17A+ in CD8+CD25+ (open bars) or CD8+CD25- (gray bars) T cells from H6F-treated NOD.β2mnull.HHD mice (n = 5). ***Compared to the same phenotype or cytokine production of CD8+CD25+ T cells, P < 0.001. The data are expressed as the mean ± SD. c The mean percentages of Foxp3+, CTLA-4+, CD103+, and CD62L+ in splenic CD8+CD25+ T cells or d the mean percentages of IFN-γ+ and IL-17A+ in splenic CD8+CD25- T cells isolated from different peptide-treated NOD.β2mnull.HHD mice (n = 5). The data are expressed as the mean ± SD. Significance was determined by an unpaired t-test
Fig. 7
Fig. 7
Splenic CD8+CD25+ T cells in the H6F-treated NOD.β2mnull.HHD mice exerted ligand-specific suppressive activity. a Suppression of CD4+CD25- T cell proliferation by splenic CD8+CD25+ T cells or CD4+CD25+ T cells. CD4+CD25- T cells (100,000 cells/well) were co-cultured in triplicate with varied numbers of CD8+CD25+ (open bars) or CD4+CD25+ (gray bars) T cells isolated from the same H6F-treated mice at 1∶0, 10∶1, 5∶1, 2∶1, 1∶1 and 0∶1 ratios in the presence of anti-CD3/CD28-coupled beads for 3 days. *P < 0.05 and **P < 0.01 compared with the [3H] thymidine uptake of CD4+CD25- T cells alone. b The proliferation of pre-activated CD4+CD25- T cells (50,000 cells/well) cocultured with mitomycin C-treated syngeneic splenocytes (250,000 cells/well) loaded with 10 μg/ml OVA257-264 (gray bars), 10 μg /ml H6F (open bars), or no peptide (black bar) in the presence of an equal number of CD8+CD25+ T cells purified from the spleens of H6F-treated NOD.β2mnull.HHD mice. **P < 0.01 compared with the [3H] thymidine uptake of CD4+CD25- T cells cocultured with mitomycin C-treated syngeneic splenocytes alone. c IFN-γ and IL-17A in the cell culture supernatants from (b) were assayed by ELISA. ***P < 0.001 and **P < 0.01 compared with IFN-γ and IL-17A in the cell culture supernatants of CD4+CD25- T cells cocultured with mitomycin C-treated syngeneic splenocytes alone. The data are presented as the mean of triplicate cultures and are representative of three independent experiments. Significance was determined by an unpaired t-test

Similar articles

Cited by

References

    1. Zheng Y, Wang Z, Zhou Z. miRNAs: novel regulators of autoimmunity-mediated pancreatic β-cell destruction in type 1 diabetes. Cell Mol. Immunol. 2017;14:488–496. doi: 10.1038/cmi.2017.7. - DOI - PMC - PubMed
    1. Serreze DV, Leiter EH, Christianson GJ, Greiner D, Roopenian DC. Major histocompatibility complex class I-deficient NOD-β2mnull mice are diabetes and insulitis resistant. Diabetes. 1994;43:505–509. doi: 10.2337/diab.43.3.505. - DOI - PubMed
    1. Christianson SW, Shultz LD, Leiter EH. Adoptive transfer of diabetes into immunodeficient NOD-scid/scid mice. Relative contributions of CD4+ and CD8+ T-cells from diabetic versus prediabetic NOD.NON-Thy-1a donors. Diabetes. 1993;42:44–55. doi: 10.2337/diab.42.1.44. - DOI - PubMed
    1. Standifer NE, et al. Identification of Novel HLA-A*0201-restricted epitopes in recent-onset type 1 diabetic subjects and antibody-positive relatives. Diabetes. 2006;55:3061–3067. doi: 10.2337/db06-0066. - DOI - PubMed
    1. Pinkse GG, et al. Autoreactive CD8 T cells associated with beta cell destruction in type 1 diabetes. Proc. Natl Acad. Sci. USA. 2005;102:18425–18430. doi: 10.1073/pnas.0508621102. - DOI - PMC - PubMed

Publication types

MeSH terms