. 2018 Jul;50(7):937-943.
doi: 10.1038/s41588-018-0155-3. Epub 2018 Jun 28.

Genome-scale analysis identifies paralog lethality as a vulnerability of chromosome 1p loss in cancer

Affiliations

Genome-scale analysis identifies paralog lethality as a vulnerability of chromosome 1p loss in cancer

Srinivas R Viswanathan et al. Nat Genet. 2018 Jul.

Abstract

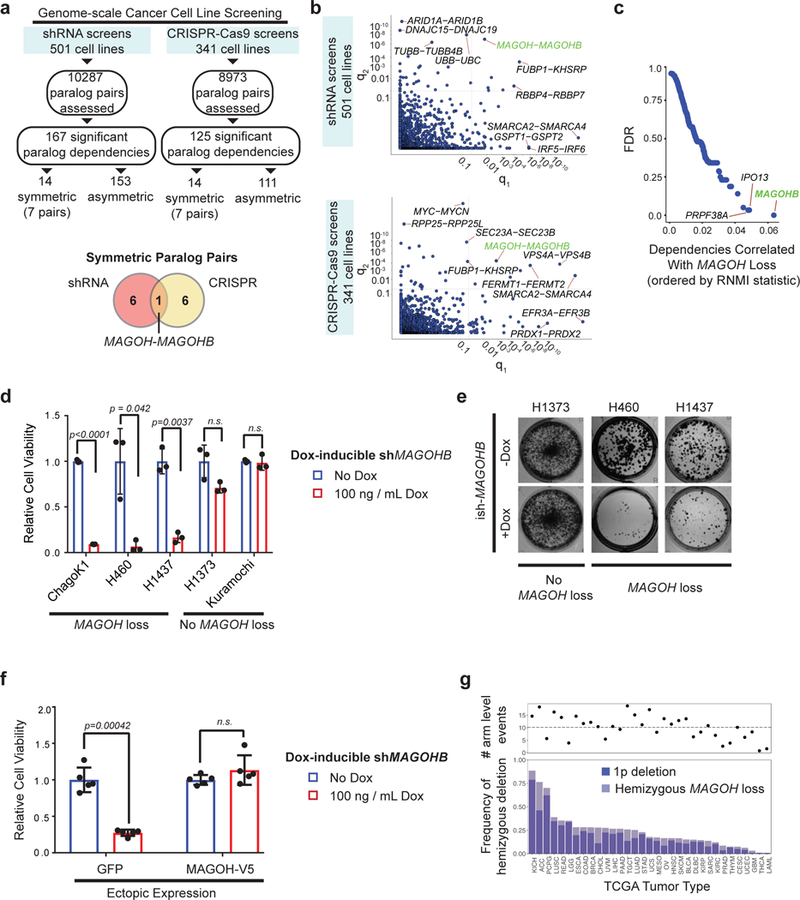
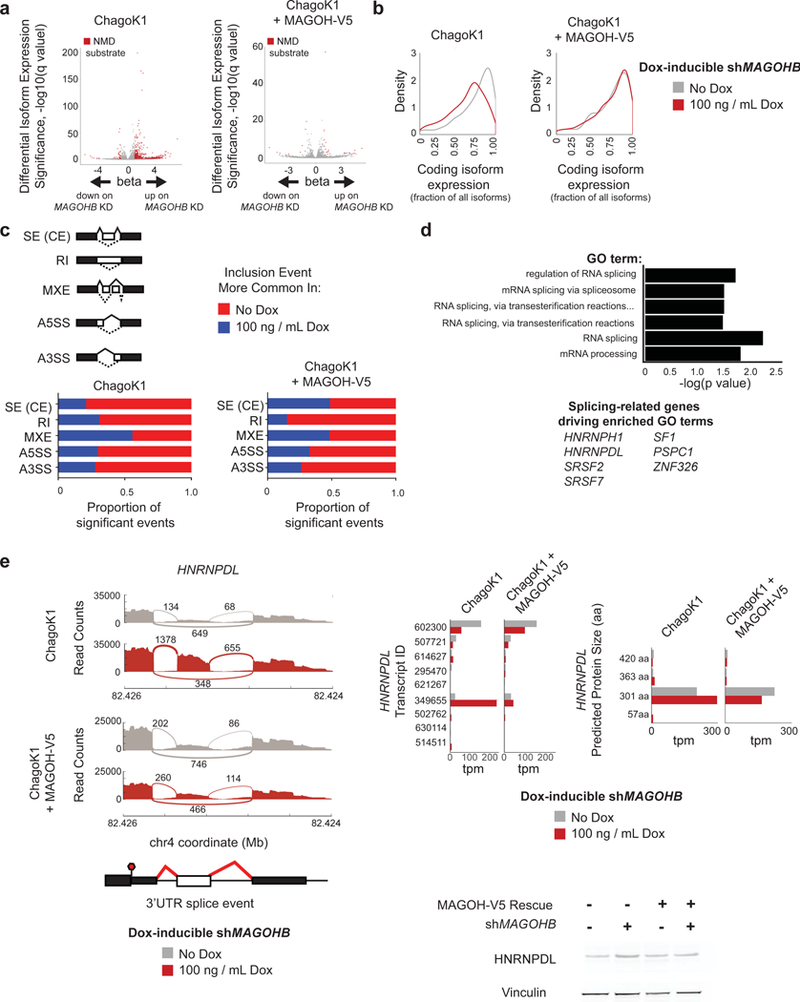
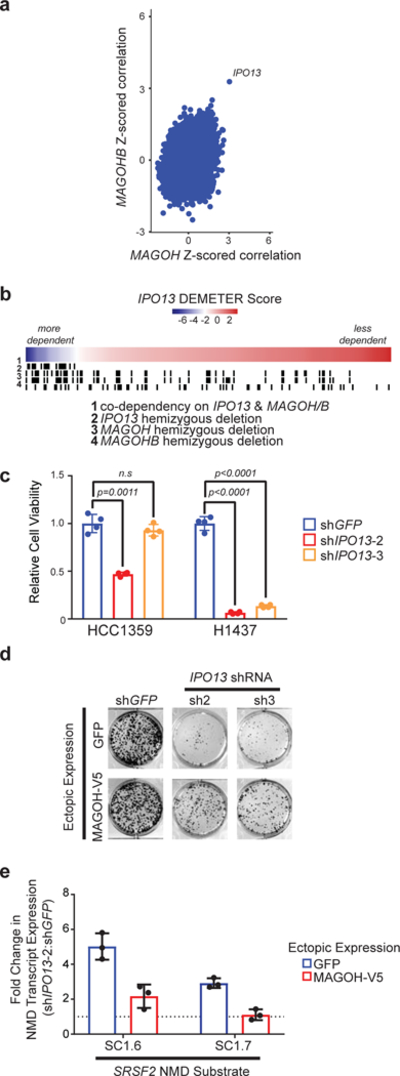
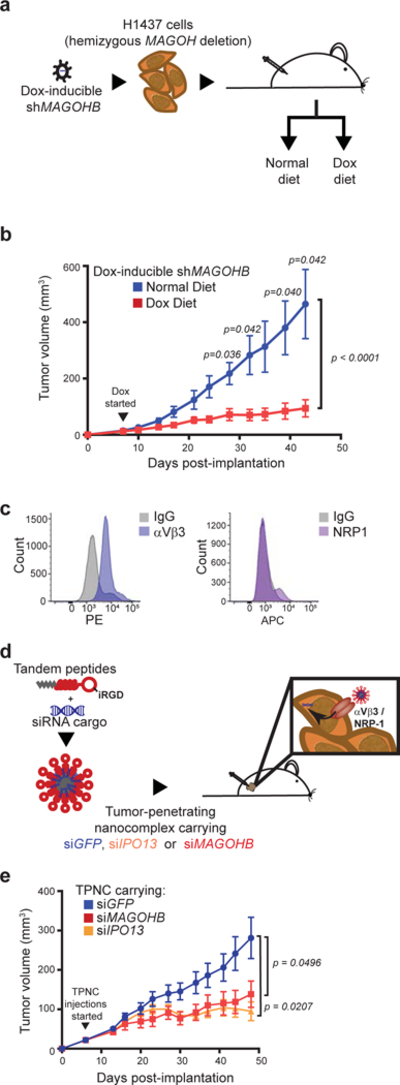
Functional redundancy shared by paralog genes may afford protection against genetic perturbations, but it can also result in genetic vulnerabilities due to mutual interdependency1-5. Here, we surveyed genome-scale short hairpin RNA and CRISPR screening data on hundreds of cancer cell lines and identified MAGOH and MAGOHB, core members of the splicing-dependent exon junction complex, as top-ranked paralog dependencies6-8. MAGOHB is the top gene dependency in cells with hemizygous MAGOH deletion, a pervasive genetic event that frequently occurs due to chromosome 1p loss. Inhibition of MAGOHB in a MAGOH-deleted context compromises viability by globally perturbing alternative splicing and RNA surveillance. Dependency on IPO13, an importin-β receptor that mediates nuclear import of the MAGOH/B-Y14 heterodimer9, is highly correlated with dependency on both MAGOH and MAGOHB. Both MAGOHB and IPO13 represent dependencies in murine xenografts with hemizygous MAGOH deletion. Our results identify MAGOH and MAGOHB as reciprocal paralog dependencies across cancer types and suggest a rationale for targeting the MAGOHB-IPO13 axis in cancers with chromosome 1p deletion.


Figures

Figure 1.
Figure 1.. Hemizygous MAGOH deletion confers MAGOHB dependency.
(a) Analysis of paralog dependencies in genome-scale screening of cancer cell lines (shRNA, 501 lines; CRISPR-Cas9, 341 lines). (b) q-value:q-value plot showing significance of pairwise correlation between a gene’s dependency score and inactivation of its paralog. q-value 1, significance for dependency on the paralog labeled first with inactivation of the paralog labeled second. q-value 2, significance for dependency on the paralog labeled second with inactivation of the paralog labeled first. “Symmetric” paralogs are in upper right quadrant (q1 < 0.05 and q2 < 0.05). Plots show n=1970 paralog pairs for shRNA data and n=1593 pairs for CRISPR data. One-sided p-value from two class comparison was calculated via moderated t-statistic and adjusted for multiple comparisons using the Benjamini-Hochberg false-discovery rate (FDR). (c) Probability Analysis by Ranked Information Score (PARIS) analysis to identify gene dependencies correlated with hemizygous MAGOH loss. Mutual information metric (RNMI) is plotted against FDR for gene dependencies positively correlated with MAGOH deletion. (d) Frequency of hemizygous MAGOH deletion across TCGA cohorts. Total frequency of MAGOH loss is indicated by a light blue bar; frequency of MAGOH loss occurring as a result of chromosome 1p deletion is indicated by a dark blue bar. Top panel shows total number of arm level copy number events in each tumor type. (e) Cell viability in cell lines with (left) and without (right) hemizygous MAGOH loss upon MAGOHB suppression using a doxycycline-inducible shRNA against MAGOHB. Error bars show mean +/− s.d., n=3 replicates from a representative experiment repeated at least twice in each cell line; p-value by two-tailed, two-sample t-test. (f) Colony formation in cell lines with (H1437, H460) or without (H1373) hemizygous MAGOH loss upon MAGOHB suppression using a doxycycline-inducible shRNA against MAGOHB. Photographs show representative wells from an experiment conducted in triplicate (quantification in Supplementary Figure 4); experiment was repeated at least twice in each cell line (g) Cell viability measured upon MAGOHB knockdown in ChagoK1 cells with or without reconstitution of MAGOH-V5. Error bars show mean +/− s.d., n=5 replicates from a representative experiment repeated at least twice; p-value by two-tailed, two-sample t-test
Figure 2.
Figure 2.. RNA splicing is globally altered upon MAGOHB suppression in cells with MAGOH loss, leading to the upregulation of NMD substrates.
(a) Differentially expressed transcripts in ChagoK1 cells (left) and in MAGOH-reconstituted ChagoK1 cells upon MAGOHB knockdown (right). Transcripts annotated as NMD substrates shown in red. Significance determined by a Wald test and adjusted for multiple comparisons using the Benjamini-Hochberg FDR. n=3 replicates were used in all conditions. (b) Density distribution of proportional expression levels among coding isoforms corresponding to genes whose NMD isoforms are upregulated upon MAGOHB knockdown in ChagoK1 cells (left) or MAGOH-reconstituted ChagoK1 cells (right). X-axis shows expression level of coding isoform(s) proportional to all expressed transcripts for a given gene; Y-axis shows density. (c) Global changes in patterns of splice site usage upon MAGOHB knockdown in ChagoK1 cells (left) or MAGOH-V5 reconstituted ChagoK1 cells (right). Splice event classes are shown in the schematic; solid lines denote “inclusion” event and dotted lines denote the alternative event for each class. Bar graphs denote the proportion of significant differentially spliced events that show greater inclusion in either the absence (red) or presence (blue) of MAGOHB knockdown in either ChagoK1 cells (left) or MAGOH-V5 reconstituted ChagoK1 cells (right). (d) Significantly enriched Gene Ontology classes for genes (n=17) that show upregulation of NMD isoform(s) and concomitant downregulation of coding isoform(s). Significance was determined by a binomial test and adjusted for multiple comparisons using the Bonferroni correction. (e) left) Sashimi plots around an activated exon within the 3’UTR of the HNRNPDL gene (inclusion of which creates an NMD-substrate transcript) in either the absence or presence of MAGOHB knockdown in either ChagoK1 cells or MAGOH-V5 reconstituted ChagoK1 cells. Numbers reflect junction spanning reads averaged over three replicates for each condition. right, top) Left panel, Transcript abundances for various isoforms of the HNRNPDL gene in either the absence (grey) or presence (red) of MAGOHB knockdown in either ChagoK1 cells or MAGOH-V5 reconstituted ChagoK1 cells. Right panel, isoform abundances grouped by predicted coding protein length in each condition. right, bottom) Western blot showing increased HNRNPDL protein levels upon MAGOHB knockdown in ChagoK1 cells but not MAGOH-V5 reconstituted ChagoK1 cells. Representative of a similar experiment repeated three times.
Figure 3.
Figure 3.. IPO13 dependency is correlated with MAGOH and MAGOHB dependencies and is rescued by MAGOH reconstitution.
(a) Plot of gene dependencies (n=6300) correlated to MAGOH dependency vs. those correlated to MAGOHB dependency. Axes reflect Z-scored Pearson correlation of each dependency to either MAGOH dependency (X-axis) or MAGOHB dependency (Y-axis). MAGOH and MAGOHB self-correlations are not shown. (b) Heatmap of IPO13 dependency scores across 243 screened cell lines. Black bars denote cell lines that share dependency on IPO13 and either MAGOH,MAGOHB, or both (1); cell lines that carry a hemizygous deletion in MAGOH (2); IPO13 (3); MAGOHB (4). (c) Cell viability measured upon shRNA-mediated IPO13 knockdown in cell line without (HCC1359, left) and with (H1437, right) MAGOH loss. Error bars show mean +/− s.d, n=4 replicates per cell line; p-value by two-tailed, two-sample t-test. (d) Colony formation in MAGOH-deleted H460 cells upon IPO13 knockdown in either the absence (top) or presence (bottom) of MAGOH-V5 reconstitution. Photographs show representative wells from an experiment conducted in triplicate (quantification in Supplementary Figure 11); experiment was repeated three times. (e) Fold change in expression of the NMD substrates SC1.6 and SC1.7 of the SRSF2 gene in H460 cells upon IPO13 knockdown (IPO13-sh2) in either the presence (red) or absence (blue) of MAGOH-V5 reconstitution. Data normalized to expression in the shGFP condition. Error bars show mean +/− s.d., n=3 technical replicates per condition.
Figure 4.
Figure 4.. MAGOHB and IPO13 are in vivo dependencies in MAGOH-deleted xenografts.
(a,b) Schematic (a) and growth curves (b) of H1437 xenografts in nude mice upon MAGOHB suppression. H1437 cells were transduced with lentivirus expressing a doxycycline-inducible shRNA against MAGOHB and injected into the flanks of nude mice. Once palpable tumors had formed (7d), mice were randomized to either normal chow or chow supplemented with doxycycline. Tumor volume over time is plotted in each arm. Lines show mean +/− s.e.m for n=6 tumors per arm. p-values listed for significant (<0.05) time points by two-tailed, two-sample t-test; p also < 0.0001 by two-way ANOVA between +Dox and –Dox curves. (c) Surface expression for NRP-1 and αVβ3 (co-receptors for iRGD-containing nanocomplexes) in H1437 cells, as assessed by flow cytometry. Repeated twice with similar results. (d,e) Schematic (d) and growth curves (e) of H1437 xenografts in nude mice upon MAGOHB or IPO13 suppression using an siRNA-carrying tumor-penetrating nanocomplex (TPNC). Following palpable tumor formation, mice received intra-tumoral injections of TPNC containing either siRNA against GFP (control) MAGOHB, or IPO13. Lines show mean +/− s.e.m. for n=10 tumors per arm; p-value by two-way ANOVA.

Similar articles

Cited by

References

REFERENCES (FOR MAIN TEXT)

    1. Diss G et al. Gene duplication can impart fragility, not robustness, in the yeast protein interaction network. Science 355, 630–634 (2017). - PubMed
    1. Muller FL, Aquilanti EA & DePinho RA Collateral Lethality: A new therapeutic strategy in oncology. Trends Cancer 1, 161–173 (2015). - PMC - PubMed
    1. Frei E Gene deletion: a new target for cancer chemotherapy. The Lancet 342, 662–664 (1993). - PubMed
    1. McDonald ER et al. Project DRIVE: A Compendium of Cancer Dependencies and Synthetic Lethal Relationships Uncovered by Large-Scale, Deep RNAi Screening. Cell 170, 577–592.e10 (2017). - PubMed
    1. Tsherniak A et al. Defining a Cancer Dependency Map. Cell 170, 564–576.e16 (2017). - PMC - PubMed

REFERENCES (METHODS ONLY)

    1. Yang X et al. A public genome-scale lentiviral expression library of human ORFs. Nat. Methods 8, 659–661 (2011). - PMC - PubMed
    1. Lippa MS et al. Expression of anti-apoptotic factors modulates Apo2L/TRAIL resistance in colon carcinoma cells. Apoptosis Int. J. Program. Cell Death 12, 1465–1478 (2007). - PubMed
    1. Brown CY et al. Robust, reversible gene knockdown using a single lentiviral short hairpin RNA vector. Hum. Gene Ther. 21, 1005–1017 (2010). - PubMed
    1. Root DE, Hacohen N, Hahn WC, Lander ES & Sabatini DM Genome-scale loss-of-function screening with a lentiviral RNAi library. Nat. Methods 3, 715–719 (2006). - PubMed
    1. Kwon EJ, Dudani JS & Bhatia SN Ultrasensitive tumour-penetrating nanosensors of protease activity. Nat. Biomed. Eng. 1, 0054 (2017). - PMC - PubMed

Publication types