Meta-Analysis
. 2018 Jul;50(7):956-967.
doi: 10.1038/s41588-018-0154-4. Epub 2018 Jun 28.

Using an atlas of gene regulation across 44 human tissues to inform complex disease- and trait-associated variation

Affiliations
Meta-Analysis

Using an atlas of gene regulation across 44 human tissues to inform complex disease- and trait-associated variation

Eric R Gamazon et al. Nat Genet. 2018 Jul.

Abstract

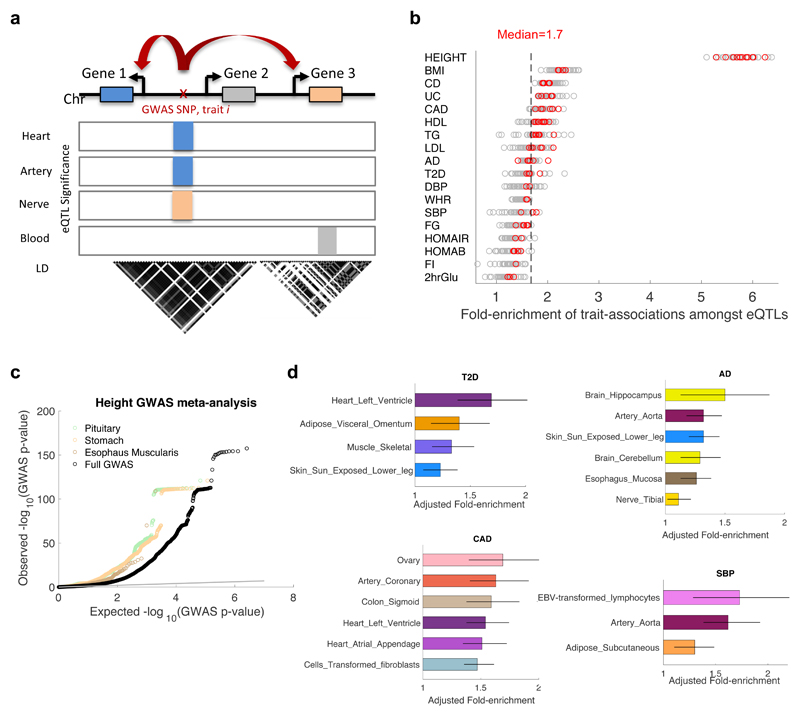
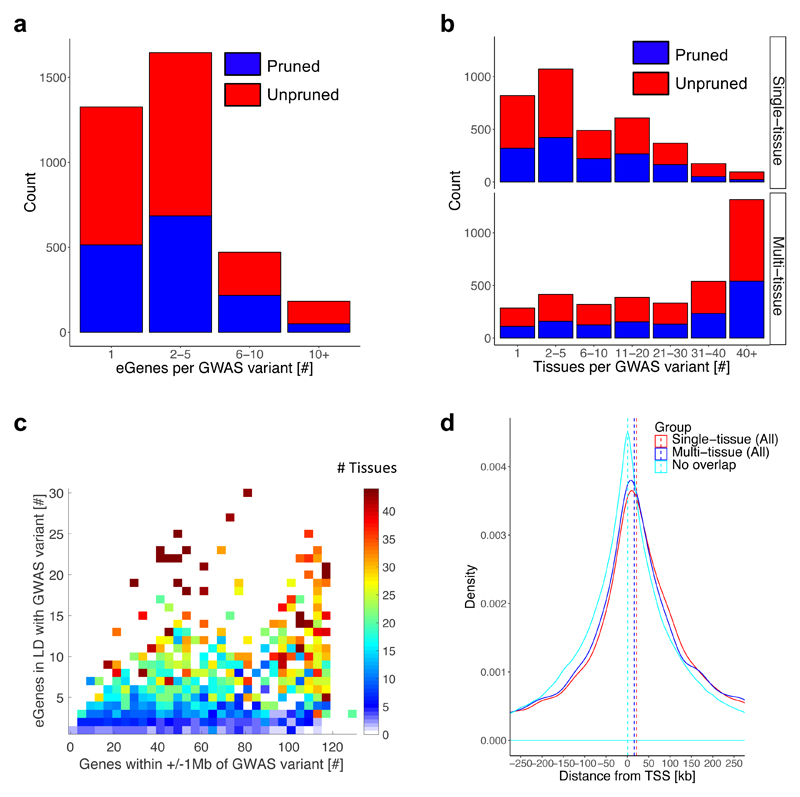
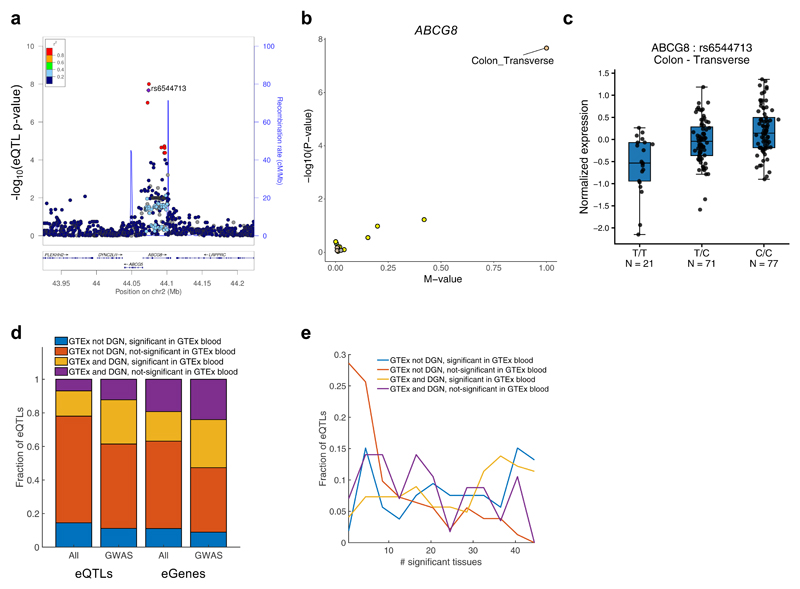
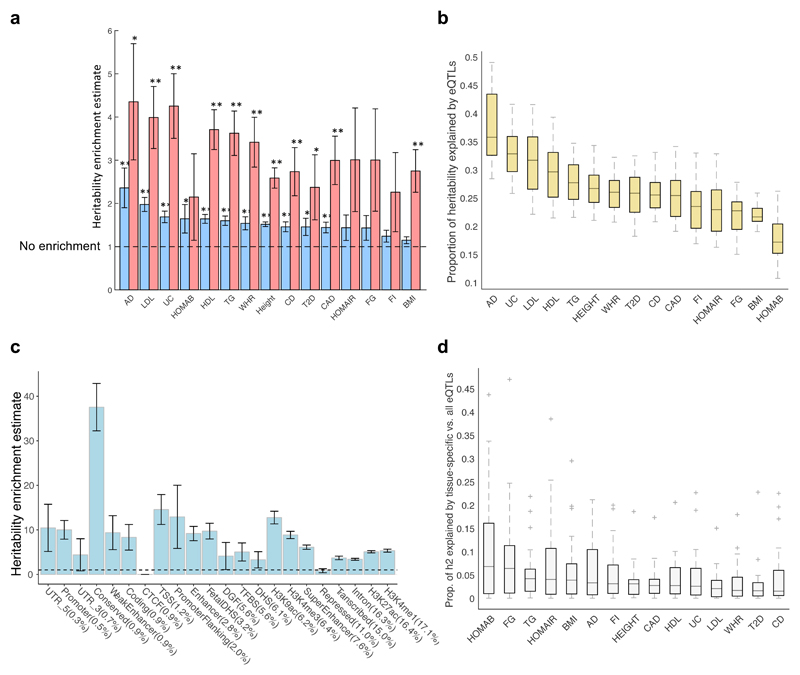
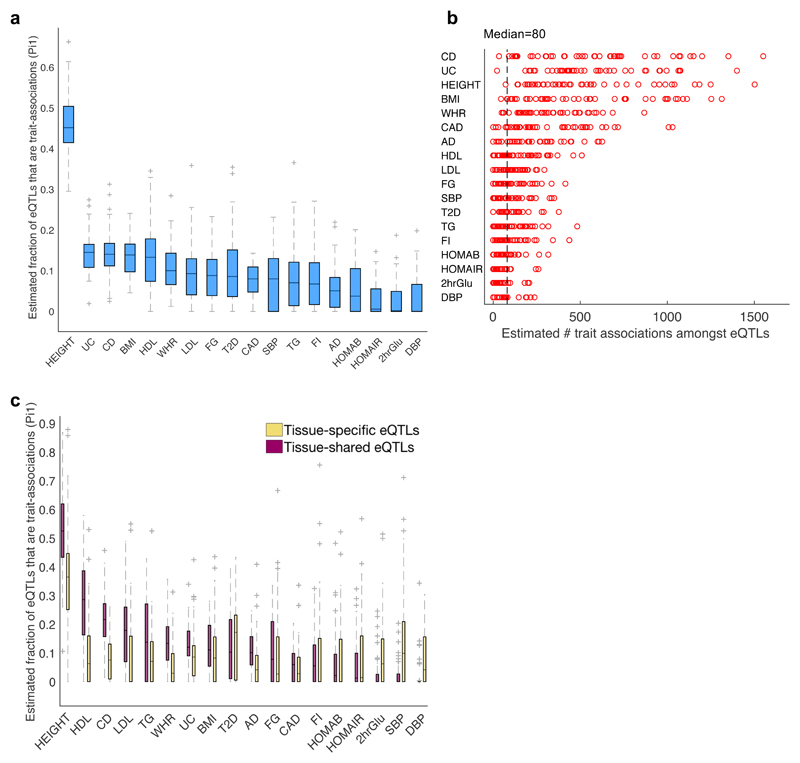
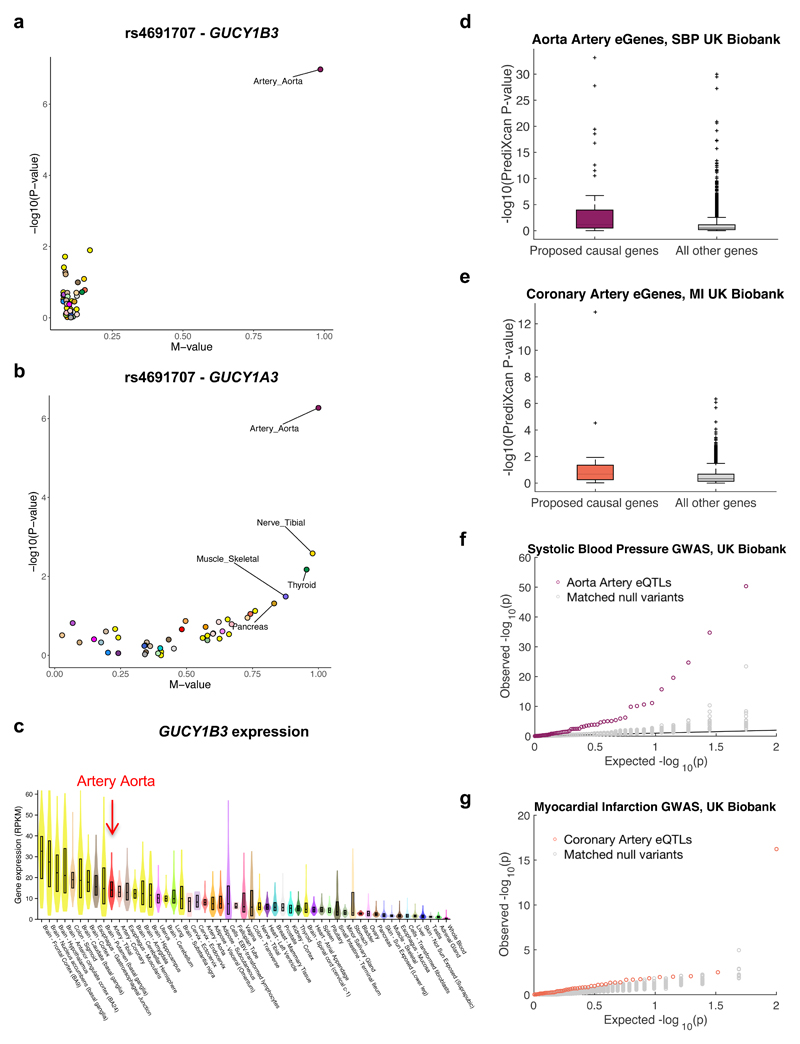
We apply integrative approaches to expression quantitative loci (eQTLs) from 44 tissues from the Genotype-Tissue Expression project and genome-wide association study data. About 60% of known trait-associated loci are in linkage disequilibrium with a cis-eQTL, over half of which were not found in previous large-scale whole blood studies. Applying polygenic analyses to metabolic, cardiovascular, anthropometric, autoimmune, and neurodegenerative traits, we find that eQTLs are significantly enriched for trait associations in relevant pathogenic tissues and explain a substantial proportion of the heritability (40-80%). For most traits, tissue-shared eQTLs underlie a greater proportion of trait associations, although tissue-specific eQTLs have a greater contribution to some traits, such as blood pressure. By integrating information from biological pathways with eQTL target genes and applying a gene-based approach, we validate previously implicated causal genes and pathways, and propose new variant and gene associations for several complex traits, which we replicate in the UK BioBank and BioVU.


Conflict of interest statement

Competing Interests

M.I.McC serves on advisory panels for Pfizer and NovoNordisk. He has received honoraria from Pfizer, NovoNordisk, Sanofi-Aventis and Eli-Lilly, and research funding from Pfizer, Eli-Lilly, Merck, Takeda, Sanofi Aventis, Astra Zeneca, NovoNordisk, Servier, Janssen, Boehringer Ingelheim and Roche. M.v.d.B is an employee of Novo Nordisk. H.S.X. and J.Q. are employees of Pfizer.

Figures

Fig. 1
Fig. 1. Incorporating eQTLs from 44 tissues into GWAS of complex traits.
a, Schematic diagram demonstrating how eQTL annotation from various tissues can be used to propose one or more potential causal genes whose regulation is either tissue-specific (orange) or tissue-shared (blue) for a trait-associated (GWAS) variant. A gene close to the trait-associated variant (grey) may have an eQTL that is not in LD with the trait-associated variant. b, Fold-enrichment of eQTLs (FDR≤0.05) with GWAS p≤0.05 compared to a uniform null distribution of GWAS p-values, shown for 44 tissues by 18 complex traits. Red circles: tissue-trait pairs that pass Bonferroni correction (P<6.3x10⁻⁵; 89 out of 792 tissue-trait pairs tested). Dashed line: median fold-enrichment of all significant tissue-trait pairs. The ‘best eQTL per eGene’ set per tissue was used here. c, Quantile-quantile (Q-Q) plot of variant association p-values from a large GWAS meta-analysis of Height (n=253,288) for all variants tested (black), and for eQTLs in tissues most highly enriched for height associations: pituitary (green), stomach (peach), and esophaus muscularis (brown). All significant variant-gene eQTL pairs were plotted. d, Top ranked tissues based on their adjusted fold-enrichment of trait associations amongst eQTLs (compared to the best eQTL for all non-significant eGenes) that pass Bonferonni correction (P<6.3E-05) for type 2 diabetes (T2D, n=69,033), Alzheimer’s disease (AD, n=54,162), coronary artery disease (CAD, n=184,405), and systolic blood pressure (SBP, n=69,395) (Supplementary Table 2). Estimated lower and upper bound 95% confidence intervals for the adjusted fold-enrichment are shown (see Methods).
Fig. 2
Fig. 2. eQTL annotation of variants from GWAS catalog.
a, Distribution of number of target genes for one or more eQTLs (from any of 44 tissues) with which a trait-associated variant is in LD (r2>0.8), considering only protein-coding, antisense and lincRNA genes. All significant variant-gene pairs per eGene from single-tissue analysis were used. Colors of stacked bars denote an LD-pruned threshold at r2>0.1 (blue) or unpruned (red) GWAS catalog variants with association p<5x10⁻⁸. b, Distribution of number of tissues implicated for each of the trait-associated variants in LD (r2>0.8) with at least one eQTL, using either all significant eQTLs per eGene discovered from the single-tissue (top panel) or multi-tissue (bottom panel) analysis. c, Number of eGenes implicated per trait-associated variant based on eQTLs (from 44 tissues) in LD with each trait-associated variant, is shown compared to number of genes within ±1Mb of the GWAS variant. The pruned set of GWAS catalog variants was used. Number of tissues implicated per variant, averaged in bins of 4 along the x-axis, is reflected in blue to red color gradient. d, Distribution of distance of eQTLs to TSS of their target genes in a ±250kb window, shown for eQTLs in LD (r2≥0.8) with a GWAS catalog variant based on single-tissue analysis (red; median distance to TSS: 21kb, interquartile range -66kb to 129kb) or multi-tissue analysis (blue), relative to eQTLs that are not in strong LD (r2<0.8) with any of the GWAS catalog variants (cyan; median distance to TSS: 0.7kb, interquartile range: -87kb to 91kb).
Fig. 3
Fig. 3. Proposing causal genes in inaccessible tissues.
a, LocusZoom plot showing that the lead variant at ABCG5/8 locus for CAD (n=184,405) and LDL cholesterol (n=95,454) (rs6544713; purple diamond) is in LD (r2=0.99), and colocalizes, with an eQTL signal for ABCG8 in transverse colon, using eCAVIAR and RTC. No other gene in the locus was implicated based on LD and colocalization. b, Forest PM-plot of single-tissue eQTL – log10(P-value) against the METASOFT posterior probability, m-value (indicating multitissue support), demonstrating rs6544713-ABCG8 eQTL is specific to transverse colon. c, Box plot showing correlation between rs6544713 and normalized ABCG8 expression in transverse colon, corrected for covariates used in cis-eQTL analysis. Box edges depict interquartile range, whiskers 1.5x the interquartile range, and center lines the median. Minor T-allele, associated with lower expression, is associated with increased CAD risk and higher LDL. d, Fraction of best eQTL per eGenes (‘eQTLs’) or ‘eGenes’ significant in at least one GTEx tissue identified (yellow and purple) or not identified (blue and red) in DGN blood study at FDR≤0.05, further stratified by being significant (FDR≤0.05) (blue and yellow) or non-significant (red and purple) in GTEx blood. We compared all (21,643) eQTLs in GTEx (‘All’) to the subset of eQTLs in LD (r2≥0.8) with a GWAS variant (‘GWAS’; 471 independent trait-associated variants from GWAS catalog). e, Distribution of number of significant tissues per ‘best eQTL per eGene’ (FDR<0.05) sets in LD with GWAS variants, stratified by discovery in DGN (n=922) and being a GTEx blood eQTL (n=338; color-code as in d).
Fig. 4
Fig. 4. Heritability estimates explained by eQTLs in 44 tissues.
a, Heritability enrichment estimates for 15 traits, defined as the proportion of heritability explained by all eQTLs (blue bars) or top 10 significant eQTL variants per eGene (red bars) aggregated across the 44 tissues divided by the fraction of GWAS variants that are eQTLs, using LD score regression analysis (Supplementary Tables 12 and 14). ** Heritability enrichment p-value passes Bonferroni correction, p<0.0017; * Heritability enrichment p<0.05. b, Distribution of proportion of heritability of 15 traits explained by eQTLs in 44 tissues, computed by multi-tissue (METASOFT) analysis (Supplementary Table 16). c, Heritability enrichment estimate computed for subsets of eQTLs that fall in different genomic features taken from , sorted in ascending order by percentage of eQTLs in each functional category shown in brackets. eQTLs from all 44 GTEx tissues based on single-tissue analysis were used. TFBS, transcription factor binding site. DGF, digital genomic footprint. d, Distribution of proportion of heritability explained by eQTLs acting on tissue-specific genes (Methods and Supplementary Table 17) divided by the proportion of heritability explained by all eQTLs (Supplementary Table 16) in each of the 44 tissues, computed by multi-tissue (METASOFT) analysis. All significant variant-gene pairs per eGene were used in all panels. 4a,c show the standard error from the LD score regression method. In 4b,d the boxes depict the interquartile range, whiskers depict 1.5x the interquartile range, center lines show the median, and ‘+’ represent the outliers.
Fig. 5
Fig. 5. Estimated true positive rate of trait associations amongst eQTLs in 44 tissues.
a, Distribution of estimated true positive rate (π1 statistic29) of trait associations (considering the full spectrum of GWAS p-values) amongst eQTLs across 44 tissues shown for 18 complex traits. b, Estimated number of true trait associations that are eQTLs in each of the 44 tissues, computed for 18 complex traits by multiplying π1 by the number of eQTLs analyzed per GWAS. The median number per trait ranges from 0 to 554, with a median of 80 trait associations per tissue-trait pair (dashed line) and a maximum of 1551 for CD. These are lower bound estimates due to incomplete overlap of variants between the GTEx and GWAS studies (see Methods). c, Distribution of estimated true positive rate (π1 statistic) of trait associations amongst tissue-specific eQTLs (yellow; significant in ≤~10% of tissues including the given tissue, based on METASOFT) versus tissue-shared eQTLs (pink; significant in ≥90% of tissues and the given tissue, based on METASOFT) was computed for 44 tissues by 18 traits. The ‘best eQTL per eGene’ set per tissue were used for all π1 analyses (Supplementary Table 19). In 5a,c the boxes depict the interquartile range, whiskers depict 1.5x the interquartile range, center lines show the median, and ‘+’ represent the outliers.
Fig. 6
Fig. 6. Discovery and replication of novel associations and genes.
a, PM-plot of best eQTL for GUCY1B3 in artery aorta (n=197) (rs4691707) showing –log10(P-value) from single-tissue eQTL analysis versus the multi-tissue, m-value. b, rs4691707 is also an eQTL for GUCY1A3, though less specific to artery aorta, being significant (m-value>0.9) also in nerve tibial (n=256) and thyroid (n=278). c, Violin plots of GUCY1B3 expression across 44 tissues. Overlaid boxes indicate interquartile ranges and center-lines the median. Artery aorta is not the top ranked tissue for GUCY1B3 based on expression alone. d-e, Box plots of PrediXcan p-values (-log10) with UK Biobank GWAS for SBP and aorta artery genes (d) and MI and coronary artery genes (e), comparing eGeneEnrich-proposed genes to remaining genes expressed in the corresponding tissues. For both traits, proposed genes show significantly lower p-values, as assessed by Wilcoxon Rank-Sum one-tailed test (P=1.5x10⁻⁷ for d, P=5.8x10⁻⁵ for e). The boxes indicate interquartile ranges, whiskers 1.5x interquartile range, center-lines median values, and ‘+’ represent the outliers. f, Q-Q plot of replication association p-values from UK Biobank GWAS of SBP for artery aorta eQTLs (purple), enriched for SBP associations in a discovery GWAS, compared to 100 null variant sets (gray; empirical P<0.01). g, Q-Q plot of replication association p-values from a UK Biobank GWAS of MI for coronary artery eQTLs (orange), enriched for CAD associations in a discovery GWAS, compared to 100 null variant sets (gray; empirical P<0.01). In 6f,g the eQTLs and null variants have association p<0.05 in the corresponding discovery GWAS.

References

    1. GTEx Consortium. The Genotype-Tissue Expression (GTEx) project. Nat Genet. 2013;45:580–5. - PMC - PubMed
    1. GTEx Consortium. Genetic effects on gene expression across human tissues. Nature. 2017;550:204–213. - PMC - PubMed
    1. Ongen H, Buil A, Brown AA, Dermitzakis ET, Delaneau O. Fast and efficient QTL mapper for thousands of molecular phenotypes. Bioinformatics. 2016;32:1479–85. - PMC - PubMed
    1. Han B, Eskin E. Random-effects model aimed at discovering associations in meta-analysis of genome-wide association studies. Am J Hum Genet. 2011;88:586–98. - PMC - PubMed
    1. Sudlow C, et al. UK biobank: an open access resource for identifying the causes of a wide range of complex diseases of middle and old age. PLoS Med. 2015;12 e1001779. - PMC - PubMed

Publication types