. 2019 Mar:92:135-154.
doi: 10.1016/j.simyco.2018.05.001. Epub 2018 May 30.

Large-scale generation and analysis of filamentous fungal DNA barcodes boosts coverage for kingdom fungi and reveals thresholds for fungal species and higher taxon delimitation

Affiliations

Large-scale generation and analysis of filamentous fungal DNA barcodes boosts coverage for kingdom fungi and reveals thresholds for fungal species and higher taxon delimitation

D Vu et al. Stud Mycol. 2019 Mar.

Abstract

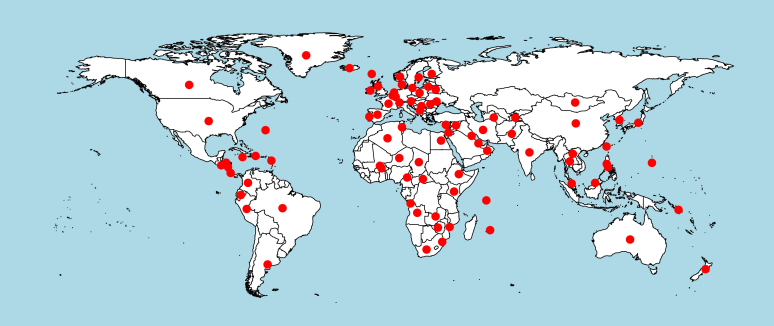
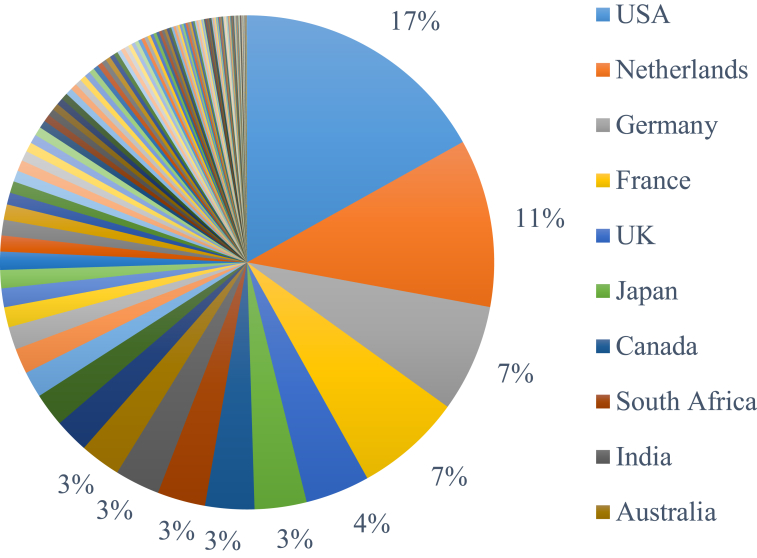
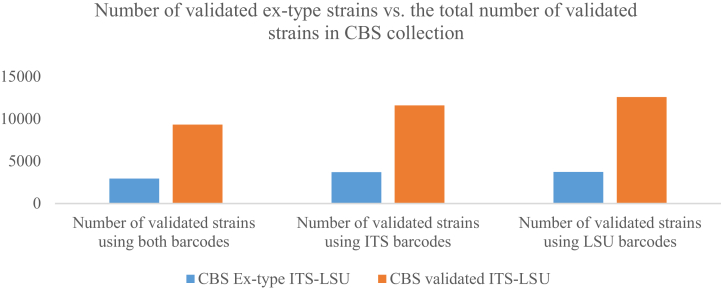
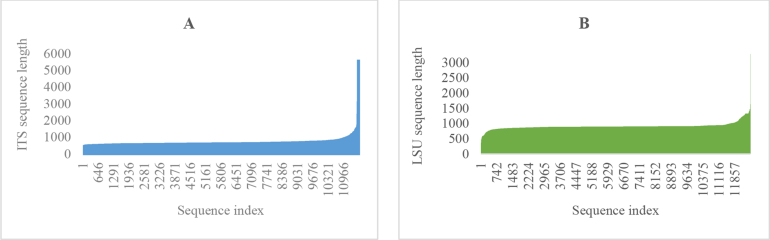
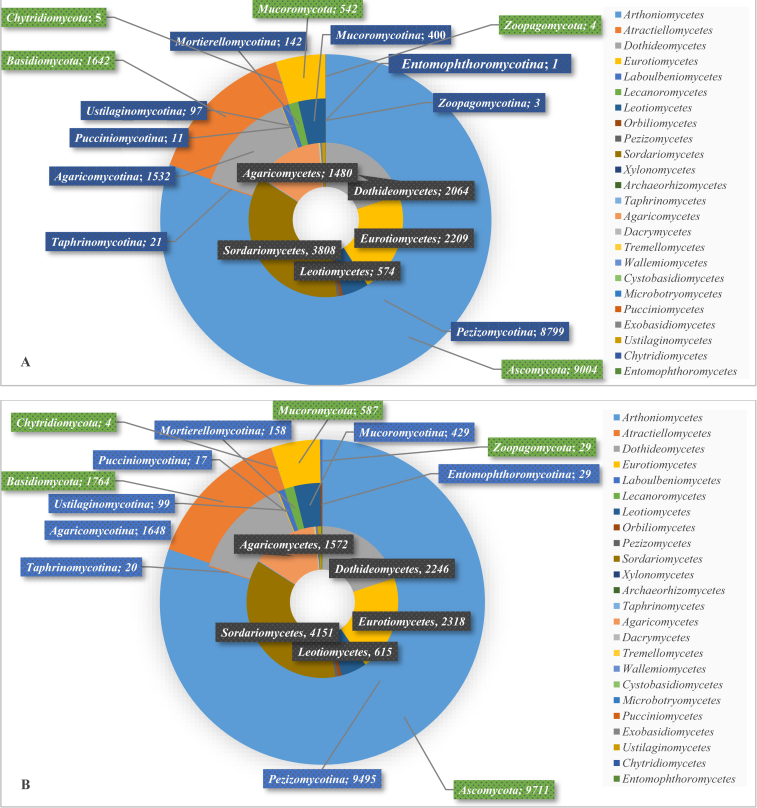
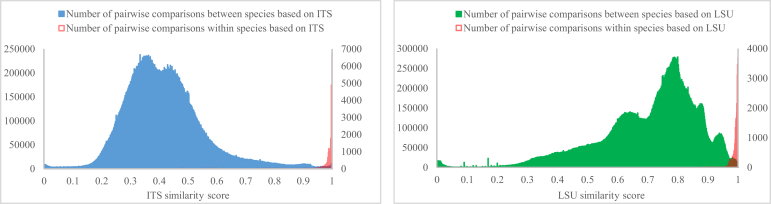
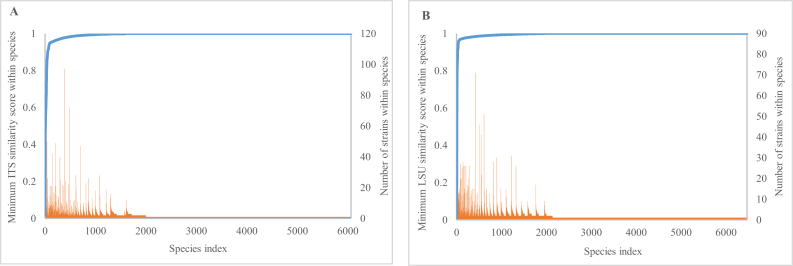
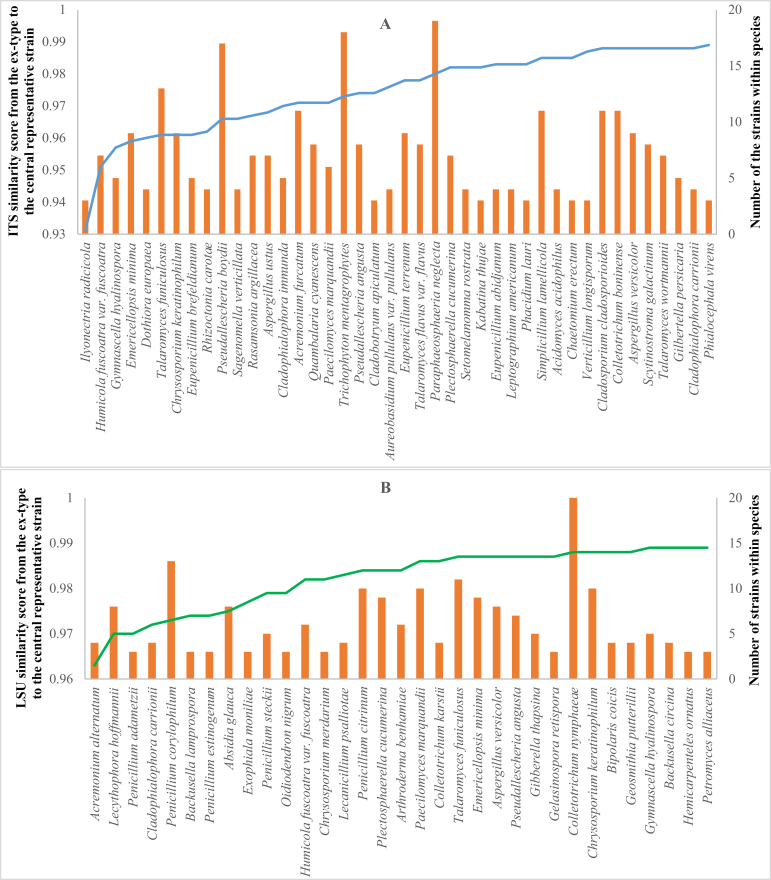
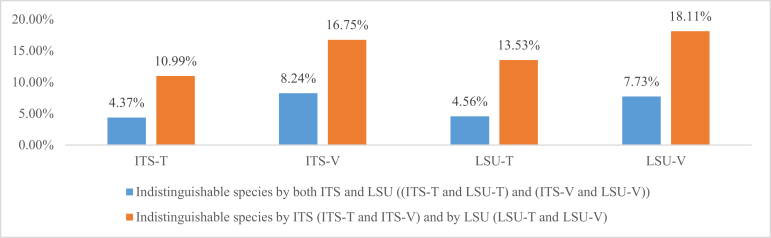
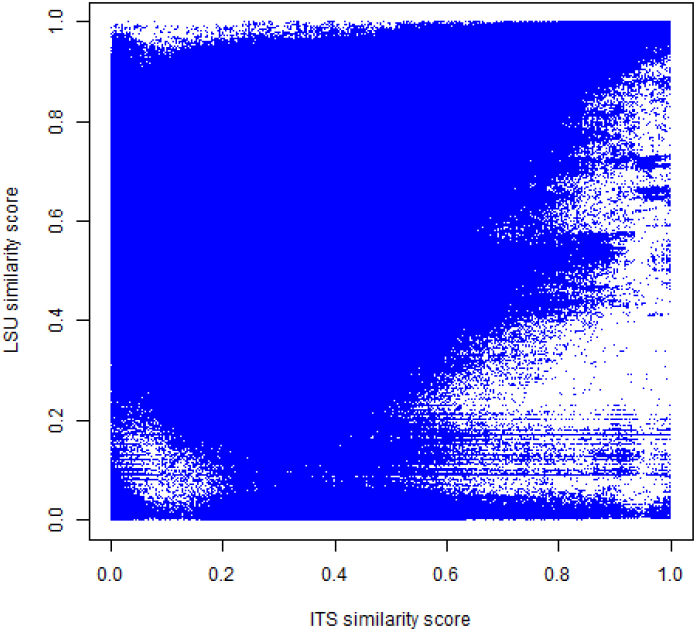
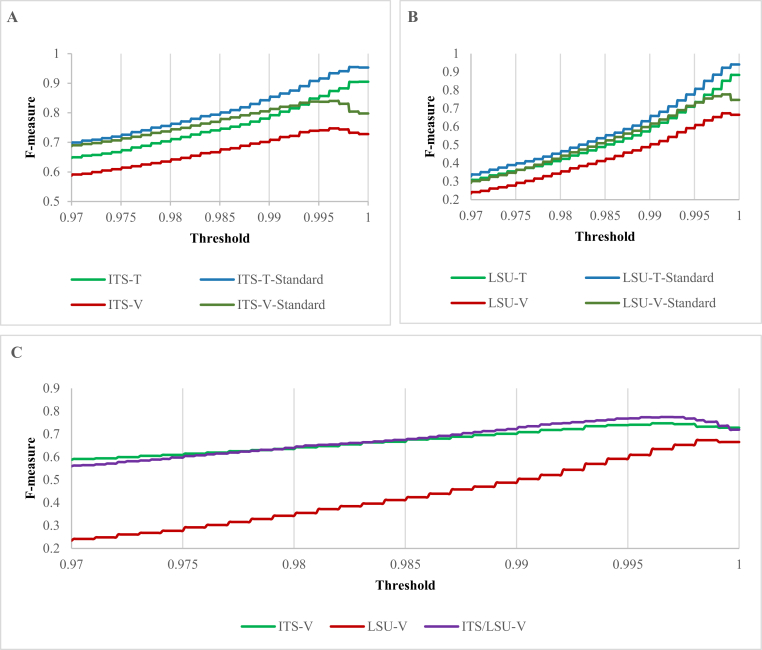
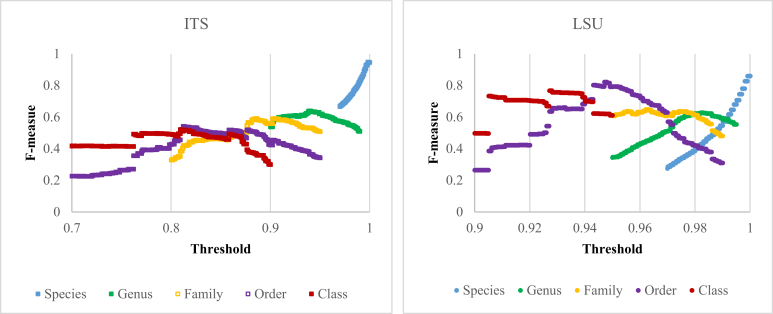
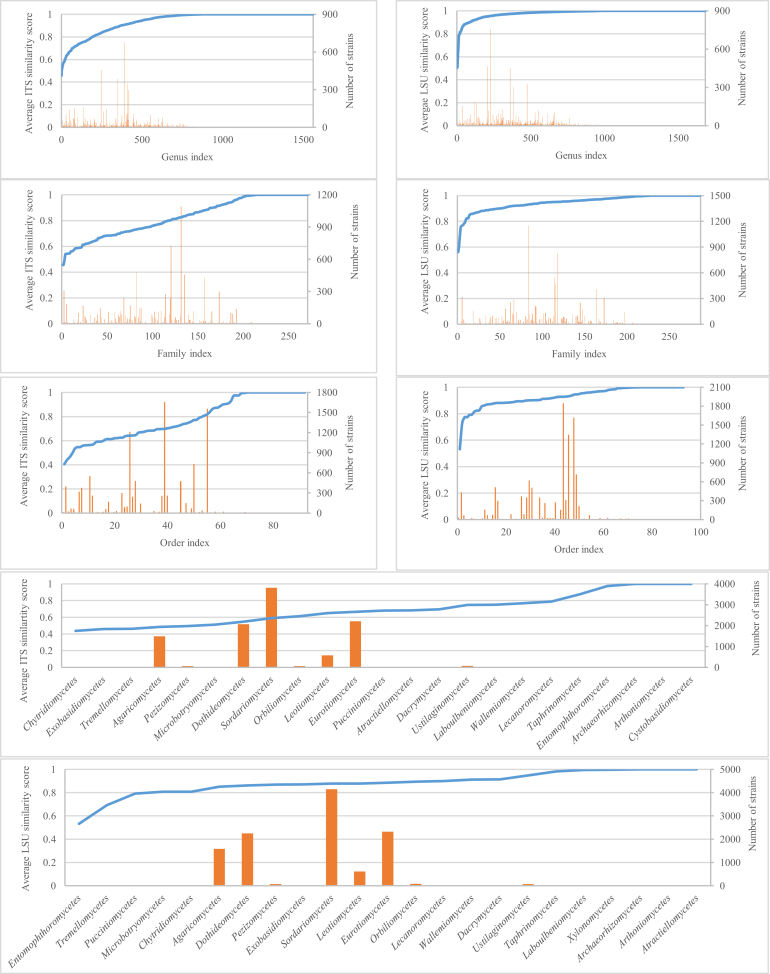
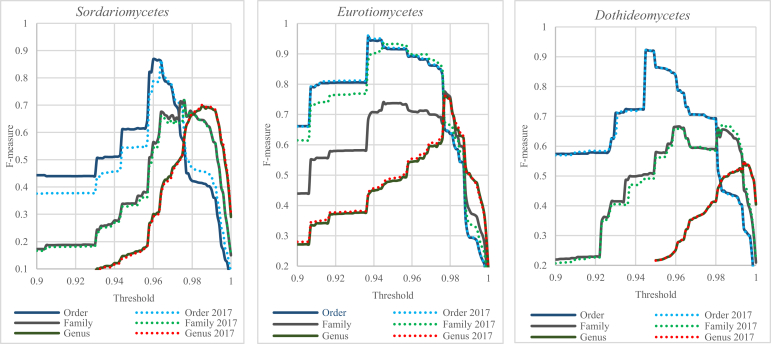
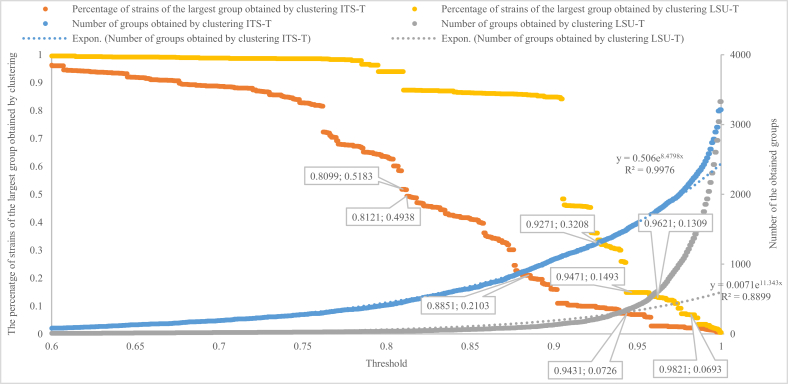
Species identification lies at the heart of biodiversity studies that has in recent years favoured DNA-based approaches. Microbial Biological Resource Centres are a rich source for diverse and high-quality reference materials in microbiology, and yet the strains preserved in these biobanks have been exploited only on a limited scale to generate DNA barcodes. As part of a project funded in the Netherlands to barcode specimens of major national biobanks, sequences of two nuclear ribosomal genetic markers, the Internal Transcribed Spaces and 5.8S gene (ITS) and the D1/D2 domain of the 26S Large Subunit (LSU), were generated as DNA barcode data for ca. 100 000 fungal strains originally assigned to ca. 17 000 species in the CBS fungal biobank maintained at the Westerdijk Fungal Biodiversity Institute, Utrecht. Using more than 24 000 DNA barcode sequences of 12 000 ex-type and manually validated filamentous fungal strains of 7 300 accepted species, the optimal identity thresholds to discriminate filamentous fungal species were predicted as 99.6 % for ITS and 99.8 % for LSU. We showed that 17 % and 18 % of the species could not be discriminated by the ITS and LSU genetic markers, respectively. Among them, ∼8 % were indistinguishable using both genetic markers. ITS has been shown to outperform LSU in filamentous fungal species discrimination with a probability of correct identification of 82 % vs. 77.6 %, and a clustering quality value of 84 % vs. 77.7 %. At higher taxonomic classifications, LSU has been shown to have a better discriminatory power than ITS. With a clustering quality value of 80 %, LSU outperformed ITS in identifying filamentous fungi at the ordinal level. At the generic level, the clustering quality values produced by both genetic markers were low, indicating the necessity for taxonomic revisions at genus level and, likely, for applying more conserved genetic markers or even whole genomes. The taxonomic thresholds predicted for filamentous fungal identification at the genus, family, order and class levels were 94.3 %, 88.5 %, 81.2 % and 80.9 % based on ITS barcodes, and 98.2 %, 96.2 %, 94.7 % and 92.7 % based on LSU barcodes. The DNA barcodes used in this study have been deposited to GenBank and will also be publicly available at the Westerdijk Institute's website as reference sequences for fungal identification, marking an unprecedented data release event in global fungal barcoding efforts to date.

Keywords: Automated curation; Biological resource centre; Fungi; ITS; LSU; Taxonomic thresholds.


Figures

Fig. 1
Fig. 1
Collection locations of 13 173 strains in the current study. Each red dot represents a country of collection. The remaining 1 689 strains had no associated information.
Fig. 2
Fig. 2
The countries of collection together with the percentage of the strains.
Fig. 3
Fig. 3
Number of manually validated ex-type strains using ITS/LSU barcodes versus the total number of manually validated strains in the CBS filamentous fungal collection.
Fig. 4
Fig. 4
The lengths of ITS (A) and LSU (B) barcode sequences.
Fig. 5
Fig. 5
The classes, subphyla and phyla together with the associated number of ITS (A) and LSU (B) sequences.
Fig. 6
Fig. 6
The distributions of the ITS (A) and LSU (B) sequences of the manually validated strains. The sequences of the same colour belong to the same class. The five biggest classes in green, red, blue and pink represent 3 810, 2 210, 2 064, 1 483, 574 ITS and 4 151, 2 318, 2 247, 1 582, 615 LSU sequences of Sordariomycetes, Eurotiomycetes, Dothideomycetes, Agaricomycetes, and Leotiomycetes, respectively. The sequences in turquoise colour are the ones (1 145 for ITS and 1 279 for LSU) without a class name given in the database. The 3D coordinates of the sequences were computed using fMLC (Vu et al. 2018) to compute a complete similarity matrix and LargeVis (Tang et al. 2016) to calculate the coordinates of the sequences. The sequences were visualized using the rgl package in R (https://r-forge.r-project.org/projects/rgl/).
Fig. 7
Fig. 7
The distribution of DNA similarity scores for pairwise comparisons between species and within species, for manually validated strains in the ITS-V (A) and LSU-V (B) datasets.
Fig. 8
Fig. 8
Minimum ITS (A) and LSU (B) similarity score within species of the ITS-V and LSU-V datasets.
Fig. 9
Fig. 9
Filamentous fungal species with ITS-V (A) and LSU-V (B) similarity score less than 99 % from the ex-type to central representative strain. The number of the strains of the species is displayed in the secondary axis.
Fig. 10
Fig. 10
Percentages of species synonyms and indistinguishable species by using ITS and LSU barcodes using a threshold of 100 %, respectively.
Fig. 11
Fig. 11
2D scatter plots of ITS similarity scores versus LSU similarity scores of the ITS/LSU-V dataset.
Fig. 12
Fig. 12
Clustering qualities obtained when clustering the different barcode datasets ITS (A), LSU (B) and combined (C) with thresholds ranging from 0.97 to 1 using an incremental step of 0.0001. The vertical lines in the figures represent the thresholds proposed by UNITE for the species hypotheses.
Fig. 13
Fig. 13
Clustering qualities (F-measures) obtained by comparing the clustering results of ITS-T and LSU-T with different taxonomic classifications at higher levels with thresholds ranging from 0.7 (for ITS) and 0.9 (for LSU) to 1 using an incremental step of 0.0001.
Fig. 14
Fig. 14
Average similarity score within genera, families, orders and classes of the ITS-V and LSU-V datasets.
Fig. 15
Fig. 15
Clustering qualities (F-measures) obtained by comparing the clustering results of the LSU sequences of the three classes Sordariomycetes, Eurotiomycetes and Dothideomycetes with the taxonomic classifications at genus, family and order levels before and after updating taxon names.
Fig. 16
Fig. 16
The distribution of the LSU sequences of the class Eurotiomycetes before (A) and after (B) updating sequence names. The sequences of the same colour belong to the same family. The four biggest families represented by the colours green, red, blue and pink in the left picture are Trichocomaceae with 1 147 sequences, Aspergillaceae with 464 sequences, Herpotrichiellaceae with 257 sequences and Arthrodermataceae with 172 sequences, respectively. The family Aspergillaceae has been recently merged into the family Trichocomaceae, as can be seen in the right figure.
Fig. 17
Fig. 17
The total number of the obtained groups (displayed in the secondary axis) and the percentage of strains of the largest group obtained by clustering ITS-T and LSU-T with thresholds increased from 0.6 to 1 with a step of 0.0001.
Fig. 18
Fig. 18
The distributions of the ITS sequences of the validated dataset ITS-V (left) and its extension with the ITS sequences of the “Top 50 Most Wanted Fungi” dataset (right). The five groups in green, red, blue and pink represent 3 810, 2 210, 2 064, 1 483, and 574 ITS sequences of Sordariomycetes, Eurotiomycetes, Dothideomycetes, Agaricomycetes, and Leotiomycetes, respectively. All 2 024 sequences of the “Top 50 Most Wanted Fungi” dataset are in chocolate colour. The group in turquoise colour contains 1 145 sequences that have no a class name given in the database. The 3D coordinates of the sequences were computed using fMLC (Vu et al. 2018). The sequences were visualized using the rgl package in R (https://r-forge.r-project.org/projects/rgl/).
Fig. 19
Fig. 19
The lengths of the ITS regions extracted from the ITS validated dataset using the software ITSx (http://microbiology.se/software/itsx/). The obtained minimum length was 267.
Fig. 20
Fig. 20
The ITS similarity scores of the most wanted sequences to their best-match ITS barcodes.
Fig. 21
Fig. 21
The phyla, subphyla, classes, orders, families and genera together with the number of the sequences found in the “Top 50 Most Wanted Fungi” dataset.

References

    1. Afshinnekoo E., Meydan C., Chowdhury S. Geospatial Resolution of Human and Bacterial Diversity with City-Scale Metagenomics. Cell Systems. 2015;1:72–87. - PMC - PubMed
    1. Altschul S.F., Madden T.L., Schäffer A.A. Gapped BLAST and PSI-BLAST: a new generation of protein database search programs. Nucleic Acids Research. 1997;25:3389–3402. - PMC - PubMed
    1. Blaalid R., Kumar S., Nilsson R.H. ITS1 versus ITS2 as DNA metabarcodes for fungi. Molecular Ecology Resources. 2013;13:218–224. - PubMed
    1. Boon E., Zimmerman E., Lang B.F. Intra-isolate genome variation in arbuscular mycorrhizal fungi persists in the transcriptome. Journal of Evolutionary Biology. 2010;23:1519–1527. - PubMed
    1. Botschuijver S., Roeselers G., Levin E. Intestinal Fungal Dysbiosis Associates With Visceral Hypersensitivity in Patients With Irritable Bowel Syndrome and Rats. Gastroenterology. 2017;153:1026–1039. - PubMed