

Nonlinear Optical Methods for Characterization of Molecular Structure and Surface Chemistry
- PMID: 29955207
- PMCID: PMC6018028
- DOI: 10.1007/s11244-018-0924-3
Nonlinear Optical Methods for Characterization of Molecular Structure and Surface Chemistry
Abstract
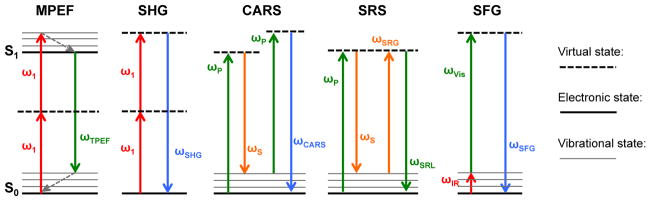
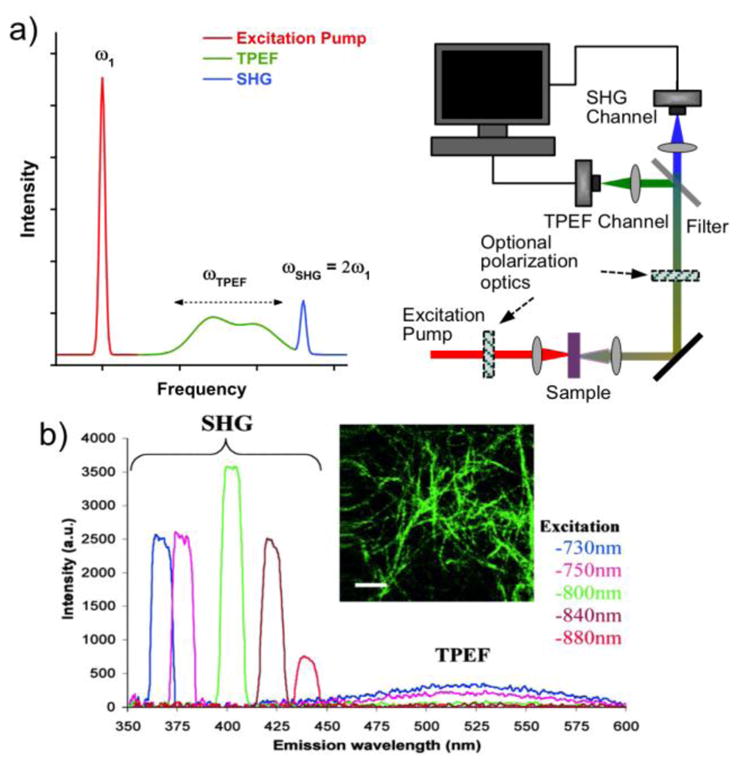
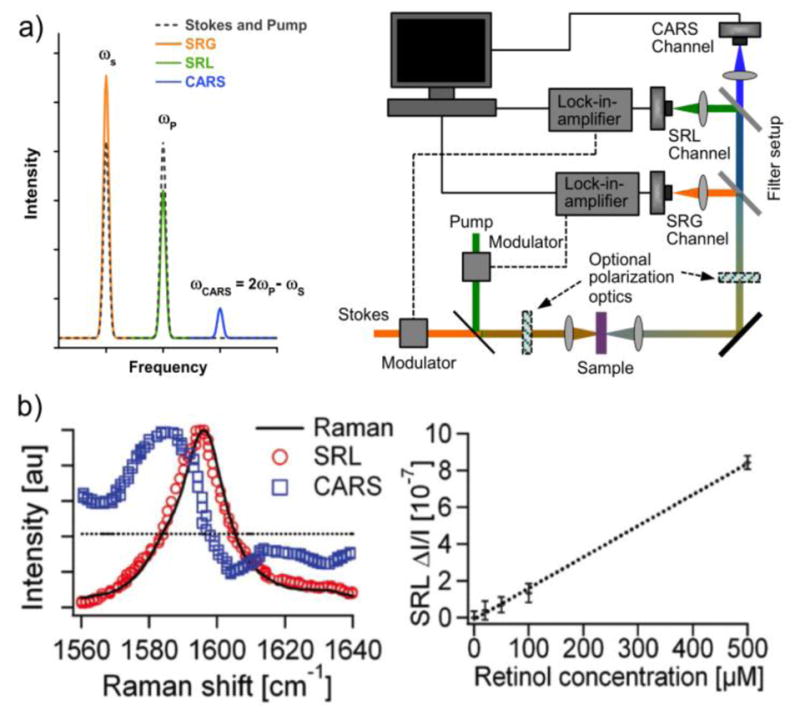
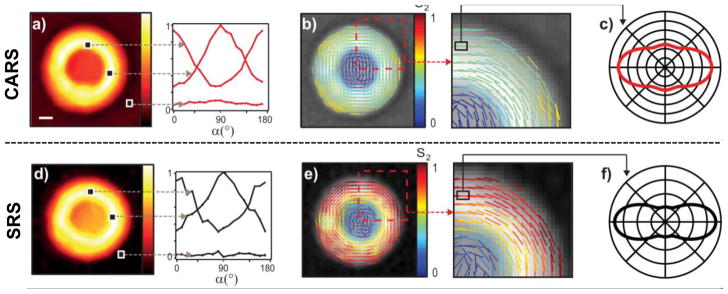
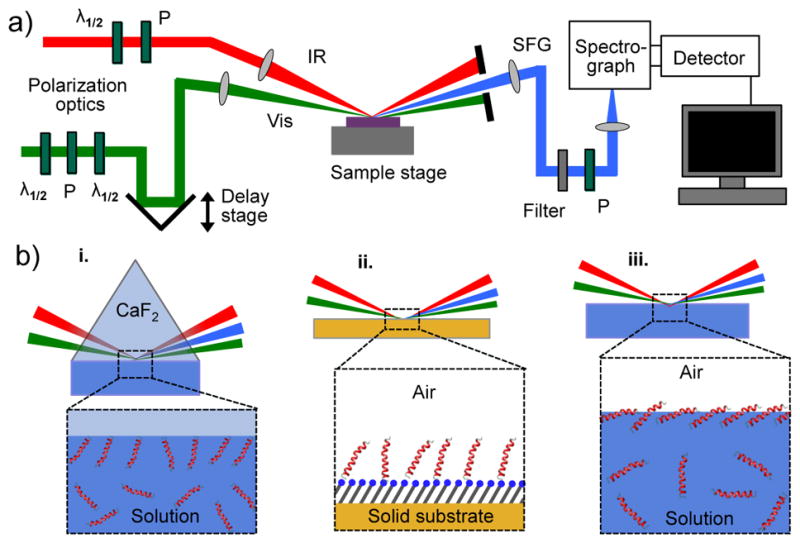
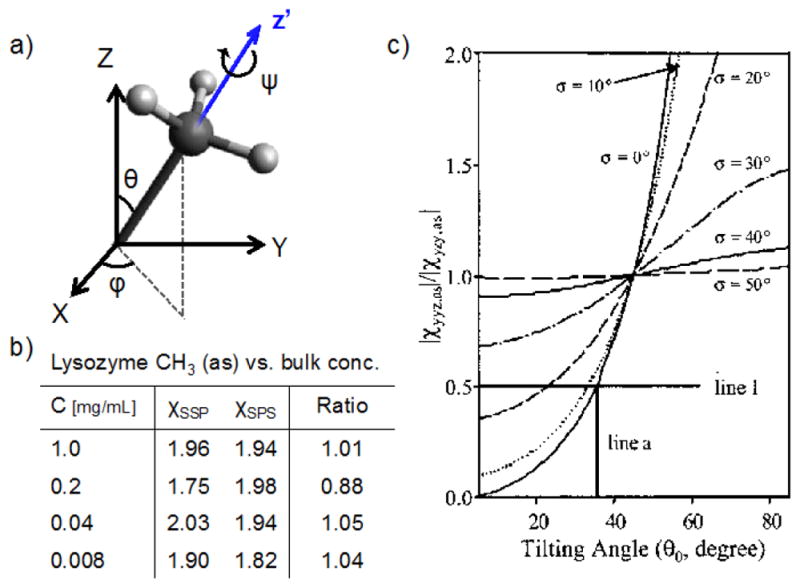
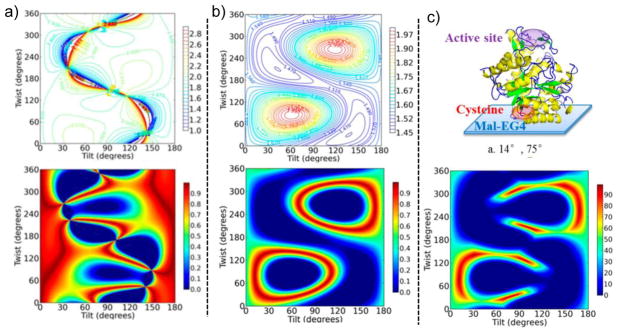
The principles, strengths and limitations of several nonlinear optical (NLO) methods for characterizing biological systems are reviewed. NLO methods encompass a wide range of approaches that can be used for real-time, in-situ characterization of biological systems, typically in a label-free mode. Multiphoton excitation fluorescence (MPEF) is widely used for high-quality imaging based on electronic transitions, but lacks interface specificity. Second harmonic generation (SHG) is a parametric process that has all the virtues of the two-photon version of MPEF, yielding a signal at twice the frequency of the excitation light, which provides interface specificity. Both SHG and MPEF can provide images with high structural contrast, but they typically lack molecular or chemical specificity. Other NLO methods such as coherent anti-Stokes Raman scattering (CARS) and stimulated Raman scattering (SRS) can provide high-sensitivity imaging with chemical information since Raman active vibrations are probed. However, CARS and SRS lack interface and surface specificity. A NLO method that provides both interface/surface specificity as well as molecular specificity is vibrational sum frequency generation (SFG) spectroscopy. Vibration modes that are both Raman and IR active are probed in the SFG process, providing the molecular specificity. SFG, like SHG, is a parametric process, which provides the interface and surface specificity. SFG is typically done in the reflection mode from planar samples. This has yielded rich and detailed information about the molecular structure of biomaterial interfaces and biomolecules interacting with their surfaces. However, 2-D systems have limitations for understanding the interactions of biomolecules and interfaces in the 3-D biological environment. The recent advances made in instrumentation and analysis methods for sum frequency scattering (SFS) now present the opportunity for SFS to be used to directly study biological solutions. By detecting the scattering at angles away from the phase-matched direction even centrosymmetric structures that are isotropic (e.g., spherical nanoparticles functionalized with self-assembled monolayers or biomolecules) can be probed. Often a combination of multiple NLO methods or a combination of a NLO method with other spectroscopic methods is required to obtain a full understanding of the molecular structure and surface chemistry of biomaterials and the biomolecules that interact with them. Using the right combination methods provides a powerful approach for characterizing biological materials.
Keywords: Biomaterial Characterization; Coherent Raman Spectroscopy; Nonlinear Optics; Structure Analysis; Sum-Frequency Generation; Surface Analysis.
Figures
Similar articles
-
Hyperspectral imaging with laser-scanning sum-frequency generation microscopy.Biomed Opt Express. 2017 Aug 29;8(9):4230-4242. doi: 10.1364/BOE.8.004230. eCollection 2017 Sep 1. Biomed Opt Express. 2017. PMID: 28966861 Free PMC article.
-
Fast vibrational imaging of single cells and tissues by stimulated Raman scattering microscopy.Acc Chem Res. 2014 Aug 19;47(8):2282-90. doi: 10.1021/ar400331q. Epub 2014 May 28. Acc Chem Res. 2014. PMID: 24871269 Free PMC article.
-
Implementation of a Coherent Anti-Stokes Raman Scattering (CARS) System on a Ti:Sapphire and OPO Laser Based Standard Laser Scanning Microscope.J Vis Exp. 2016 Jul 17;(113). doi: 10.3791/54262. J Vis Exp. 2016. PMID: 27501285
-
Applications of second harmonic generation (SHG)/sum-frequency generation (SFG) imaging for biophysical characterization of the plasma membrane.Biophys Rev. 2020 Oct 27;12(6):1321-9. doi: 10.1007/s12551-020-00768-4. Online ahead of print. Biophys Rev. 2020. PMID: 33108561 Free PMC article. Review.
-
Ultrafast nonlinear coherent vibrational sum-frequency spectroscopy methods to study thermal conductance of molecules at interfaces.Acc Chem Res. 2009 Sep 15;42(9):1343-51. doi: 10.1021/ar9000197. Acc Chem Res. 2009. PMID: 19388671 Review.
Cited by
-
Chirality discrimination at the carvone air/liquid interfaces detected by heterodyne-detected sum frequency generation.Heliyon. 2019 Dec 17;5(12):e03061. doi: 10.1016/j.heliyon.2019.e03061. eCollection 2019 Dec. Heliyon. 2019. PMID: 31890974 Free PMC article.
-
Current Status and Challenges of Analytical Methods for Evaluation of Size and Surface Modification of Nanoparticle-Based Drug Formulations.AAPS PharmSciTech. 2022 May 20;23(5):150. doi: 10.1208/s12249-022-02303-y. AAPS PharmSciTech. 2022. PMID: 35596094 Free PMC article. Review.
-
Vibrational Sum-Frequency Scattering as a Sensitive Approach to Detect Structural Changes in Collagen Fibers Treated with Surfactants.Langmuir. 2019 Jun 18;35(24):7848-7857. doi: 10.1021/acs.langmuir.9b00412. Epub 2019 Jun 3. Langmuir. 2019. PMID: 31117724 Free PMC article.
-
Innovative synthesis, structural characteristics, linear and nonlinear optical properties, and optoelectric parameters of newly developed A2ZnGeO4 (A = K, Li) thin films.RSC Adv. 2024 Jul 29;14(33):23802-23815. doi: 10.1039/d4ra03742a. eCollection 2024 Jul 26. RSC Adv. 2024. PMID: 39077322 Free PMC article.
-
Developments and Ongoing Challenges for Analysis of Surface-Bound Proteins.Annu Rev Anal Chem (Palo Alto Calif). 2021 Jul 27;14(1):389-412. doi: 10.1146/annurev-anchem-091520-010206. Annu Rev Anal Chem (Palo Alto Calif). 2021. PMID: 33979545 Free PMC article.
References
-
- Hunt JH, Guyotsionnest P, Shen YR. Observation of C-H stretch vibrations of monolayers of molecules optical sum-frequency generation. Chem Phys Lett. 1987;133(3):189–192. doi: 10.1016/0009-2614(87)87049-5. - DOI
-
- Bain CD, Davies PB, Ong TH, Ward RN, Brown MA. Quantitative-analysis of monolayer composition by sum-frequency vibrational spectroscopy. Langmuir. 1991;7(8):1563–1566. doi: 10.1021/la00056a003. - DOI
-
- Superfine R, Guyotsionnest P, Hunt JH, Kao CT, Shen YR. Surface vibrational spectroscopy of molecular adsorbates on metals and semiconductors by infrared visible sum-frequency generation. Surface Science. 1988;200(1):L445–L450. doi: 10.1016/0039-6028(88)90422-0. - DOI
Grants and funding
LinkOut - more resources
Full Text Sources
Other Literature Sources