Identifying hydro-meteorological events from precipitation extremes indices and other sources over northern Namibia, Cuvelai Basin
- PMID: 29955280
- PMCID: PMC6014122
- DOI: 10.4102/jamba.v7i1.177
Identifying hydro-meteorological events from precipitation extremes indices and other sources over northern Namibia, Cuvelai Basin
Abstract
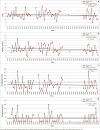
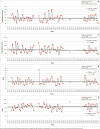
Worldwide, more than 40% of all natural hazards and about half of all deaths are the result of flood disasters. In northern Namibia flood disasters have increased dramatically over the past half-century, along with associated economic losses and fatalities. There is a growing concern to identify these extreme precipitation events that result in many hydro-meteorological disasters. This study presents an up to date and broad analysis of the trends of hydro-meteorological events using extreme daily precipitation indices, daily precipitation data from the Grootfontein rainfall station (1917-present), regionally averaged climatologies from the gauged gridded Climate Research Unit (CRU) product, archived disasters by global disaster databases, published disaster events in literature as well as events listed by Mendelsohn, Jarvis and Robertson (2013) for the data-sparse Cuvelai river basin (CRB). The listed events that have many missing data gaps were used to reference and validate results obtained from other sources in this study. A suite of ten climate change extreme precipitation indices derived from daily precipitation data (Grootfontein rainfall station), were calculated and analysed. The results in this study highlighted years that had major hydro-meteorological events during periods where no data are available. Furthermore, the results underlined decrease in both the annual precipitation as well as the annual total wet days of precipitation, whilst it found increases in the longest annual dry spell indicating more extreme dry seasons. These findings can help to improve flood risk management policies by providing timely information on historic hydro-meteorological hazard events that are essential for early warning and forecasting.
Conflict of interest statement
The authors declare that they have no financial or personal relationships which may have inappropriately influenced them in writing this article.
Figures


Similar articles
-
Probability of rainstorm and flood disasters due to extreme precipitation in Fen River Basin, China.Environ Sci Pollut Res Int. 2023 Jun;30(27):70783-70802. doi: 10.1007/s11356-023-27351-0. Epub 2023 May 8. Environ Sci Pollut Res Int. 2023. PMID: 37155096
-
Projected climate extremes over agro-climatic zones of Ganga River Basin under 1.5, 2, and 3° global warming levels.Environ Monit Assess. 2023 Aug 17;195(9):1062. doi: 10.1007/s10661-023-11663-2. Environ Monit Assess. 2023. PMID: 37592096
-
Development of a Spatial Decision Support System for Real-Time Flood Early Warning in the Vu Gia-Thu Bon River Basin, Quang Nam Province, Vietnam.Sensors (Basel). 2020 Mar 17;20(6):1667. doi: 10.3390/s20061667. Sensors (Basel). 2020. PMID: 32192135 Free PMC article.
-
The potential impacts of climate variability and change on health impacts of extreme weather events in the United States.Environ Health Perspect. 2001 May;109 Suppl 2(Suppl 2):191-8. doi: 10.1289/ehp.109-1240666. Environ Health Perspect. 2001. PMID: 11359686 Free PMC article. Review.
-
Predictions of extreme precipitation and sea-level rise under climate change.Philos Trans A Math Phys Eng Sci. 2002 Jul 15;360(1796):1301-11. doi: 10.1098/rsta.2002.1001. Philos Trans A Math Phys Eng Sci. 2002. PMID: 12804251 Review.
References
-
- Abbas F., Ahmad A., Safeeq M., Ali S., Saleem F., Hammad H.M. & Farhad W., 2014, ‘Changes in precipitation extremes over arid to semiarid and subhumid Punjab, Pakistan’, Theoretical and Applied Climatology 116, 671–680. http://dx.doi.org/10.1007/s00704-013-0988-8 - DOI
-
- Adhikari P., Hong Y., Douglas K.R., Kirschbaum D.B., Gourley J., Adler R. & Brakenridge G.R., 2010, ‘A digitized global flood inventory (1998–2008): Compilation and preliminary results’, Natural Hazards 55, 405–422. http://dx.doi.org/10.1007/s11069-010-9537-2 - DOI
-
- Alexander L.V. & Arblaster J.M., 2009, ‘Assessing trends in observed and modelled climate extremes over Australia in relation to future projections’, International Journal of Climatology 29, 417–435. http://dx.doi.org/10.1002/joc.1730 - DOI
-
- Alexander L.V., Zhang X., Peterson T.C., Caesar J., Gleason B., Klein Tank A.M.G., et al. , 2006, ‘Global observed changes in daily climate extremes of temperature and precipitation’, Journal of Geophysical Research – Atmospheres 111, D05109 http://dx.doi.org/10.1029/2005JD006290 - DOI
-
- Anyamba A., Chretien J-P., Small J., Tucker C.J. & Linthicum K.J.. 2006, ‘Developing global climate anomalies suggest potential disease risks for 2006-2007’, International Journal of Health Geographics 5, 60 PMID: 17194307, http://dx.doi.org/10.1186/1476-072X-5-60 - DOI - PMC - PubMed
Publication types
LinkOut - more resources
Full Text Sources
Other Literature Sources
Miscellaneous
