

Vulnerability assessments, identity and spatial scale challenges in disaster-risk reduction
- PMID: 29955282
- PMCID: PMC6014129
- DOI: 10.4102/jamba.v7i1.201
Vulnerability assessments, identity and spatial scale challenges in disaster-risk reduction
Abstract
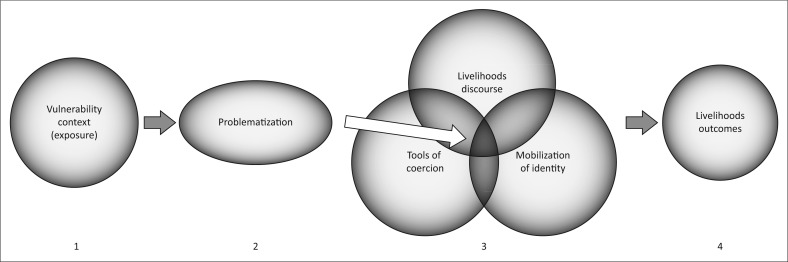
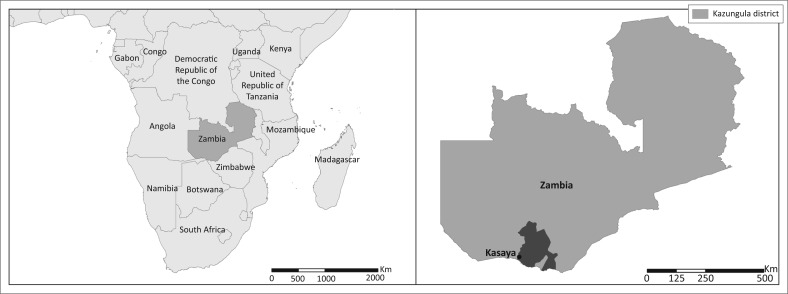
Current approaches to vulnerability assessment for disaster-risk reduction (DRR) commonly apply generalised, a priori determinants of vulnerability to particular hazards in particular places. Although they may allow for policy-level legibility at high levels of spatial scale, these approaches suffer from attribution problems that become more acute as the level of analysis is localised and the population under investigation experiences greater vulnerability. In this article, we locate the source of this problem in a spatial scale mismatch between the essentialist framings of identity behind these generalised determinants of vulnerability and the intersectional, situational character of identity in the places where DRR interventions are designed and implemented. Using the Livelihoods as Intimate Government (LIG) approach to identify and understand different vulnerabilities to flooding in a community in southern Zambia, we empirically demonstrate how essentialist framings of identity produce this mismatch. Further, we illustrate a means of operationalising intersectional, situational framings of identity to achieve greater and more productive understandings of hazard vulnerability than available through the application of general determinants of vulnerability to specific places and cases.
Conflict of interest statement
The authors declare that they have no financial or personal relationships which may have inappropriately influenced them in writing this article.
Figures


References
-
- Adger W.N., 2006, ‘Vulnerability’, Global Environmental Change 16(3), 268–281. http://dx.doi.org/10.1016/j.gloenvcha.2006.02.006 - DOI
-
- Arora-Jonsson S., 2011, ‘Virtue and vulnerability: Discourses on women, gender and climate change’, Global Environmental Change 21(2), 744–751. http://dx.doi.org/10.1016/j.gloenvcha.2011.01.005 - DOI
-
- Babugura A., Mtshali N. & Mtshali M., 2010, Gender and climate change: South Africa case study, Cape Town, viewed 07 February 2013, from https://www.donorplatform.org/resources/63/file/2010_Heinrich-Boll-Stift...
-
- Beetham G. & Demetriades J., 2007, ‘Feminist research methodologies and development: Overview and practical application’, Gender & Development 15(2), 199–216. http://dx.doi.org/10.1080/13552070701391086 - DOI
-
- Birkmann J., 2007, ‘Risk and vulnerability indicators at different scales: Applicability, usefulness and policy implications’, Environmental Hazards 7(1), 20–31. http://dx.doi.org/10.1016/j.envhaz.2007.04.002 - DOI
Publication types
LinkOut - more resources
Full Text Sources
Other Literature Sources