Editorial
. 2018 Apr;6(7):122.
doi: 10.21037/atm.2018.03.07.

Subgroup identification in clinical trials: an overview of available methods and their implementations with R

Affiliations
Editorial

Subgroup identification in clinical trials: an overview of available methods and their implementations with R

Zhongheng Zhang et al. Ann Transl Med. 2018 Apr.

Abstract

Randomized controlled trials (RCTs) usually enroll heterogeneous study population, and thus it is interesting to identify subgroups of patients for whom the treatment may be beneficial or harmful. A variety of methods have been developed to do such kind of post hoc analyses. Conventional generalized linear model is able to include prognostic variables as a main effect and predictive variables in an interaction with treatment variable. A statistically significant and large interaction effect usually indicates potential subgroups that may have different responses to the treatment. However, the conventional regression method requires to specify the interaction term, which requires knowledge of predictive variables or becomes infeasible when there is a large number of feature variables. The Least Absolute Shrinkage and Selection Operator (LASSO) method does variable selection by shrinking less clear effects (including interaction effects) to zero and in this way selects only certain variables and interactions for the model. There are many tree-based methods for subgroup identification. For example, model-based recursive partitioning incorporates parametric models such as generalized linear models into trees. The model incorporated is usually a simple model with only the treatment as covariate. Predictive and prognostic variables are found and incorporated automatically via the tree. The present article gives an overview of these methods and explains how to perform them using the free software environment for statistical computing R (version 3.3.2). A simulated dataset is employed for illustrating the performance of these methods.

Keywords: Subgroup; classification tree; lasso; recursive partitioning; regression tree.


Conflict of interest statement

Conflicts of Interest: The authors have no conflicts of interest to declare.

Figures

Figure 1
Figure 1
Cross-validation curve plotting AUC values against lambda values. The algorithm tries to find a parsimonious model with a large AUC value. Two selected lambda values which give the maximum AUC (minimum error) and the most regularized model such that error is within one standard error of the minimum, are indicated by two vertical dashed lines.
Figure 2
Figure 2
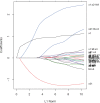
Coefficient path at different L1 Norm values. The coefficients including interaction terms shrink with decreasing values of L1 Norm (more panelized). It is noteworthy that x1, x2 and x1:x2:t are the last terms shrunken to zero.
Figure 3
Figure 3
Model-based tree by the pmtree() function. The tree recovers the data generating process quite well. It first splits in x1 close to zero (−0.006) and then in x2. Due to the linear effect of x1 on the outcome in the data generating process, the algorithm splits again in x1 for patients with x2 = 0 (see the changes in intercept).
Figure 4
Figure 4
Model-based tree by the glmtree() function.
Figure 5
Figure 5
Model-based tree by the palmtree() function.
Figure 6
Figure 6
Partitioning tree based on the QUINT method. x1 is first chosen as a splitting variable at the cutoff value of 0. The binary splitting results in two child variables. The second split is based on x2. Since x2 is a factor variable with two levels, there is no need to find a cutoff point. The QUINT algorithm results in four leaves. The P1 leaf with green color represents the subgroup of patients who benefit from treatment. P2 represents the subgroup of patients for whom the treatment is harmful, and the P3 leaves represent the subgroup of patients for whom the treatment is neutral.
Figure 7
Figure 7
Heterogeneous treatment effect across the study population. Treatment effect is plotted against index of observation.
Figure 8
Figure 8
Contour plot showing the distribution of treatment effects in covariate spaces defined by x1 and x2. It is noted that the subgroups in which the treatment is beneficial and harmful effects as represented by green and red colors, respectively, are by x1 at cutoff point of 0 and x2.
Figure 9
Figure 9
The distribution of the difference in probabilities of the event of interest for the treatment and control “twins”. It is noted that the subgroups in which the treatment is beneficial and harmful effects as represented by green and red colors, respectively, are by x1 at cutoff point of 0 and x2.
Figure 10
Figure 10
Classification (upper panel) and regression (bottom panel) trees partitioning the whole study population into subgroups. The subgroup in which the difference in probabilities is greater than a prespecified value c is of interest. The classification tree (upper panel) predicts patients belong to the class with Z* = 0 when x<0.035, which is not the class of interest in the example. In contrast, the covariate space x1≥0.035 and x2≥0.5 defines a region where Zi > c. It is noteworthy that 281 of the 288 patients at the rightmost terminal node have Z* = 1, which is the exact region the vt.tree() function tries to find. The regression tree (bottom panel) shows the difference in probability Zi at inner and terminal nodes. The percentage of patients are shown at the bottom of each nodes. In the terminal node defined by x1≥ 0.047 and x2≥0.5, the difference in probabilities of the treatment and control “twins” is 0.23, which accounts for 14% of the whole study population.

References

    1. Nallamothu BK, Hayward RA, Bates ER. Beyond the randomized clinical trial: the role of effectiveness studies in evaluating cardiovascular therapies. Circulation 2008;118:1294-303. 10.1161/CIRCULATIONAHA.107.703579 - DOI - PubMed
    1. Oude Rengerink K, Kalkman S, Collier S, et al. Series: Pragmatic trials and real world evidence: Paper 3. Patient selection challenges and consequences. J Clin Epidemiol 2017;89:173-80. 10.1016/j.jclinepi.2016.12.021 - DOI - PubMed
    1. Lipkovich I, Dmitrienko A, D'Agostino B R., Sr Tutorial in biostatistics: data-driven subgroup identification and analysis in clinical trials. Stat Med 2017;36:136-96. 10.1002/sim.7064 - DOI - PubMed
    1. Kehl V, Ulm K. Responder identification in clinical trials with censored data. Computational Statistics & Data Analysis 2006;50:1338-55. 10.1016/j.csda.2004.11.015 - DOI
    1. Pavlou M, Ambler G, Seaman S, et al. Review and evaluation of penalised regression methods for risk prediction in low-dimensional data with few events. Stat Med 2016;35:1159-77. 10.1002/sim.6782 - DOI - PMC - PubMed

Publication types

LinkOut - more resources