. 2018 Feb 24:8:64-71.
doi: 10.1016/j.bonr.2018.02.006. eCollection 2018 Jun.

Activation of mTORC1 in chondrocytes does not affect proliferation or differentiation, but causes the resting zone of the growth plate to become disordered

Affiliations

Activation of mTORC1 in chondrocytes does not affect proliferation or differentiation, but causes the resting zone of the growth plate to become disordered

Phillip T Newton et al. Bone Rep. .

Erratum in

Abstract

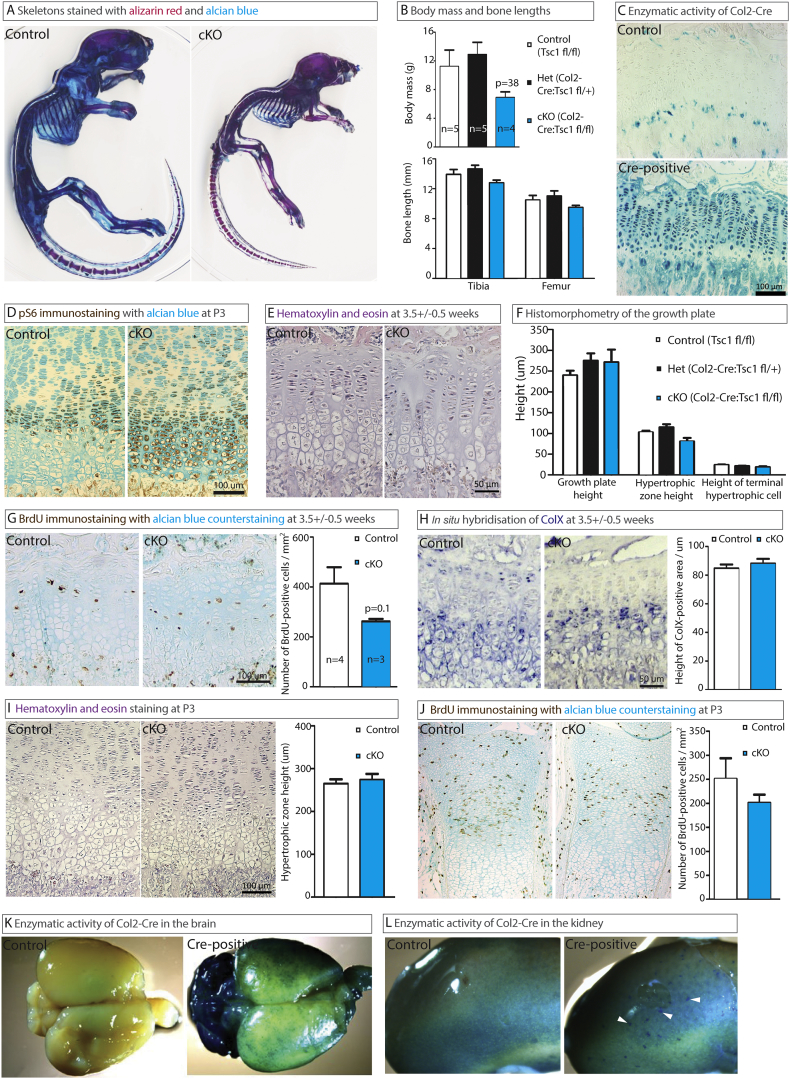
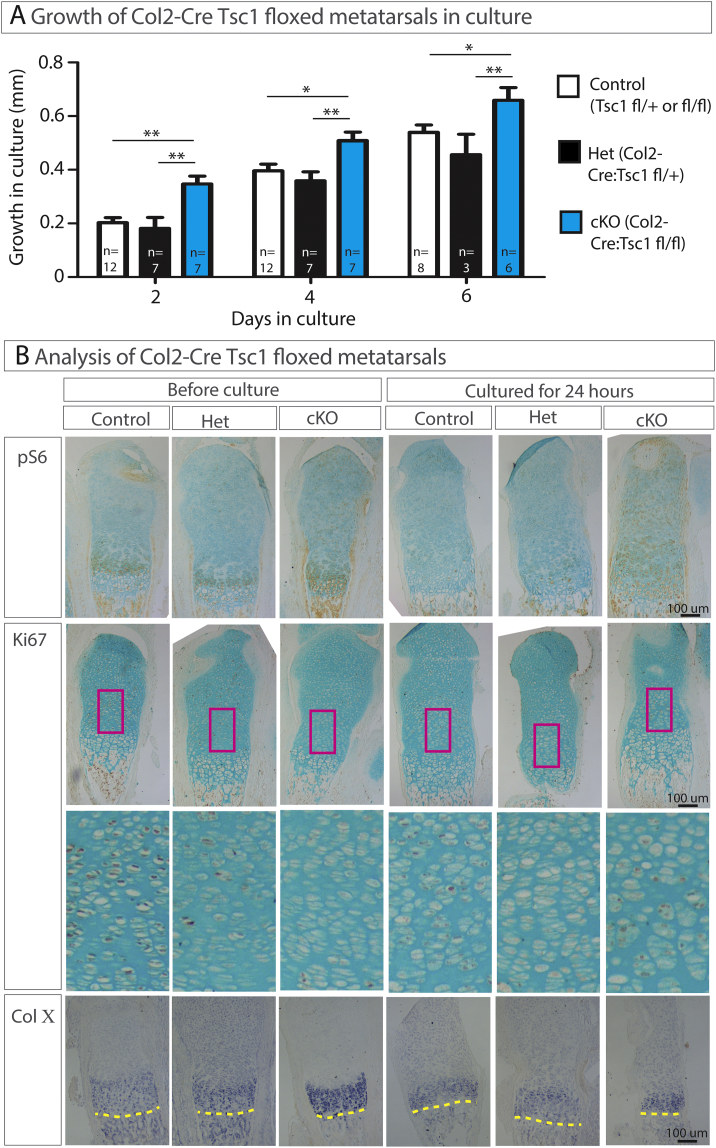
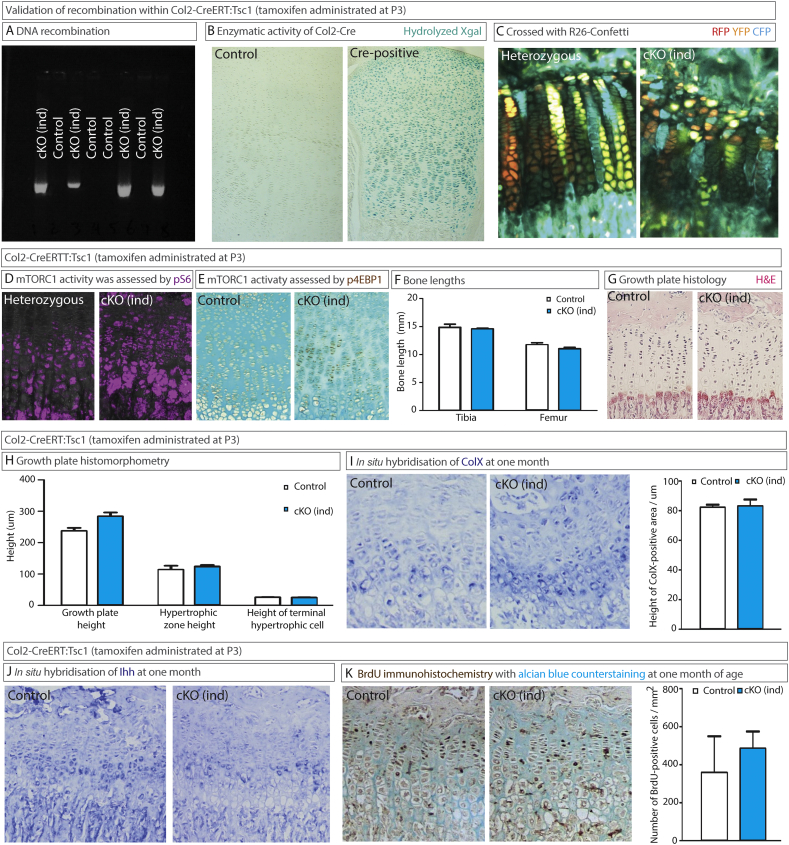
There are several pitfalls associated with research based on transgenic mice. Here, we describe our interpretation and analysis of mTORC1 activation in growth plate chondrocytes and compare these to a recent publication (Yan et al., Nature Communications 2016, 7:11151). Both laboratories employed TSC1-floxed mice crossed with collagen type 2-driven Cre (Col2-Cre), but drew substantially different conclusions. It was reported that activation of mechanistic target of rapamycin complex 1 (mTORC1) via Tsc1 ablation promotes the hypertrophy of growth plate chondrocytes, whereas we observe only disorganization in the resting zone, with no effect on chondrocyte hypertrophy or proliferation. Here, we present our data and discuss the differences in comparison to the earlier phenotypic characterization of TSC1 ablation in cartilage. Importantly, we detect Col2-Cre activity in non-cartilaginous tissues (including the brain) and discuss it in relation to other studies reporting non-cartilaginous expression of collagen alpha(1) II. Altogether, we conclude that mouse phenotypes following genetic ablation using Col2-Cre should be interpreted with care. We also conclude that activation of mTORC1 by TSC1 ablation in postnatal chondrocytes with inducible Col2-Cre (Col2-CreERt) leads to disorganization of the resting zone but causes no changes in chondrocyte proliferation or differentiation.

Keywords: Chondrocyte; Col2-Cre; Cre; Growth plate; Knockout mice; Tsc1; mTORC1.


Figures

Fig. 1
Fig. 1
Col2-Cre:Tsc1 fl/fl mice develop abnormally, but their bones are relatively normal. (A) Skeletal preparations from one-month-old mice stained with alcian blue and alizarin red. (B) The body mass and bone length of mice at 3.5 ± 0.5 weeks of age. (C) The enzymatic activity of Cre in sections of growth plate from the three-week-old progeny of Rosa26 reporter mice crossed with Col2-Cre:Tsc1 fl/fl mice (upper panel – no Cre; lower panel - Cre-positive). (D) Immunohistochemical staining for phosphorylated S6 in the growth plate of 1-day-old mice. (E) Staining of sections of the growth plate of 3.5 ± 0.5-week-old mice with hematoxylin and eosin (H&E) for (F) morphometric analysis. (G) Immunohistochemical quantification of BrdU (injected 2 h prior to sacrifice) and quantification in 3.5 ± 0.5-week-old mice. (H) In situ hybridization and quantification of COL10A1 transcription in the growth plates of mice at 3.5 ± 0.5 weeks of age. (I) H&E staining for histomorphometry of the growth plates of three-day-old mice. (J) Immunohistochemical quantification of BrdU (injected into 2 ± 1-day old mice 2.25 ± 0.25 h prior to sacrifice). (K, L) The enzymatic activity of Cre in the whole brain and kidney of Col2-Cre:Rosa26 reporter mice, as determined by staining with X-gal at one month of age. In this figure, all controls are Col2-Cre-negative mice and all cKO mice have the genotype Col2-Cre:Tsc1 fl/fl, unless otherwise stated. The values presented are means ± SEM. No significant differences were detected between control and cKO mice (for G–J) utilizing either one-way ANOVA or an unpaired t-test.
Fig. 2
Fig. 2
Col2-Cre:Tsc1 fl/fl metatarsals have a growth advantage ex vivo. (A) Growth curves of metatarsals collected from three-day old mice and cultured for six days ex vivo. (B) Metatarsals were collected immediately before culture or after one day in culture (contralateral controls), then stained for pS6, Ki67 (immunohistochemistry) or COL10A1 (in situ hybridization). For Ki67 staining, the region directly above the hypertrophic zone is expanded (pink box). For COL10A1 staining, the yellow dashed line denotes the border between the cartilage and the primary spongiosa. (For interpretation of the references to color in this figure legend, the reader is referred to the web version of this article.)
Fig. 3
Fig. 3
Postnatal ablation of Tsc1 in mice does not affect cell proliferation or hypertrophy in the growth plate, but leads to disorganization of the resting zone. Unless otherwise stated, in all these images, data on control (Col2-CreERT-negative) mice are shown to the left and on Tsc1cKOind (Col2-CreERT:Tsc1 fl/fl) mice to the right. To achieve recombination, all animals were injected with tamoxifen on P3 and sacrificed at 8 days (A, B, E) or 1 month of age (C, D, F–K). (A) Cartilage was isolated from the elbows, DNA extracted, and PCR performed to identify the product of Tsc1 recombination. The bands are seen exclusively in the Cre-positive Tsc1 fl/fl animals. (B) The enzymatic activity of Cre in sections of growth plate from Col2-CreERT:Rosa26 reporter mice was assessed by staining with X-gal. (C) The R26-Confetti reporter strain (in which Cre recombination leads to the expression of different fluorescent proteins, in a stochastic manner) was crossed with Col2-CreERt and Tsc1-floxed mice and the progeny injected with tamoxifen on P3 and analyzed at 1 month of age. Col2-CreERt:Tsc1 fl/+: R26-Confetti on the left and Col2-Cre:Tsc1 fl/fl: R26-Confetti on the right panel. (D) The level of phosphorylated S6 in cKOind mice was higher than in the control mice (1 month of age). (E) The level of phosphorylated 4EBP1 in cKOind mice was higher than in the control mice (F) Lengths of the tibia (t) and femur (f) are shown at one month of age. (G, H) Sections of the growth plate were stained with H&E staining and morphometric analysis was conducted. (I) Transcription of COL10A1 and (J) Ihh expression in the growth plate, as detected by in situ hybridization. (K) Immunohistochemical quantification of BrdU (injected 2 h prior to sacrifice). All values presented are means ± SEM (n = 3–8). No significant differences were detected between control and cKO mice utilizing an unpaired t-test (F, H, I and K).
Fig. S1
Fig. S1
Semi-automated quantification of fluorescent images using ImageJ freeware. Details are outlined in the Materials and methods section. Brightness and contrast have been adjusted in image A for visual purposes.

References

    1. Bouderlique T., Vuppalapati K.K., Newton P.T., Li L., Barenius B., Chagin A.S. Targeted deletion of Atg5 in chondrocytes promotes age-related osteoarthritis. Ann. Rheum. Dis. 2015;75:627–631. - PMC - PubMed
    1. Carson R.P., Van Nielen D.L., Winzenburger P.A., Ess K.C. Neuronal and glia abnormalities in Tsc1-deficient forebrain and partial rescue by rapamycin. Neurobiol. Dis. 2012;45:369–380. - PMC - PubMed
    1. Chagin A.S., Vuppalapati K.K., Kobayashi T., Guo J., Hirai T., Chen M., Offermanns S., Weinstein L.S., Kronenberg H.M. G-protein stimulatory subunit alpha and Gq/11α G-proteins are both required to maintain quiescent stem-like chondrocytes. Nat. Commun. 2014;5:1–14. http://www.nature.com/doifinder/10.1038/ncomms4673 - DOI - PMC - PubMed
    1. Cheah K.S., Lau E.T., Au P.K., Tam P.P. Expression of the mouse alpha 1(II) collagen gene is not restricted to cartilage during development. Development. 1991;111:945–953. - PubMed
    1. Chen J., Long F. mTORC1 signaling controls mammalian skeletal growth through stimulation of protein synthesis. Development. 2014;141:2848–2854. - PMC - PubMed

LinkOut - more resources