

SLIDE - a web-based tool for interactive visualization of large-scale - omics data
- PMID: 29955804
- PMCID: PMC6330001
- DOI: 10.1093/bioinformatics/bty534
SLIDE - a web-based tool for interactive visualization of large-scale - omics data
Abstract
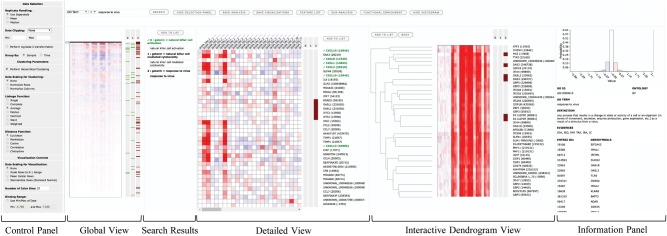
Summary: Data visualization is often regarded as a post hoc step for verifying statistically significant results in the analysis of high-throughput datasets. This common practice leaves a large amount of raw data behind, from which more information can be extracted. However, existing solutions do not provide capabilities to explore large-scale raw datasets using biologically sensible queries, nor do they allow user interaction based real-time customization of graphics. To address these drawbacks, we have designed an open-source, web-based tool called Systems-Level Interactive Data Exploration, or SLIDE to visualize large-scale -omics data interactively. SLIDE's interface makes it easier for scientists to explore quantitative expression data in multiple resolutions in a single screen.
Availability and implementation: SLIDE is publicly available under BSD license both as an online version as well as a stand-alone version at https://github.com/soumitag/SLIDE.
Supplementary information: Supplementary data are available at Bioinformatics online.
Figures
References
-
- Müllner D. (2013) fastcluster: fast hierarchical, agglomerative clustering routines for R and Python. J. Stat. Software, 53, 1–18.
Publication types
MeSH terms
LinkOut - more resources
Full Text Sources
Other Literature Sources
Molecular Biology Databases
