An Autonomic Network: Synchrony Between Slow Rhythms of Pulse and Brain Resting State Is Associated with Personality and Emotions
- PMID: 29955858
- PMCID: PMC6095212
- DOI: 10.1093/cercor/bhy144
An Autonomic Network: Synchrony Between Slow Rhythms of Pulse and Brain Resting State Is Associated with Personality and Emotions
Erratum in
-
An Autonomic Network: Synchrony Between Slow Rhythms of Pulse and Brain Resting State Is Associated with Personality and Emotions.Cereb Cortex. 2019 Apr 1;29(4):1702. doi: 10.1093/cercor/bhy230. Cereb Cortex. 2019. PMID: 30566618 Free PMC article. No abstract available.
Abstract
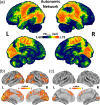
The sympathetic system's role in modulating vasculature and its influence on emotions and personality led us to test the hypothesis that interactions between brain resting-state networks (RSNs) and pulse amplitude (indexing sympathetic activity) would be associated with emotions and personality. In 203 participants, we characterized RSN spatiotemporal characteristics, and phase-amplitude associations of RSN fluctuations with pulse and respiratory recordings. We found that RSNs are spatially reproducible within participants and were temporally associated with low frequencies (LFs < 0.1 Hz) in physiological signals. LF fluctuations in pulse amplitude were not related to cardiac electrical activity and preceded LF fluctuations in RSNs, while LF respiratory amplitude fluctuations followed LF fluctuations in RSNs. LF phase dispersion (PD) (lack of synchrony) between RSNs and pulse (PDpulse) (not respiratory) correlated with the common variability in measures of personality and emotions, with more synchrony being associated with more positive temperamental characteristics. Voxel-level PDpulse mapping revealed an "autonomic brain network," including sensory cortices and dorsal attention stream, with significant interactions with peripheral signals. Here, we uncover associations between pulse signal amplitude (presumably of sympathetic origin) and brain resting state, suggesting that interactions between central and autonomic nervous systems are important for characterizing personality and emotions.
Figures


Similar articles
-
Characterizing systemic physiological effects on the blood oxygen level dependent signal of resting-state fMRI in time-frequency space using wavelets.Hum Brain Mapp. 2023 Dec 15;44(18):6537-6551. doi: 10.1002/hbm.26533. Epub 2023 Nov 11. Hum Brain Mapp. 2023. PMID: 37950750 Free PMC article.
-
Frequency specific interactions of MEG resting state activity within and across brain networks as revealed by the multivariate interaction measure.Neuroimage. 2013 Oct 1;79:172-83. doi: 10.1016/j.neuroimage.2013.04.062. Epub 2013 Apr 28. Neuroimage. 2013. PMID: 23631996 Free PMC article.
-
Fluctuations of the EEG-fMRI correlation reflect intrinsic strength of functional connectivity in default mode network.J Neurosci Res. 2018 Oct;96(10):1689-1698. doi: 10.1002/jnr.24257. Epub 2018 May 14. J Neurosci Res. 2018. PMID: 29761531
-
Spatiotemporal dynamics of the brain at rest--exploring EEG microstates as electrophysiological signatures of BOLD resting state networks.Neuroimage. 2012 May 1;60(4):2062-72. doi: 10.1016/j.neuroimage.2012.02.031. Epub 2012 Feb 22. Neuroimage. 2012. PMID: 22381593
-
Mapping cognitive and emotional networks in neurosurgical patients using resting-state functional magnetic resonance imaging.Neurosurg Focus. 2020 Feb 1;48(2):E9. doi: 10.3171/2019.11.FOCUS19773. Neurosurg Focus. 2020. PMID: 32006946 Free PMC article. Review.
Cited by
-
Verification of a Central Pacemaker in Brain Stem by Phase-Coupling Analysis Between HR Interval- and BOLD-Oscillations in the 0.10-0.15 Hz Frequency Band.Front Neurosci. 2020 Aug 28;14:922. doi: 10.3389/fnins.2020.00922. eCollection 2020. Front Neurosci. 2020. PMID: 32982682 Free PMC article.
-
The Sensory and Motor Components of the Cortical Hierarchy Are Coupled to the Rhythm of the Stomach during Rest.J Neurosci. 2022 Mar 16;42(11):2205-2220. doi: 10.1523/JNEUROSCI.1285-21.2021. Epub 2022 Jan 24. J Neurosci. 2022. PMID: 35074866 Free PMC article.
-
Correspondence between cerebral glucose metabolism and BOLD reveals relative power and cost in human brain.Nat Commun. 2019 Feb 11;10(1):690. doi: 10.1038/s41467-019-08546-x. Nat Commun. 2019. PMID: 30741935 Free PMC article.
-
Brain-heart interaction disruption in major depressive disorder: disturbed rhythm modulation of the cardiac cycle on brain transient theta bursts.Eur Arch Psychiatry Clin Neurosci. 2024 Apr;274(3):595-607. doi: 10.1007/s00406-023-01628-4. Epub 2023 Jun 15. Eur Arch Psychiatry Clin Neurosci. 2024. PMID: 37318589
-
Widespread brain-body integration during changes of arousal.Nat Neurosci. 2025 Jun;28(6):1126-1127. doi: 10.1038/s41593-025-01946-x. Nat Neurosci. 2025. PMID: 40346371 No abstract available.
References
-
- Allen J. 2007. Photoplethysmography and its application in clinical physiological measurement. Physiol Meas. 28:R1. - PubMed
-
- Awad AA, Ghobashy MAM, Ouda W, Stout RG, Silverman DG, Shelley KH. 2001. Different responses of ear and finger pulse oximeter wave form to cold pressor test. Anesth Analg. 92:1483–1486. - PubMed
-
- Başar E, Weiss C. 1981. Vasculature and circulation: the role of myogenic reactivity in the regulation of blood flow. Great Britain: Elsevier Science Ltd.
-
- Beckmann CF, Smith SM. 2004. Probabilistic independent component analysis for functional magnetic resonance imaging. IEEE Trans Med Imaging. 23:137–152. - PubMed
Publication types
MeSH terms
Grants and funding
LinkOut - more resources
Full Text Sources
Other Literature Sources

