. 2018 Aug;92(8):2587-2606.
doi: 10.1007/s00204-018-2250-8. Epub 2018 Jun 28.

Toxicity, recovery, and resilience in a 3D dopaminergic neuronal in vitro model exposed to rotenone

Affiliations

Toxicity, recovery, and resilience in a 3D dopaminergic neuronal in vitro model exposed to rotenone

Georgina Harris et al. Arch Toxicol. 2018 Aug.

Abstract

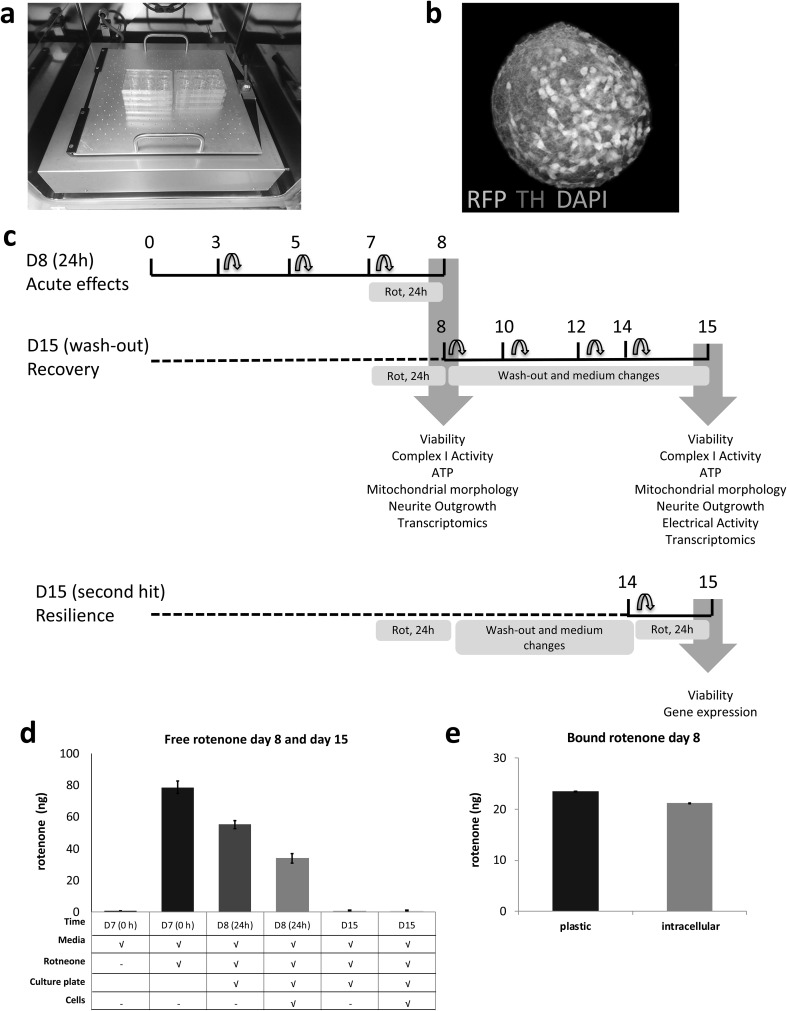
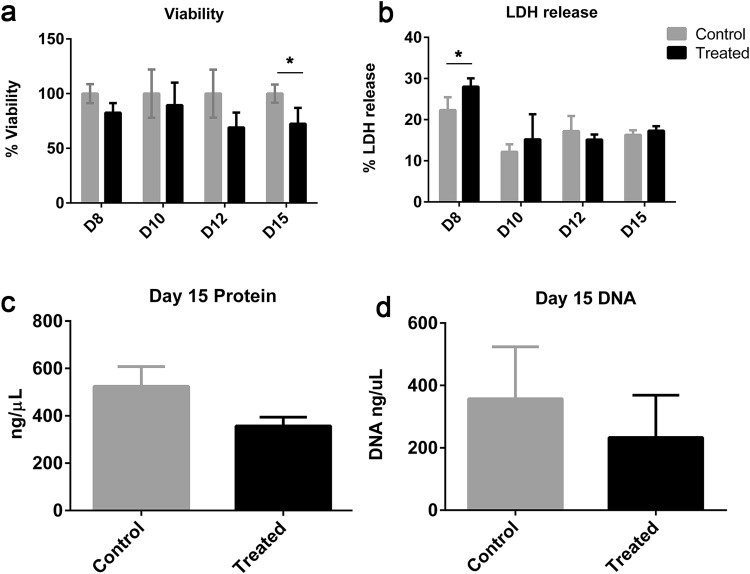
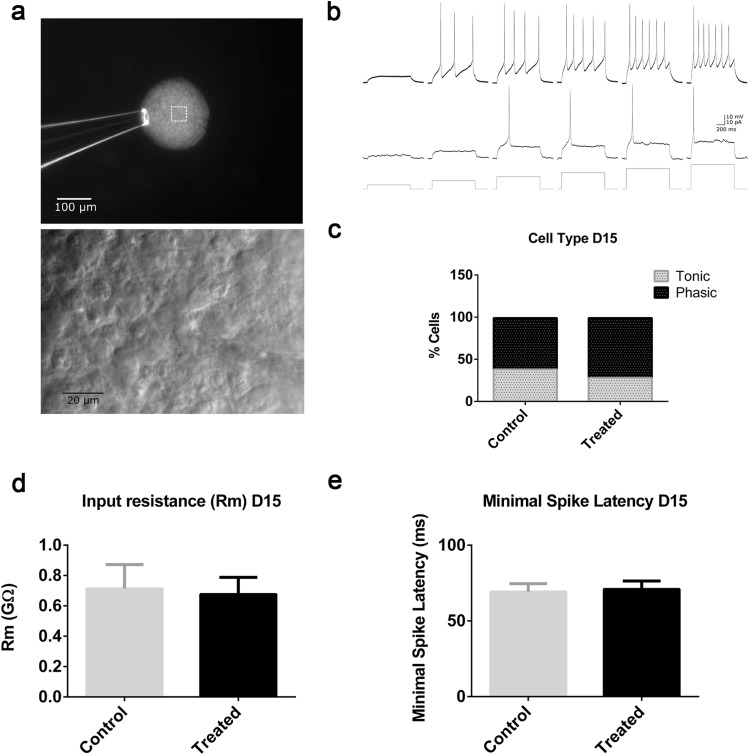
To date, most in vitro toxicity testing has focused on acute effects of compounds at high concentrations. This testing strategy does not reflect real-life exposures, which might contribute to long-term disease outcome. We used a 3D-human dopaminergic in vitro LUHMES cell line model to determine whether effects of short-term rotenone exposure (100 nM, 24 h) are permanent or reversible. A decrease in complex I activity, ATP, mitochondrial diameter, and neurite outgrowth were observed acutely. After compound removal, complex I activity was still inhibited; however, ATP levels were increased, cells were electrically active and aggregates restored neurite outgrowth integrity and mitochondrial morphology. We identified significant transcriptomic changes after 24 h which were not present 7 days after wash-out. Our results suggest that testing short-term exposures in vitro may capture many acute effects which cells can overcome, missing adaptive processes, and long-term mechanisms. In addition, to study cellular resilience, cells were re-exposed to rotenone after wash-out and recovery period. Pre-exposed cells maintained higher metabolic activity than controls and presented a different expression pattern in genes previously shown to be altered by rotenone. NEF2L2, ATF4, and EAAC1 were downregulated upon single hit on day 14, but unchanged in pre-exposed aggregates. DAT and CASP3 were only altered after re-exposure to rotenone, while TYMS and MLF1IP were downregulated in both single-exposed and pre-exposed aggregates. In summary, our study shows that a human cell-based 3D model can be used to assess cellular adaptation, resilience, and long-term mechanisms relevant to neurodegenerative research.

Keywords: 3D LUHMES; Cellular defence; Gene response; Neurodegeneration; Pesticide; Recovery; Resilience; Rotenone.


Conflict of interest statement

Conflict of interest

The authors declare that they have no conflict of interest.

Research involving human participants and/or animals

This article does not contain any clinical studies with human participants or animals performed by any of the authors.

Figures

Fig. 1
Fig. 1
LUHMES 3D model for acute, recovery, and resilience experiments. a LUHMES differentiated in 3D on a gyratory shaker showing b RFP-expressing cells (red) and TH (green), nuclei (blue). c LUHMES 3D treatment and wash-out scheme for recovery and resilience (second hit) experiments and endpoints. d Medium rotenone quantification prior to treatment, day 8 and day 15. From left to right, bars correspond to negative control (medium without rotenone), positive control (medium with rotenone prior to treatment), 24 h treatment control (medium with rotenone in plates), 24 h treatment (medium with rotenone in plates with aggregates), 7 day wash-out control (medium with rotenone in plates on day 15 after wash-out), and 7 day wash-out treated cells (medium with rotenone in plates on day 15 after wash-out with aggregates). e Amount of rotenone bound to plastic and cells after 24 h exposure (day 8). (Color figure online)
Fig. 2
Fig. 2
3D LUHMES viability after wash-out. a Cell viability measured over time using resazurin assay on days 8 (after 24 h treatment) and 10, 12, and 15 (throughout recovery). b Cytotoxicity over time during recovery measured by LDH release on days 8 (after 24 h treatment) and 10, 12, and 15 (throughout recovery). c Protein concentration on day 15 after wash-out and 7 day recovery. d DNA quantification on day 15, after wash-out and 7 day recovery. All data were normalized to untreated control cells and are displayed as means ± SEM from three independent experiments. *p < 0.05
Fig. 3
Fig. 3
Effects of rotenone on complex I activity and ATP levels. a Complex I activity after rotenone exposure (day 8) and after compound wash-out and recovery (day 15) in control and treated samples. b ATP levels after rotenone exposure (24 h, day 8) or after wash-out and 7 day recovery period (day 15) in control and treated samples. Differences in treated and control samples from at least three independent experiments were analyzed for statistical significance using unpaired Student’s t test. A p value < 0.05 is denoted on graphs by * and p < 0.0001 by ****, respectively
Fig. 4
Fig. 4
TEM analysis of mitochondria after rotenone exposure and wash-out. M mitochondria, G Golgi complex, L lipid droplets, N nucleus, NN neurite. The number (a) and diameter (b) of mitochondria from random image areas were quantified on day 8 (24 h) and day 15 (wash-out). Data from 20 random images from three independent experiments are shown as well as means ± SD. Differences between treated and untreated samples were analyzed for statistical significance using unpaired Student’s t test. A p value < 0.05 is denoted on the graphs by asterisk. c Representative images are shown with arrows indicating morphological alternations to the mitochondrial membrane
Fig. 5
Fig. 5
Image J Sholl analysis of neurite outgrowth after rotenone exposure (day 8) and wash-out (day 15). RFP-LUHMES aggregates were grown on Matrigel® on day 8 or day 15. a Representative images for the different conditions are shown. b Sholl analysis (Image J) was used to calculate the number of neurites at different distances from the aggregate center on day 8 and day 15 from three independent experiments (5 individual aggregates per experiment). Curves were compared using a quadratic non-linear regression fit with confidence intervals
Fig. 6
Fig. 6
3D LUHMES electrical activity on day 15 after acute exposure on day 7 and compound wash-out. a Photo microscopy image of a 3D LUHMES aggregate attached to a glass pipette and a patched cell at a higher magnification. Cells on different aggregates were patched in three independent experiments. b Firing pattern of a representative tonic (top) and a phasic (middle) cell with voltage responses to 1 s current injections (bottom) at 4, 8, 12, 16, 20, and 24 pA. c Total number of tonic and phasic cells in control and treated samples on day 15 (p = 0.695 two-sided Fisher’s exact test); d input resistance (Rm) of the phasic cells (p = 0.963 two-sided Mann–Whitney U test) and e minimal spiking latency of phasic cells (p = 0.852 two-sided Mann–Whitney U test). Error bars represent SEM
Fig. 7
Fig. 7
Rotenone-induced transcriptome changes on day 8 (24 h) vs. day 15 (wash-out). a Volcano plots show the global changes in transcriptome for day 8 and day 15. b Venn diagram shows the number of up- and downregulated genes on day 8 [D8 (24 h)] and on day 15 [D15 (wash-out)] (FC > 1.5, p < 0.01). Ten genes were in intersection between two conditions, which are listed in c. For this diagram, the p values were not adjusted for multiple testing. ACTA1actin alfa 1, skeletal muscles, PPP1R27 protein phosphatase 1, regulatory subunit 27, GDF15 growth differentiation factor 15, CCK cholecystokinin, CD200 OX-2 membrane glycoprotein, LCP1 plastin 2 (lymphocyte cytosolic protein 1), ZFHX4 AS1-ZFHX4 (Zinc-Finger Homeobox 4) antisense RNA 1, FRMPD2 FERM and PDZ domain containing 2, FRMPD2 FERM and PDZ domain containing 2, GRXCR1 glutaredoxin and cysteine-rich domain containing 1
Fig. 8
Fig. 8
Effects of second exposure on viability and gene expression. a, b Cell viability concentration–response for aggregates on day 15, which were pre-exposed to DMSO (control) or rotenone (pre-exposed 100 or 50 nM) on day 8. c LDH-release dose–response for aggregates on day 15 that were pre-exposed to DMSO (control) or rotenone (pre-exposed 100 nM) on day 8. Dose–response curves were generated from three independent experiments and analyzed by one-way ANOVA followed by Bonferroni’s correction. d NEF2L2, ATF4, EAAC1, e DAT, CASP3, and f TYMS, MLF1IP gene expression measured by QT-PCR from three independent experiments and analyzed for significance using the Student’s t test and Bonferroni’s correction for multiple hypothesis testing. A p value < 0.05 is denoted by *, p < 0.01 by **, and p < 0.001 by ***, respectively

Similar articles

Cited by

References

    1. Alépée N, Bahinski A, Daneshian M, et al. State-of-the-art of 3D cultures (organs-on-a-chip) in safety testing and pathophysiology. ALTEX. 2014;31:441–477. doi: 10.14573/altex.1406111. - DOI - PMC - PubMed
    1. Arenaza-Urquijo EM, Vemuri P. Resistance vs resilience to Alzheimer disease: clarifying terminology for preclinical studies. Neurology. 2018;90(15):695–703. doi: 10.1212/WNL.0000000000005303. - DOI - PMC - PubMed
    1. Bal-Price A, Crofton KM, Sachana M, Shafer TJ, Behl M, Forsby A, Hargreaves A, Landesmann B, Lein PJ, Louisse J, Monnet-Tschudi F, Paini A, Rolaki A, Schrattenholz A, Suñol C, van Thriel C, Whelan M, Fritsche E. Putative adverse outcome pathways relevant to neurotoxicity. Crit Rev Toxicol. 2015;45(1):83–91. doi: 10.3109/10408444.2014.981331. - DOI - PMC - PubMed
    1. Bal-Price A, Lein PJ, Keil KP, Sethi S, Shafer T, Barenys M, Fritsche E, Sachana M, Meek ME. Developing and applying the adverse outcome pathway concept for understanding and predicting neurotoxicity. Neurotoxicology. 2017;59:240–255. doi: 10.1016/j.neuro.2016.05.010. - DOI - PMC - PubMed
    1. Bal-Price A, Leist M, Schildknecht S, Tschudi-Monnet F, Paini A, Terron A (2017b) Inhibition of the mitochondrial complex I of nigro-striatal neurons leads to parkinsonian motor deficits. https://aopwiki.org/aops/3. Accessed 25 Feb 2018

MeSH terms