

Inhibition of SRC family kinases facilitates anti-CTLA4 immunotherapy in head and neck squamous cell carcinoma
- PMID: 29955905
- PMCID: PMC11105240
- DOI: 10.1007/s00018-018-2863-3
Inhibition of SRC family kinases facilitates anti-CTLA4 immunotherapy in head and neck squamous cell carcinoma
Abstract
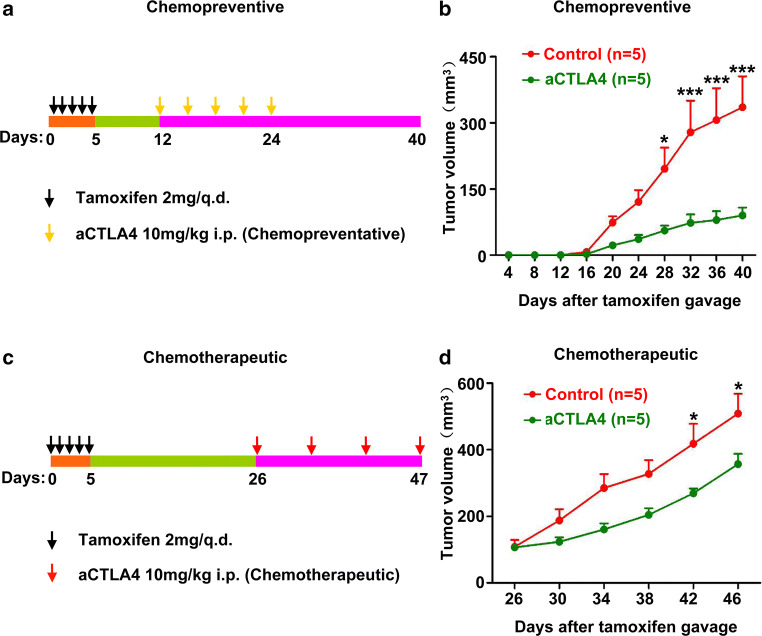
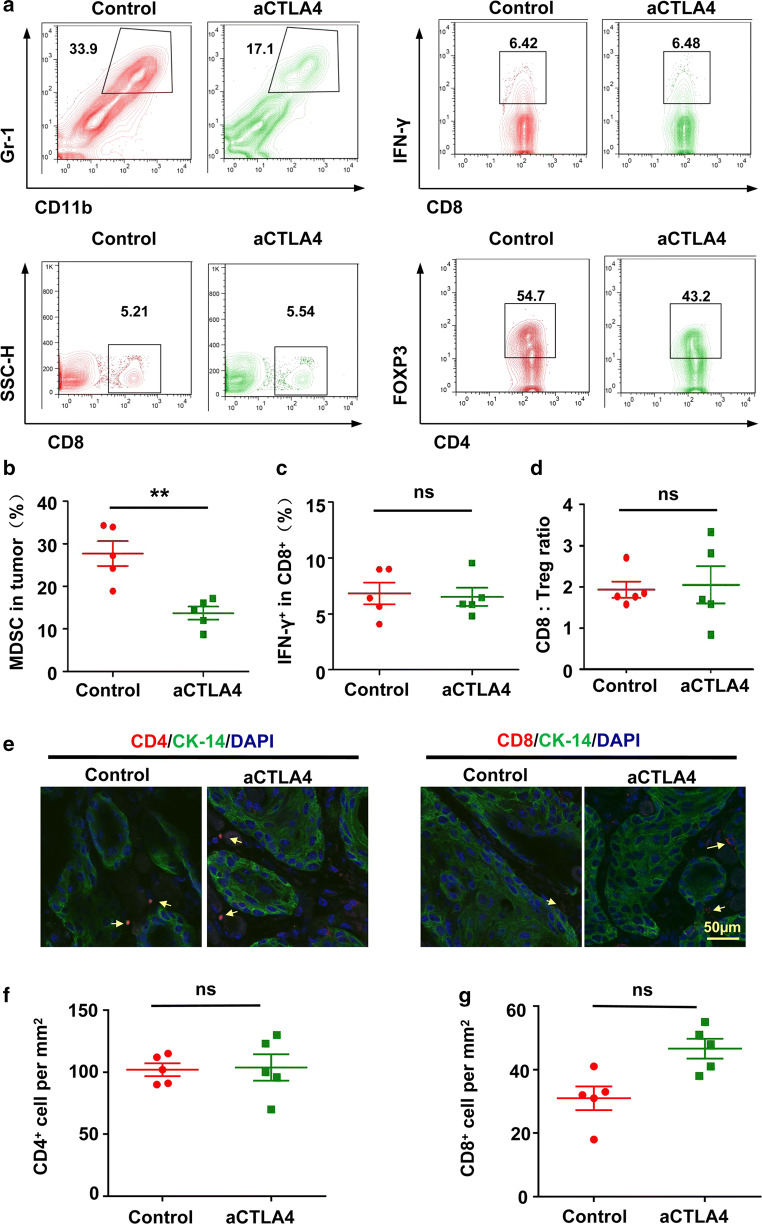
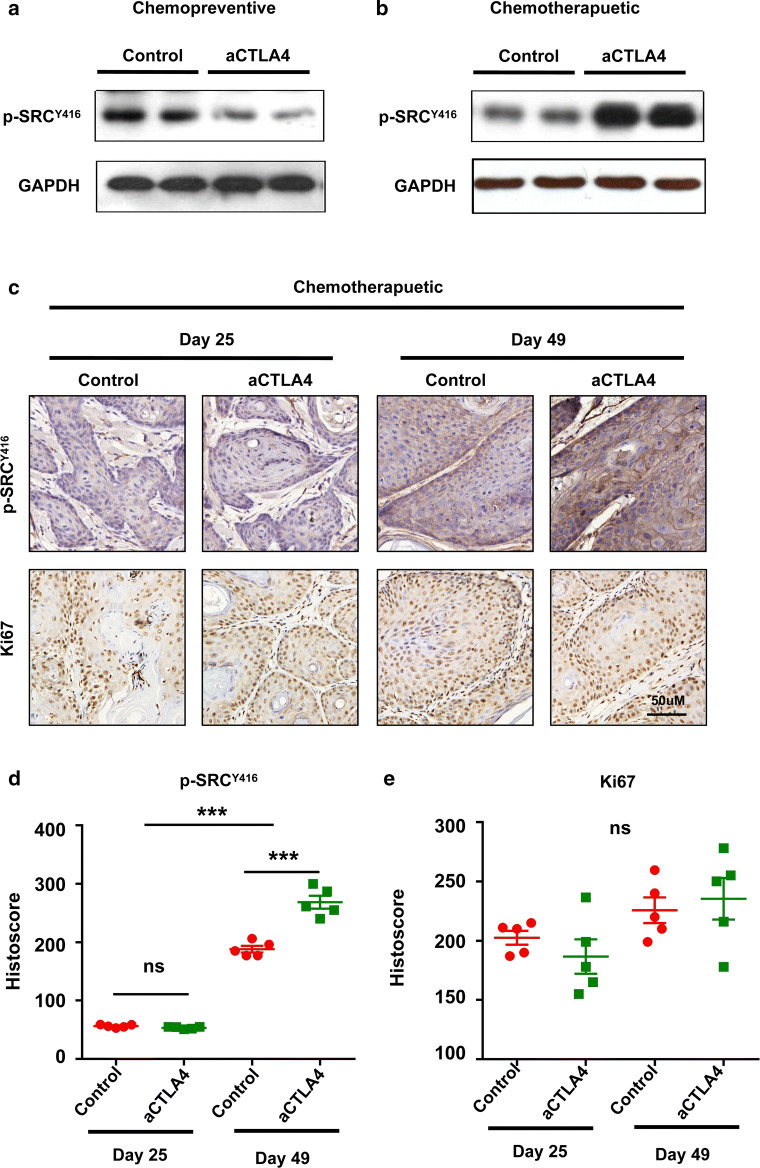
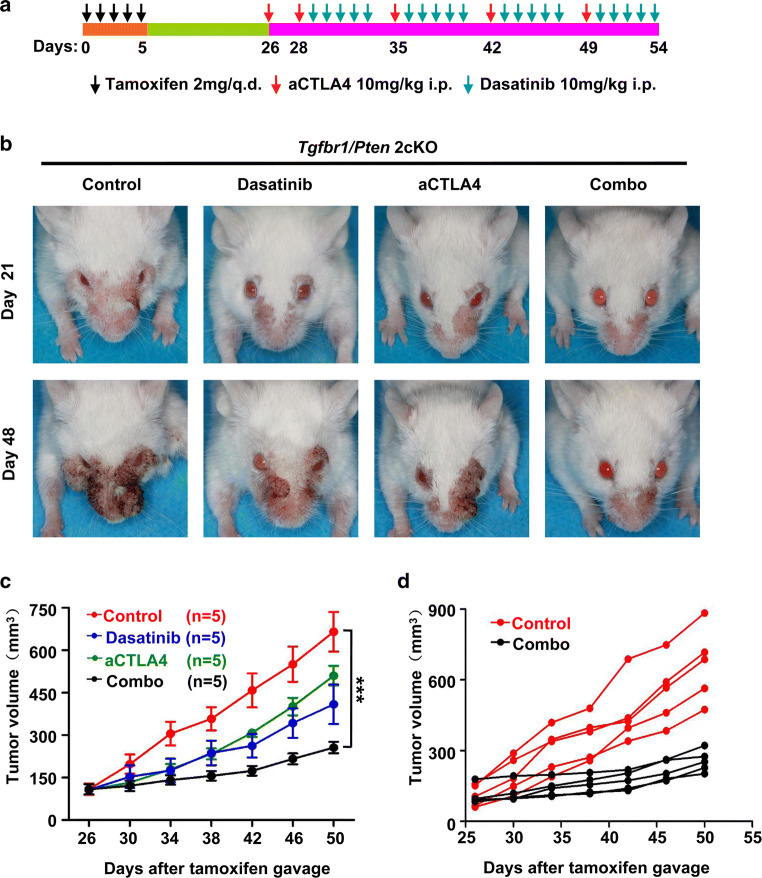
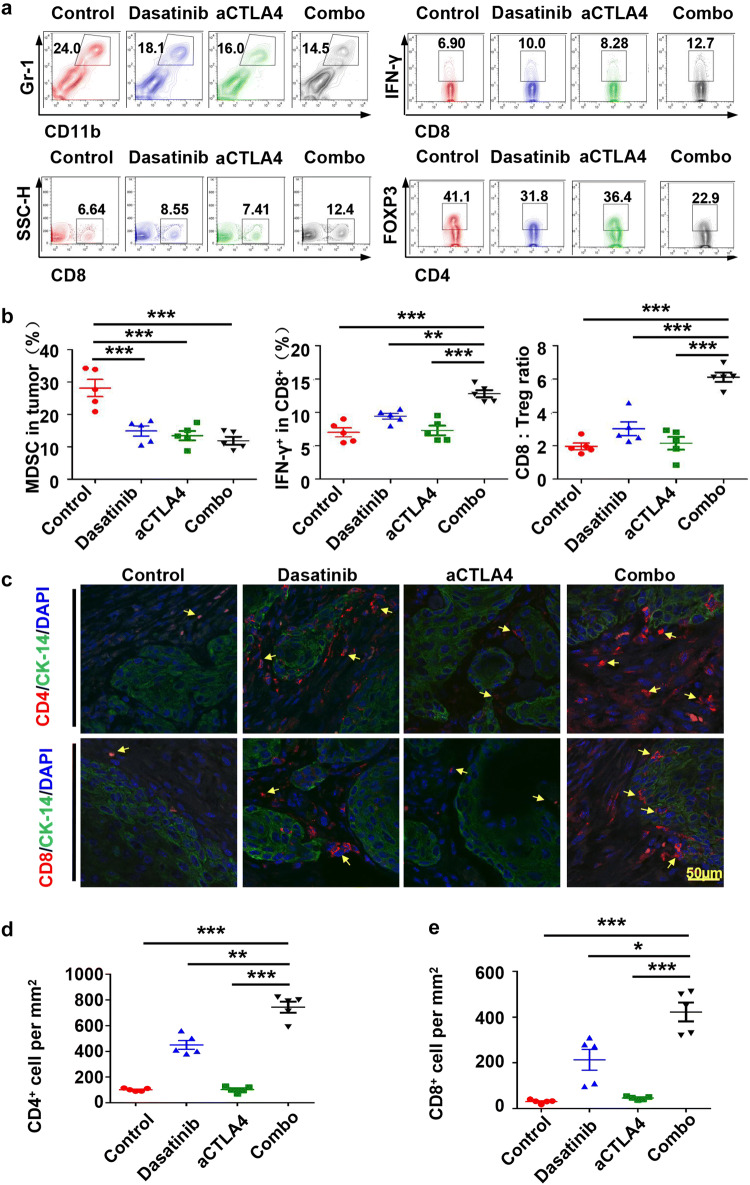
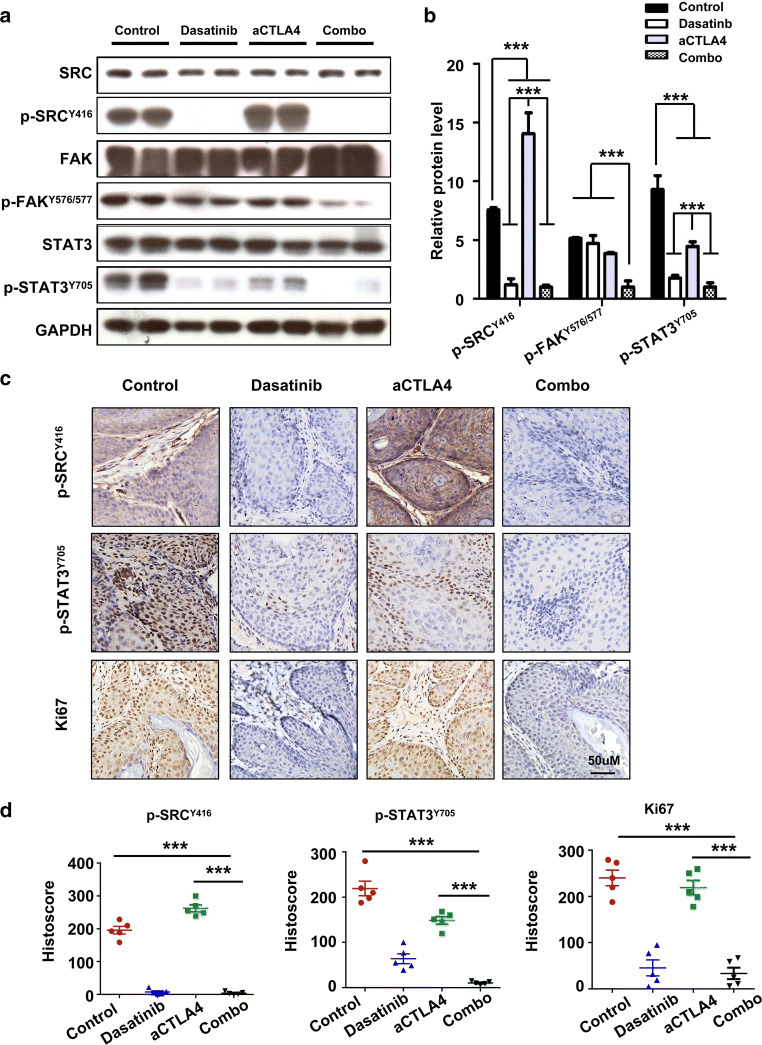
The immune system plays a critical role in the establishment, development, and progression of head and neck squamous cell carcinoma (HNSCC). As treatment with single-immune checkpoint agent results in a lower response rate in patients, it is important to investigate new strategies to maintain favorable anti-tumor immune response. Herein, the combination immunotherapeutic value of CTLA4 blockade and SFKs inhibition was assessed in transgenic HNSCC mouse model. Our present work showed that tumor growth was not entirely controlled when HNSCC model mice were administered anti-CTLA4 chemotherapeutic treatment. Moreover, it was observed that Src family kinases (SFKs) were hyper-activated and lack of anti-tumor immune responses following anti-CTLA4 chemotherapeutic treatment. We hypothesized that activation of SFKs is a mechanism of anti-CTLA4 immunotherapy resistance. We, therefore, carried out combined drug therapy using anti-CTLA4 mAbs and an SFKs' inhibitor, dasatinib. As expected, dasatinib and anti-CTLA4 synergistically inhibited tumor growth in Tgfbr1/Pten 2cKO mice. Furthermore, dasatinib and anti-CTLA4 combined to reduce the number of myeloid-derived suppressor cells and Tregs, increasing the CD8+ T cell-to-Tregs ratio. We also found that combining dasatinib with anti-CTLA4 therapy significantly attenuated the expression of p-STAT3Y705 and Ki67 in tumoral environment. These results suggest that combination therapy with SFKs inhibitors may be a useful therapeutic approach to increase the efficacy of anti-CTLA4 immunotherapy in HNSCC.
Keywords: CTLA4; Dasatinib; HNSCC; Immunotherapy; MDSCs; Tregs.
Conflict of interest statement
The authors declare that they have no competing interests.
Figures
Similar articles
-
Inhibition of SRC family kinases reduces myeloid-derived suppressor cells in head and neck cancer.Int J Cancer. 2017 Mar 1;140(5):1173-1185. doi: 10.1002/ijc.30493. Epub 2016 Dec 2. Int J Cancer. 2017. PMID: 27798955
-
Blockade of adenosine A2A receptor enhances CD8+ T cells response and decreases regulatory T cells in head and neck squamous cell carcinoma.Mol Cancer. 2017 Jun 7;16(1):99. doi: 10.1186/s12943-017-0665-0. Mol Cancer. 2017. PMID: 28592285 Free PMC article.
-
Chemopreventive and chemotherapeutic actions of mTOR inhibitor in genetically defined head and neck squamous cell carcinoma mouse model.Clin Cancer Res. 2012 Oct 1;18(19):5304-13. doi: 10.1158/1078-0432.CCR-12-1371. Epub 2012 Aug 2. Clin Cancer Res. 2012. PMID: 22859719 Free PMC article.
-
Molecular targeted therapies in the management of head and neck squamous cell carcinoma: recent developments and perspectives.Anticancer Agents Med Chem. 2013 Mar;13(3):389-402. Anticancer Agents Med Chem. 2013. PMID: 23092267 Review.
-
[Immunocheckpoint inhibition in head and neck squamous cell carcinoma: the current status and progress].Zhonghua Zhong Liu Za Zhi. 2019 Sep 23;41(9):641-647. doi: 10.3760/cma.j.issn.0253-3766.2019.09.001. Zhonghua Zhong Liu Za Zhi. 2019. PMID: 31550852 Review. Chinese.
Cited by
-
Resistance to immune checkpoint therapies by tumour-induced T-cell desertification and exclusion: key mechanisms, prognostication and new therapeutic opportunities.Br J Cancer. 2023 Oct;129(8):1212-1224. doi: 10.1038/s41416-023-02361-4. Epub 2023 Jul 15. Br J Cancer. 2023. PMID: 37454231 Free PMC article. Review.
-
Innate T-αβ lymphocytes as new immunological components of anti-tumoral "off-target" effects of the tyrosine kinase inhibitor dasatinib.Sci Rep. 2020 Feb 24;10(1):3245. doi: 10.1038/s41598-020-60195-z. Sci Rep. 2020. PMID: 32094501 Free PMC article. Clinical Trial.
-
Resistance to Immune Checkpoint Inhibitors Secondary to Myeloid-Derived Suppressor Cells: A New Therapeutic Targeting of Haematological Malignancies.J Clin Med. 2021 Apr 28;10(9):1919. doi: 10.3390/jcm10091919. J Clin Med. 2021. PMID: 33925214 Free PMC article. Review.
-
Immune checkpoint therapy for solid tumours: clinical dilemmas and future trends.Signal Transduct Target Ther. 2023 Aug 28;8(1):320. doi: 10.1038/s41392-023-01522-4. Signal Transduct Target Ther. 2023. PMID: 37635168 Free PMC article. Review.
-
Human Papilloma Virus Positive Oropharyngeal Squamous Cell Carcinoma and the Immune System: Pathogenesis, Immunotherapy and Future Perspectives.Int J Mol Sci. 2024 Feb 28;25(5):2798. doi: 10.3390/ijms25052798. Int J Mol Sci. 2024. PMID: 38474047 Free PMC article. Review.
References
-
- Jie HB, Schuler PJ, Lee SC, Srivastava RM, Argiris A, Ferrone S, Whiteside TL, Ferris RL. CTLA-4(+) regulatory T cells increased in cetuximab-treated head and neck cancer patients suppress NK cell cytotoxicity and correlate with poor prognosis. Cancer Res. 2015;75:2200–2210. doi: 10.1158/0008-5472.CAN-14-2788. - DOI - PMC - PubMed
-
- Weed DT, Vella JL, Reis IM, De la Fuente AC, Gomez C, Sargi Z, Nazarian R, Califano J, Borrello I, Serafini P. Tadalafil reduces myeloid-derived suppressor cells and regulatory T cells and promotes tumor immunity in patients with head and neck squamous cell carcinoma. Clin Cancer Res. 2015;21:39–48. doi: 10.1158/1078-0432.CCR-14-1711. - DOI - PMC - PubMed
MeSH terms
Substances
Grants and funding
LinkOut - more resources
Full Text Sources
Other Literature Sources
Medical
Research Materials
Miscellaneous
