

doi: 10.1007/978-1-4939-7896-0_19.
Study of IgE-Producing B Cells Using the Verigem Fluorescent Reporter Mouse
Affiliations
- PMID: 29956157
- PMCID: PMC6675620
- DOI: 10.1007/978-1-4939-7896-0_19
Item in Clipboard
Study of IgE-Producing B Cells Using the Verigem Fluorescent Reporter Mouse
Methods Mol Biol.
2018.
Abstract
Immunoglobulin E (IgE) is the least abundant antibody isotype in mammalians, yet it plays a critical role in allergy and asthma. IgE-producing (IgE+) B cells are rare and difficult to detect, which have hindered progress to understand their generation and differentiation. Recently developed new fluorescent IgE reporter mice have enabled better understanding of the biology of IgE+ B cells. We here describe the usage of the Verigem IgE reporter mouse to study IgE+ B cells and plasma cells by flow cytometry and microscopy.
Keywords: B cells; Flow cytometry; Germinal center; IgE; IgE reporter; Imaging; Microscopy; Plasma cells; Verigem.
Figures
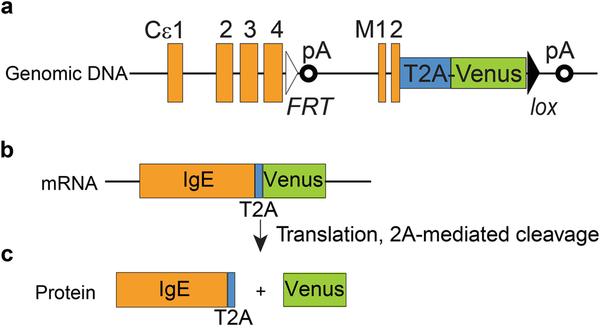
Diagram of the genomic allele, mRNA, and protein of the Verigem reporter. The relative location of exons and polyadenylation sites (pA) of the IgE genomic locus are shown (a). The coding sequence of T2A-Venus is fused in frame to the coding sequence of the membrane IgE M2 exon. Also shown are one FRT site placed immediately 3′ of the coding sequence of Cε4s exon (the last exon for secreted IgE) and one loxP site placed immediately 3′ of the Venus coding sequence. The coding sequences for membrane IgE, T2A, and Venus will be transcribed and spliced into single mRNA molecules (b), but the IgE BCR and Venus will be separated into individual proteins during translation at the T2A site (c)
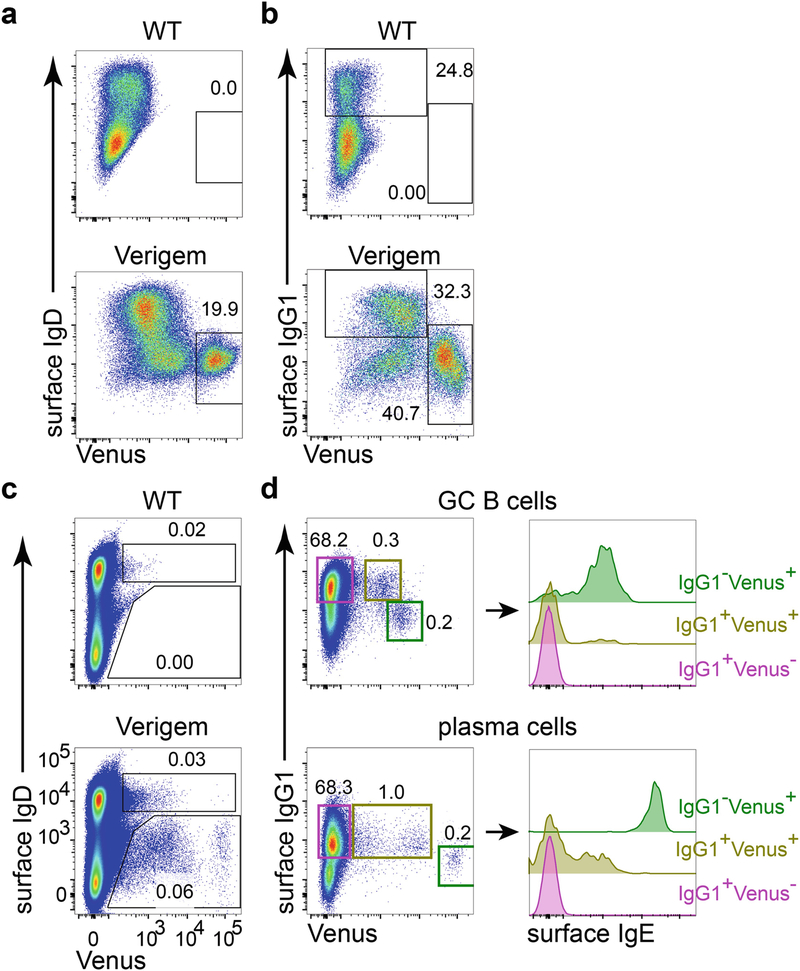
Flow cytometric characterization of IgE+ B cells generated in vitro or in vivo from Verigem reporter and control mice. (a, b) B cells from WT control or homozygous Verigem mice were cultured in vitro with anti-CD40 (250 ng/mL) and murine IL-4 (25 ng/mL) for 4 days. (c, d) Cell suspensions from draining LNs of WT control or homozygous Verigem mice 7 days after subcutaneous immunization with NP-CGG in alum adjuvant were stained and analyzed by flow cytometry. Cells in panels a and c were gated on live singlets; cells in panel b were gated on live singlets that are IgD−, IgM−, and CD19+. Cells in panel d were pooled from the draining LNs of five homozygous Verigem mice and were pre-gated as GC B cells (live singlets that are CD138−B220highCD 19+CD38lowGL7highIgDlow), and PCs (live singlets that are CD138+B220−CD38lowIgDlow) were further gated according to their expression of Venus and surface IgG1 (panel d, left), and histograms of surface IgE staining on these gated populations are further plotted (panel d, right)
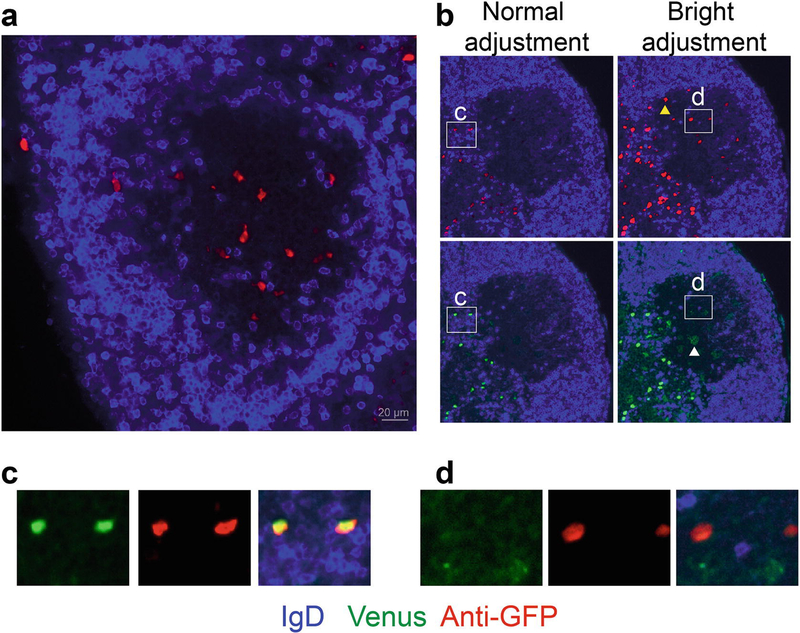
Representative microscopy of the Verigem reporter in LN cryostat sections. Heterozygous Verigem reporter mice were immunized subcutaneously with NP-KLH in alum adjuvant, and LNs were collected 7 d later. (a) Example of a GC (IgDlow region) with IgE+ B cells detected by anti-GFP staining (red). (b) Demonstration of the difference in sensitivity between anti-GFP staining and Venus fluorescence and the importance of the display adjustments to detect IgE+ PCs (Venushigh) versus IgE+ GC B cells (Venuslow). All four panels show the same image with either anti-GFP staining (red, upper panels) or with Venus fluorescence (green, lower panels). The image display levels are adjusted in a standard fashion to show the full range of signal detected (left panels) versus an exaggerated narrow range making the red/green signal appear bright (right panels). Note the GC B cells (e.g., see the yellow arrowhead) can only be detected by anti-GFP staining on the right panels with the bright adjustment of display levels. While PCs can be directly detected by either Venus fluorescence or anti-GFP staining (inset c) with normal display levels, the GC B cells cannot be visualized by Venus fluorescence but can be visualized by the anti-GFP staining with the bright adjustment of display levels (inset d). Within the GC, the bright display adjustment of the Venus channel instead reveals autofluorescent cells, such as tingible body macrophages (e.g., see the white arrowhead in (b, lower right panel)). The bright adjustment of display levels also results in oversaturation of the PCs; thus it may be difficult to properly visualize PCs and GC B cells with the same display settings. Anti-GFP was detected in the far red channel (see
Note 10)
References
Publication types
MeSH terms
Substances
Grants and funding
LinkOut - more resources
Full Text Sources
Other Literature Sources
