. 2018 Sep;42(3):1495-1507.
doi: 10.3892/ijmm.2018.3739. Epub 2018 Jun 21.

A novel scoring system for acute myeloid leukemia risk assessment based on the expression levels of six genes

Affiliations

A novel scoring system for acute myeloid leukemia risk assessment based on the expression levels of six genes

Xiaoyan Zhao et al. Int J Mol Med. 2018 Sep.

Abstract

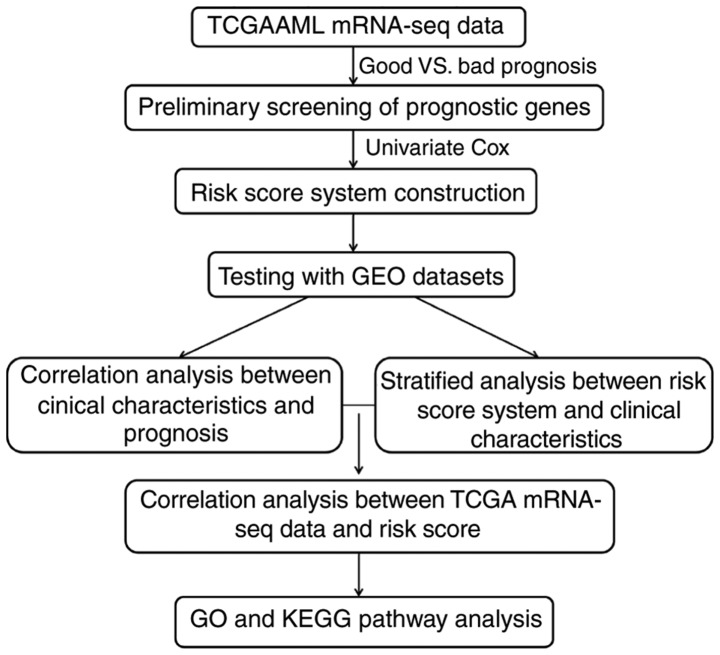
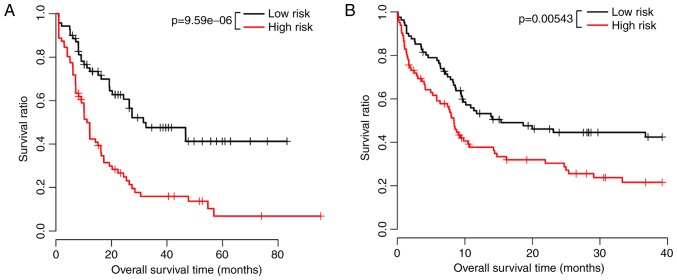
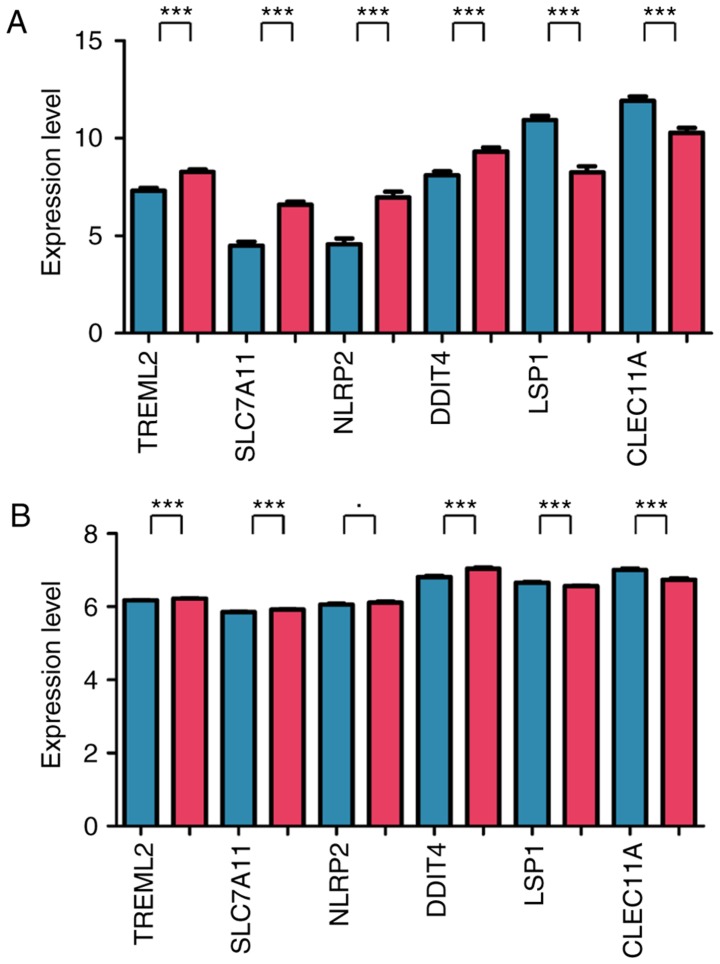
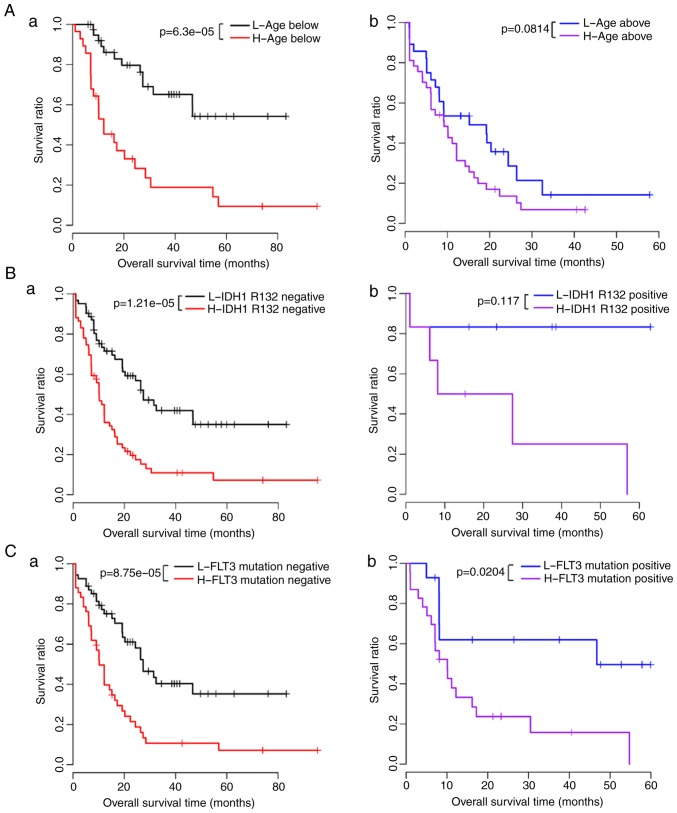
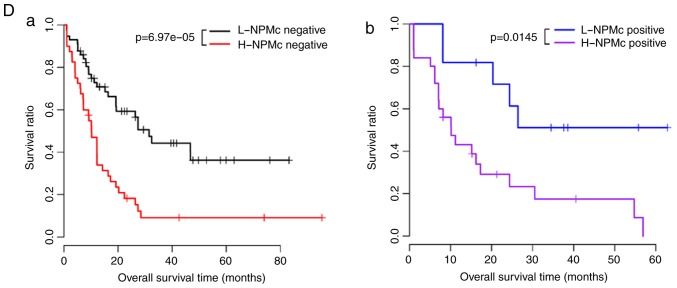
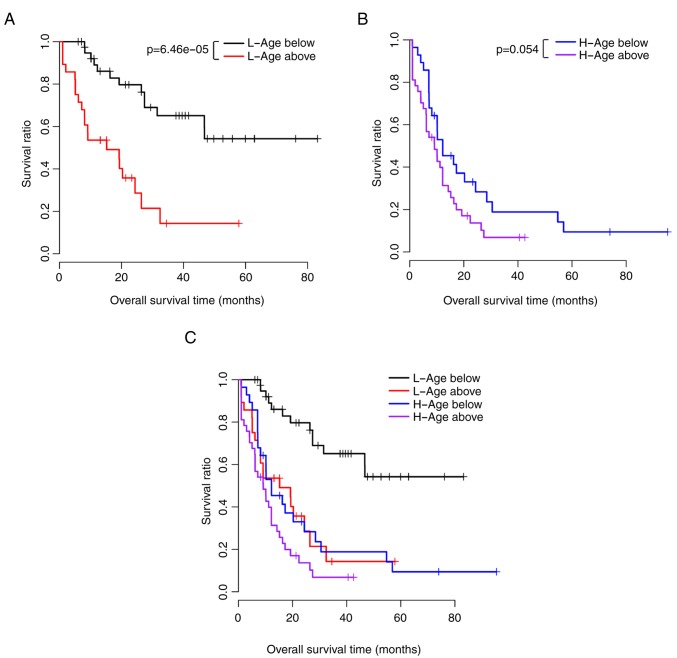
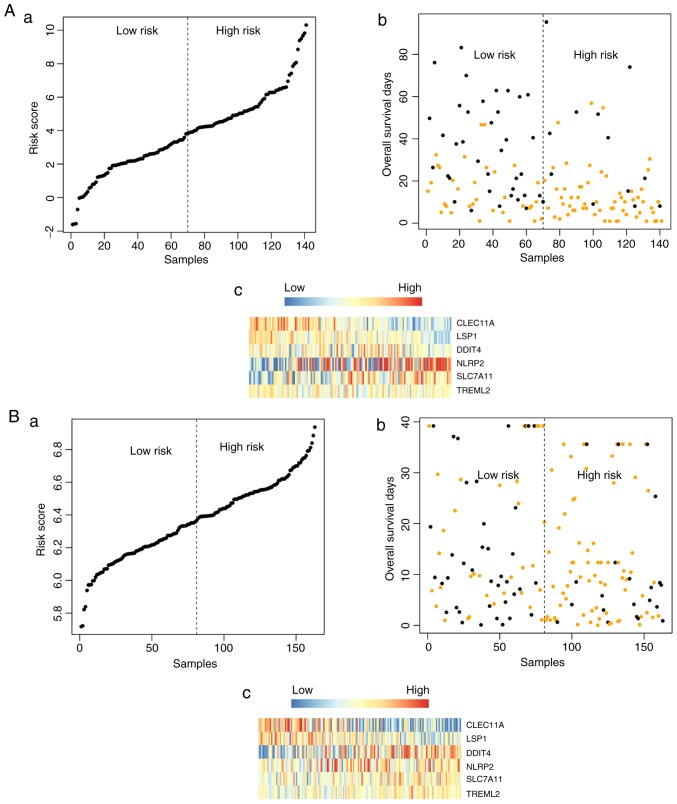
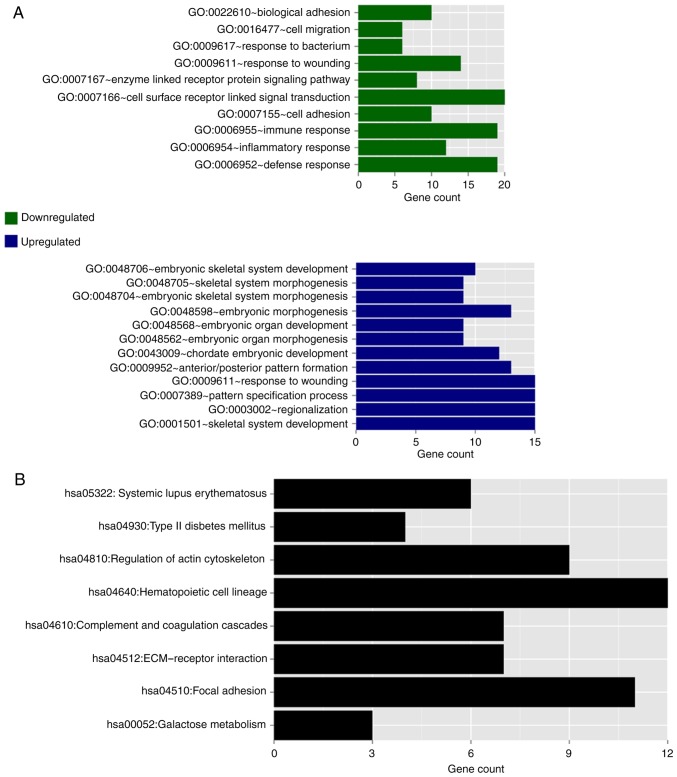
Acute myeloid leukemia (AML) is the most common type of acute leukemia and is a heterogeneous clonal disorder. At present, the pathogenesis of AML and potential methods to effectively prevent AML have become areas of interest in research. In the present study, two messenger ribonucleic acid sequencing datasets of patients with AML were downloaded from the Cancer Genome Atlas and Gene Expression Omnibus databases. The differentially expressed genes (DEGs) of the poor and good prognosis groups were screened using the Linear Models for Microarray Data package, and the prognosis‑related genes were screened using univariate Cox regression analysis. A total of 206 significant DEGs were identified. Following univariate and multivariate Cox regression analysis, 14 genes significantly associated with prognosis were screened and six of these genes, including triggering receptor expressed on myeloid cells 2 (TREML2), cysteine‑glutamate transporter (SLC7A11), NACHT, LRR, and PYD domains‑containing protein 2 (NLRP2), DNA damage‑inducible transcript 4 protein (DDIT4), lymphocyte‑specific protein 1 (LSP1) and C‑type lectin domain family 11 member A (CLEC11A), were used to construct model equations for risk assessment. The prognostic scoring system was used to evaluate risk for each patient, and the results showed that patients in the low‑risk group had a longer survival time, compared with those in the high‑risk group (P=9.59e‑06 for the training dataset and P=0.00543 for the validation dataset). A total of eight main Kyoto Encyclopedia of Genes and Genomes pathways were identified, the top three of which were hematopoietic cell lineage, focal adhesion, and regulation of actin cytoskeleton. Taken together, the results showed that the scoring system established in the present study was credible and that the six genes were identified, which were significantly associated with the risk assessment of AML, offer potential as prognostic biomarkers. These findings may provide clues for further clarifying the pathogenesis of AML.


Figures

Figure 1
Figure 1
Overall analytical process of the study. TGCA, The Cancer Genome Atlas; AML, acute myeloid leukemia; GEO, Gene Expression Omnibus; KEGG, Kyoto Encyclopedia of Genes and Genomes.
Figure 2
Figure 2
Kaplan-Meier survival curves. Kaplan-Meier survival curves of high-risk and low-risk group samples in the (A) training dataset and (B) validation dataset.
Figure 3
Figure 3
Expression values of the six signature genes. Expression values of genes in the (A) training dataset and (B) validation dataset. Significant differences between low-risk samples (blue bar) and high-risk samples (red bar) are indicated (***P<0.005; *0.01≤P<0.05). TREML2, triggering receptor expressed on myeloid cells 2; SLC7A11, cysteine-glutamate transporter; NLRP, NACHT, LRR, and PYD domains-containing protein 2; DDIT4, DNA damage-inducible transcript 4 protein; LSP1, lymphocyte‑specific protein 1; CLEC11A, C‑type lectin domain family 11 member A.
Figure 4
Figure 4
KM survival curves in the low- and high-risk patient groups. (A) KM survival curves of patients (a) younger and (b) older than the median age (58 years). (B) KM curves of patients in the (a) IDH R132-negative group and (b) IDH R132-positive group, (C) KM curves of patients in the (a) FLT3 mutation-negative group and (b) FLT3 mutation-positive group. (D) KM curves of patients in the (a) NPMc-negative group and (b) NPMc-positive group. The high-risk group is denoted by red and purple curves, the low-risk group is denoted by black and blue curves. KM, Kaplan-Meier; L, low-risk; H, high-risk; IDH1 R132, isocitrate dehydrogenase (NADP+) 1, cytosolic R132; FLT3, FMS-like tyrosine kinase 3; NPMc, nucleophosmin mutation.
Figure 4
Figure 4
KM survival curves in the low- and high-risk patient groups. (A) KM survival curves of patients (a) younger and (b) older than the median age (58 years). (B) KM curves of patients in the (a) IDH R132-negative group and (b) IDH R132-positive group, (C) KM curves of patients in the (a) FLT3 mutation-negative group and (b) FLT3 mutation-positive group. (D) KM curves of patients in the (a) NPMc-negative group and (b) NPMc-positive group. The high-risk group is denoted by red and purple curves, the low-risk group is denoted by black and blue curves. KM, Kaplan-Meier; L, low-risk; H, high-risk; IDH1 R132, isocitrate dehydrogenase (NADP+) 1, cytosolic R132; FLT3, FMS-like tyrosine kinase 3; NPMc, nucleophosmin mutation.
Figure 5
Figure 5
Kaplan-Meier survival curves of age and prognosis. (A) Survival curves for low-risk patients aged below the median age (black curve) and above the median age (red curve). (B) Survival curves for high-risk patients aged below the median age (blue curve) and above the median age (purple curve). (C) Survival curves for all groups. L, low-risk; H, high-risk.
Figure 6
Figure 6
Risk score, overall survival and the gene expression values. (A) Training set (a) risk score, (b) overall survival and (c) expression values of six signature genes. (B) Validation set (a) risk score, (b) overall survival and (c) expression values of six signature genes. The abscissa values in Aa and b, and Ba and b indicate the sample number after sorting of the risk score from low to high. In Ab and Bb, the orange spots represent samples from deceased patients and the black spots represent samples from living patients.
Figure 7
Figure 7
Functional enrichment analysis of top 20 genes with significant positive and negative correlations. (A) GO function analysis of genes with significantly downregulated and upregulated expression; (B) Kyoto Encyclopedia of Genes and Genomes pathway analysis. GO, Gene Ontology.

Similar articles

Cited by

References

    1. Löwenberg B, Downing JR, Burnett A. Acute myeloid leukemia. N Engl J Med. 1999;1999:1051–1062. doi: 10.1056/NEJM199909303411407. - DOI - PubMed
    1. Siegel R, Naishadham D, Jemal A. Cancer statistics, 2013. CA Cancer J Clin. 2013;63:11–30. doi: 10.3322/caac.21166. - DOI - PubMed
    1. Siegel RL, Miller KD, Jemal A. Cancer statistics, 2016. CA Cancer J Clin. 2016;66:7–30. doi: 10.3322/caac.21332. - DOI - PubMed
    1. Coombs C, Tavakkoli M, Tallman M. Acute promyelocytic leukemia: Where did we start, where are we now, and the future. Blood Cancer J. 2015;5:e304. doi: 10.1038/bcj.2015.25. - DOI - PMC - PubMed
    1. Tallman MS, Gilliland DG, Rowe JM. Drug therapy for acute myeloid leukemia. Blood. 2005;106:1154–1163. doi: 10.1182/blood-2005-01-0178. - DOI - PubMed