Case Reports
. 2018 Jul 3;72(1):62-75.
doi: 10.1016/j.jacc.2018.04.041.

Genome Editing of Induced Pluripotent Stem Cells to Decipher Cardiac Channelopathy Variant

Affiliations
Case Reports

Genome Editing of Induced Pluripotent Stem Cells to Decipher Cardiac Channelopathy Variant

Priyanka Garg et al. J Am Coll Cardiol. .

Abstract

Background: The long QT syndrome (LQTS) is an arrhythmogenic disorder of QT interval prolongation that predisposes patients to life-threatening ventricular arrhythmias such as Torsades de pointes and sudden cardiac death. Clinical genetic testing has emerged as the standard of care to identify genetic variants in patients suspected of having LQTS. However, these results are often confounded by the discovery of variants of uncertain significance (VUS), for which there is insufficient evidence of pathogenicity.

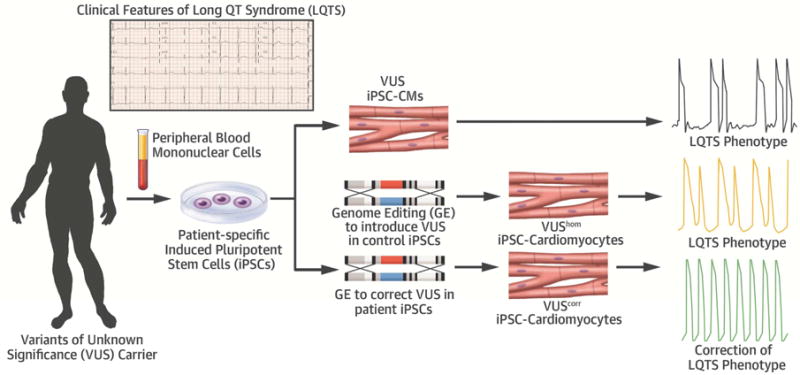
Objectives: The purpose of this study was to demonstrate that genome editing of patient-specific induced pluripotent stem cells (iPSCs) can be a valuable approach to delineate the pathogenicity of VUS in cardiac channelopathy.

Methods: Peripheral blood mononuclear cells were isolated from a carrier with a novel missense variant (T983I) in the KCNH2 (LQT2) gene and an unrelated healthy control subject. iPSCs were generated using an integration-free Sendai virus and differentiated to iPSC-derived cardiomyocytes (CMs).

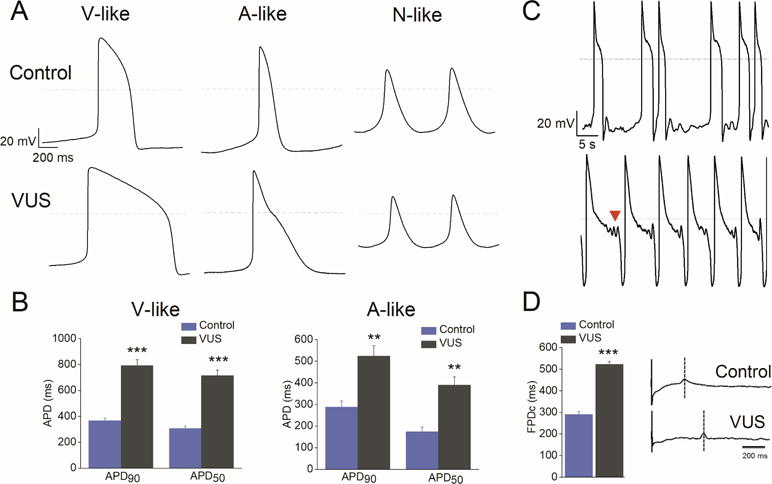
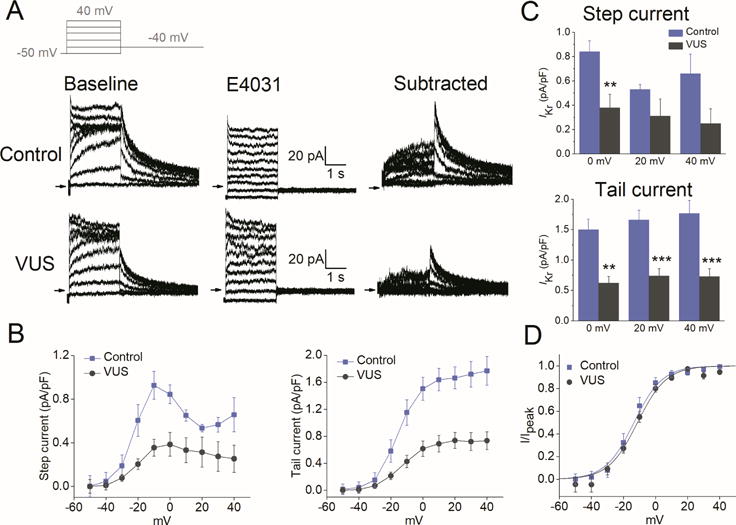
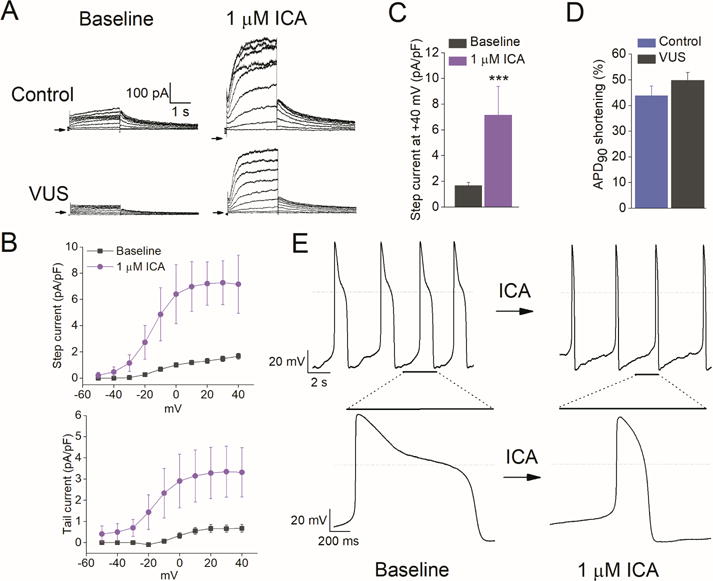
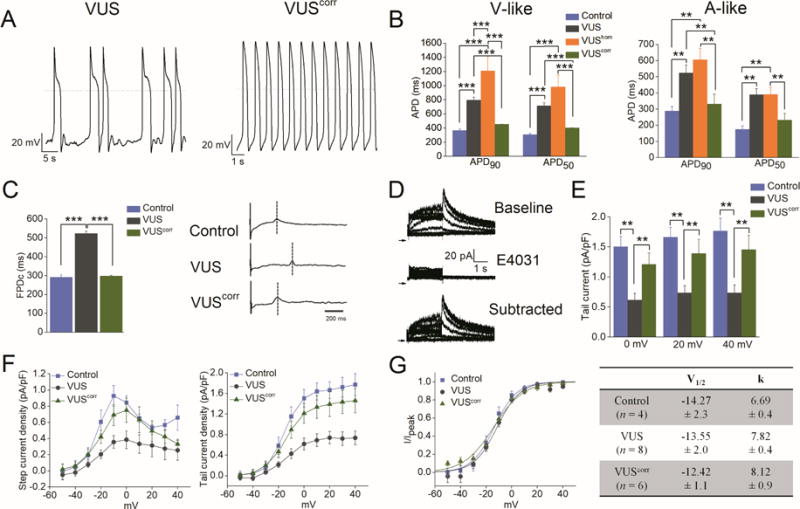
Results: Whole-cell patch clamp recordings revealed significant prolongation of the action potential duration (APD) and reduced rapidly activating delayed rectifier K+ current (IKr) density in VUS iPSC-CMs compared with healthy control iPSC-CMs. ICA-105574, a potent IKr activator, enhanced IKr magnitude and restored normal action potential duration in VUS iPSC-CMs. Notably, VUS iPSC-CMs exhibited greater propensity to proarrhythmia than healthy control cells in response to high-risk torsadogenic drugs (dofetilide, ibutilide, and azimilide), suggesting a compromised repolarization reserve. Finally, the selective correction of the causal variant in iPSC-CMs using CRISPR/Cas9 gene editing (isogenic control) normalized the aberrant cellular phenotype, whereas the introduction of the homozygous variant in healthy control cells recapitulated hallmark features of the LQTS disorder.

Conclusions: The results suggest that the KCNH2T983I VUS may be classified as potentially pathogenic.

Keywords: arrhythmia; genome editing; induced pluripotent stem cells; long QT syndrome; variant of uncertain significance.


Conflict of interest statement

Conflicts of interest: The authors have no conflicts of interest to disclose.

Figures

Figure 1
Figure 1. Family pedigree and generation of patient-specific iPSC lines
(A) Pedigree of VUS patient. Proband (arrow) was diagnosed with LQTS after presenting with prolonged QTc (507 ms) on (B) surface electrocardiogram. (C) Schematic representation of KCNH2 channel protein. Red star denotes approximate location of the LQTS variant T983I in the C terminus. cNBHD, cyclic nucleotide binding homology domain (D) Representative immunostaining of pluripotency markers SOX2 (green) and NANOG (red) in iPSC clone derived from the VUS patient. DAPI staining (blue) indicates the nucleus.
Figure 2
Figure 2. Patient-specific VUS iPSC-CMs exhibit characteristic LQTS signatures
(A) AP recordings from control and VUS iPSC-CMs showing ventricular (V)-like, atrial (A)-like, and nodal (N)-like morphologies. Notice the marked APD prolongation in both V-like and A-like VUS iPSC-CMs. (B) The action potential duration (APD) measured at 50% (APD50) and 90% repolarization (APD90) in VUS (grey, n = 119) and healthy control (blue, n = 49) A-like and V-like iPSC-CMs. ***p<0.001 when compared to control cells. Error bars show S.E.M. (C) Development of spontaneous arrhythmogenicity in VUS iPSC-CMs manifested as beat irregularity (top) or EADs indicated by arrowhead (bottom). (D) Left panel, summary of rate-matched Fridericia’s corrected field potential duration (FPDc) values of VUS iPSC-CMs (grey, n = 7) and healthy control (blue, n = 7). FPDc = FPD/(Beat Period)^0.3333. Error bars show S.E.M. ***p<0.001. Right panel, representative MEA recordings from healthy control (top) and VUS (bottom) iPSC-CM monolayer.
Figure 3
Figure 3. Single-cell voltage-clamp recordings revealed reduced IKr density in VUS iPSC-CMs
(A) Voltage-clamp recordings of IKr, measured from healthy control (top) and VUS (bottom) iPSC-CMs. Left, baseline recordings. Middle, recording following administration of E-4031 (2 μM). Right, E-4031-sensitive current (IKr) defined by digital subtraction of the two currents. Inset: voltage clamp protocol. (B) Average current–voltage (I–V) relationships for IKr (left, step current measured at the end of the test pulses and right, peak tail current) in control (blue) and VUS (grey) iPSC-CMs. (C) Summary of the step current (top) and peak tail current (bottom) for IKr density in pA/pF from healthy control (blue; n = 4) and VUS iPSC-CMs (grey; n = 8) at membrane potentials of 0, +20, and +40 mV (**p<0.01, ***p<0.001). (D) Average peak tail current normalized to the maximal current following repolarization to −40 mV (I/Ipeak) in healthy control (blue) and VUS (grey) iPSC-CMs. Mean values ± S.E.M. are shown. V1/2 = - 13.55 ± 2.0 mV for VUS vs. −14.27 ± 2.3 mV for healthy control. Comparison of iPSC lines was performed with one-way ANOVA, p<0.05 being considered statistically significant.
Figure 4
Figure 4. ICA-105574 enhanced IKr density and normalized prolonged APD in VUS iPSC-CMs
(A) Representative IKr traces in healthy control (top) and VUS (bottom) iPSC-CMs at baseline (left) and after application of 1 μM ICA-105574, a KCNH2 channel agonist. (B) Average I-V curves for IKr step current (top) and peak tail current (bottom) density in pA/pF at baseline (grey) and after application of 1 μM ICA-105574 (pink) in VUS iPSC-CMs. (C) Summary of average step current density at +40 mV for baseline and 1 μM ICA-105574 in VUS iPSC-CMs (n = 7, ***p<0.001). (D) Summary of % APD90 shortening induced by ICA-105574 for healthy control and VUS iPSC-CMs (n = 7, p>0.05). (E) AP recordings at baseline (left) and in the presence of 1 μM ICA-105574 (right). Note the severely prolonged APD in VUS iPSC-CMs before application of ICA-105574. Expanded view highlighting a single AP is shown at the bottom.
Figure 5
Figure 5. Patient-specific VUS iPSC-CMs and classical pathogenic LQT2-A561V iPSC-CMs displayed enhanced susceptibility to dofetilide-induced proarrhythmia
(A) Representative recordings showing dose-dependent effect of dofetilide (Dof) on AP from healthy control (left), VUS (middle), and classical pathogenic LQT2-A561V (right) iPSC-CMs (black = baseline; red = 3 nmol/L; blue = 10 nmol/L; green = 30 nmol/L; orange = 100 nmol/L). Arrowheads indicate dofetilide-induced EADs. VUS and LQT2-A561V iPSC-CMs were observed to exhibit dofetilide-induced EADs at lower concentrations (10 nmol/L) as compared with control iPSC-CMs (30 nmol/L). (B) Aligned APs showing the effects of dofetilide on control, VUS, and LQT2-A561V iPSC-CMs, respectively (n = 4). (C) Percentage increase in steady-state prolongation of APD90 by dofetilide at different concentrations for control, VUS, and LQT2-A561V iPSC-CMs. *p<0.05.
Figure 6
Figure 6. Genome-edited homozygous iPSC-CMs (VUShom) displayed potentiated LQTS phenotype
(A) Representative AP recordings from VUShom iPSC-CMs showing V-like, A-like, and A-like-EAD waveforms. Notice the marked APD prolongation in both V-like and A-like iPSC-CMs. (B) The APD90, and APD50 values in control (blue, n = 49), VUS (grey, n = 119), and VUShom (orange, n = 29) atrial-like and ventricular-like iPSC-CMs. **p<0.01, ***p<0.001 when compared to healthy control iPSC-CMs. Error bars show S.E.M. (C) Development of spontaneous arrhythmogenicity in VUShom iPSC-CMs manifested as EADs (left) or triggered beat (right).
Figure 7
Figure 7. Genome-edited corrected iPSC-CMs (VUScorr) showed rescue of abnormal phenotype
(A) Representative AP recordings from (left) VUS and (right) VUScorr iPSC-CMs. (B) Summary of APD90 and APD50 from control (blue), VUS (grey), VUShom (orange), and VUScorr(green) iPSC-CMs (**p<0.01, ***p<0.001). (C) Left panel, summary of rate-matched Fridericia’s corrected field potential duration (FPDc) values from control (blue), VUS (grey), and VUScorr (green) iPSC-CMs (n = 7). FPDc = FPD/(Beat Period)^0.3333. Error bars show S.E.M. ***p<0.001. Right panel, representative MEA recordings from control (top), VUS (middle), and VUScorr (bottom) iPSC-CM monolayer. (D) Single cell voltage-clamp recordings of IKr, measured from VUScorr iPSC-CMs. Top, baseline recordings. Middle, recording following administration of E-4031 (2 μM). Bottom, E-4031-sensitive current (IKr) defined by digital subtraction of the two currents. (E) Summary of peak tail IKr density in pA/pF from control (blue; n = 4), VUS (grey; n = 8), and VUScorr (green; n = 6) iPSC-CMs at membrane potentials; 0, +20, and +40 mV (**p<0.01). (F) Average I-V curves for IKr step current (left) and tail current (right) density in pA/pF for control (blue), VUS (grey), and VUScorr (green) iPSC-CMs. (G) Left panel, average peak tail current normalized to the maximal current following repolarization to −40 mV (I/Ipeak) in control (blue), VUS (grey), and VUScorr (green) iPSC-CMs. Right panel, summary of V1/2 and k parameters of IKr compared for control, VUS, and VUScorr iPSC-CMs. Mean values ± S.E.M. are shown. Comparison of iPSC lines was performed with one-way ANOVA, p<0.05 being considered statistically significant.
Central Illustration
Central Illustration. Patient-in-a-dish platform for elucidating VUS pathogenicity
Patient-specific iPSC-CMs generated from a VUS (KCNH2T983I) carrier exhibited prolonged APD due to reduced IKr density compared to healthy control (black trace). Introduction of the homozygous variant in the healthy control iPSCs recapitulated a severe LQTS phenotype (orange trace) whereas correction of the VUS in patient iPSCs rescued the observed electrophysiological abnormalities (green trace). Thus genome editing of iPSC-CMs can potentially offer a unique precision medicine approach to decipher VUS pathogenicity in a dish. This robust approach may bring a major advancement in the care of LQTS patients to improve their quality of life and appropriately manage their risk of sudden death.

Comment in

References

    1. Schwartz PJ, Stramba-Badiale M, Crotti L, et al. Prevalence of the congenital long-QT syndrome. Circulation. 2009;120:1761–7. - PMC - PubMed
    1. Schwartz PJ, Crotti L, Insolia R. Long-QT syndrome: from genetics to management. Circ Arrhythm Electrophysiol. 2012;5:868–77. - PMC - PubMed
    1. Roden DM. Clinical practice. Long-QT syndrome. N Engl J Med. 2008;358:169–76. - PubMed
    1. Anderson ME. “We are not alone”: ion channel mutations in a long QT syndrome cohort. Heart Rhythm. 2005;2:1106–7. - PubMed
    1. Giudicessi JR, Ackerman MJ. Genetic testing in heritable cardiac arrhythmia syndromes: differentiating pathogenic mutations from background genetic noise. Curr Opin Cardiol. 2013;28:63–71. - PMC - PubMed

Publication types

Substances