. 2018 Jun 28;174(1):131-142.e13.
doi: 10.1016/j.cell.2018.05.059.

Size-Dependent Segregation Controls Macrophage Phagocytosis of Antibody-Opsonized Targets

Affiliations

Size-Dependent Segregation Controls Macrophage Phagocytosis of Antibody-Opsonized Targets

Matthew H Bakalar et al. Cell. .

Abstract

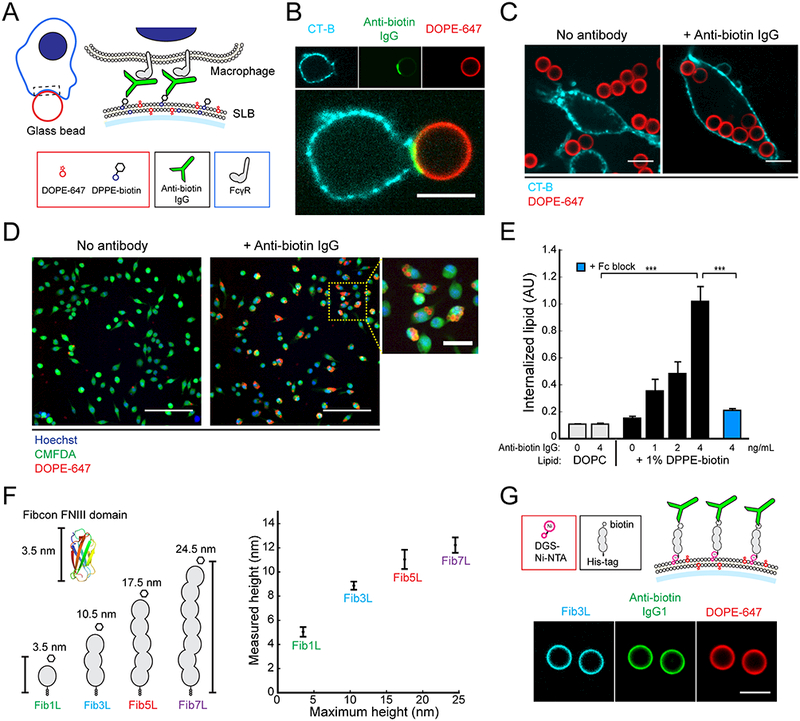
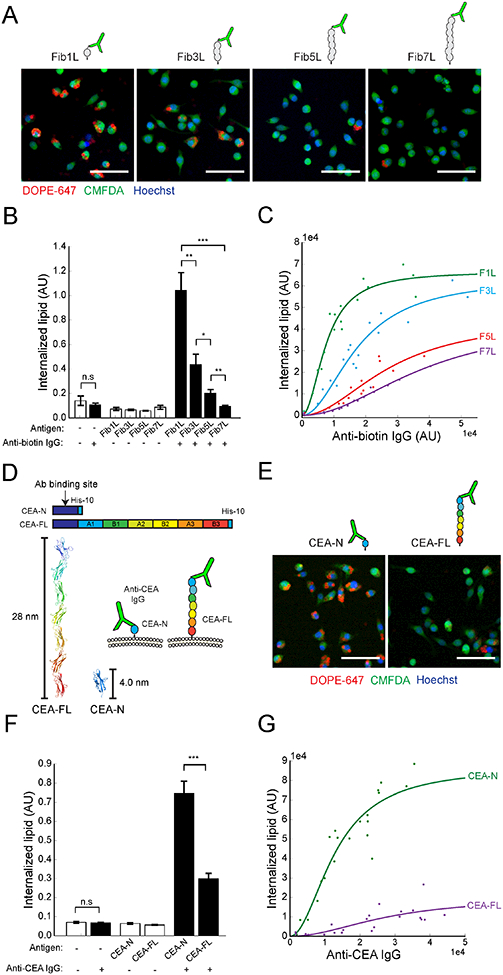
Macrophages protect the body from damage and disease by targeting antibody-opsonized cells for phagocytosis. Though antibodies can be raised against antigens with diverse structures, shapes, and sizes, it is unclear why some are more effective at triggering immune responses than others. Here, we define an antigen height threshold that regulates phagocytosis of both engineered and cancer-specific antigens by macrophages. Using a reconstituted model of antibody-opsonized target cells, we find that phagocytosis is dramatically impaired for antigens that position antibodies >10 nm from the target surface. Decreasing antigen height drives segregation of antibody-bound Fc receptors from the inhibitory phosphatase CD45 in an integrin-independent manner, triggering Fc receptor phosphorylation and promoting phagocytosis. Our work shows that close contact between macrophage and target is a requirement for efficient phagocytosis, suggesting that therapeutic antibodies should target short antigens in order to trigger Fc receptor activation through size-dependent physical segregation.

Keywords: CD45; Fc receptor; ITAM; antibody; antigen; cancer immunotherapy; immune modulation; kinetic segregation model; macrophages; phagocytosis; protein segregation.


Conflict of interest statement

Declaration of Interests

The authors declare no competing interests.

Figures

Figure 1.
Figure 1.. Reconstitution of a cell-like target particle for FcγR-mediated phagocytosis.
(A) Target particles assembled in vitro from glass beads coated in a fluid supported lipid bilayer (lipid composition: DOPC, 0.2% DOPE-647, up to 2% DPPE-biotin). Anti-biotin IgG in solution binds fluidly to the lipid surface through interaction between the antigen-binding region of IgG and the biotin head-group of DPPE-biotin. Contact between a macrophage and a target particle leads to binding between FcγRs on the macrophage surface and the Fc region of anti-biotin IgG. (B) Confocal fluorescence images (60×) of a RAW 264.7 macrophage-like cell at a contact interface with a 6.46 μm target particle. The macrophage membrane (cyan) is labeled with cholera-toxin B 555. Target particle membrane (red) contains fluorescent DOPE-647. Scale bar is 5 μm. (C) 3.78 μm target particles containing only lipid (left) or pre-incubated with 4 ng/mL anti-biotin IgG (right) are added to a well containing RAW 264.7 cells. Scale bar is 10 μm. (D) Representative confocal fluorescence images (20×) of a field-of-view (FOV) from the imaging-based phagocytosis assay. Cells are labeled with 0.5 μM CellTracker Green (CMFDA) and 10 μg/mL Hoechst 33342. Scale bar is 100 μm for large field of view (FOV), 25 μm for zoom-in. (E) Quantification of fluorescence from internalized beads. Error bars are standard error across 6 independent wells. For each well, internalized lipid is an average quantification of N > 250 cells. P-values are two-sample Student’s T-test, where ***p < .001. (F) A size-variant antigen family is constructed from repeats of the Fibcon synthetic FNIII domain (pdb 3TEU). Proteins in the family are named FiblL, Fib3L, Fib5L, and Fib7L, and in a fully extended configuration have heights of 3.5 nm, 10.5 nm, 17.5 nm, 24.5 nm respectively (‘maximum height’) (left). The distance between the lipid bilayer and the N-terminus of the antigen was measured using a one-dimensional fluorescence localization method (‘measured height’) (right) (see Experimental Procedures). The N-terminal height above the bilayer for FiblL, Fib3L, Fib5L, and Fib7L was 5.0 +/− 0.40 nm, 8.9 +/− 0.34 nm, 11.0 +− 0.8 nm, and 12.2 +/− 0.64 nm respectively. Error bars are standard deviation over N > 12 beads. (G) Fibcon proteins with a C-terminal His-tag were N-terminally labeled with biotin to construct synthetic protein antigens that bind fluidly to a SLB coated bead containing 0.8% DGS-Ni-NTA lipid (top). Confocal fluorescence images (20×) of Fib3L antigen coated and anti-biotin IgG opsonized target particles (bottom). Scale bar is 5 μm. See also Figure SI and Figure S2.
Figure 2.
Figure 2.. Phagocytosis of antibody-opsonized target particles is antigen-height dependent.
(A) Representative confocal fluorescence images (20×) of phagocytosis of target particles bound with biotinylated FiblL, Fib3L, Fib5L, and Fib7L protein antigen and opsonized with 4 ng/mL anti-biotin IgG. Cells are labeled with 0.5 μM CellTracker Green (CMFDA) and 10 μg/mL Hoechst 33342. Scale bar is 50 μm. (B) Microscopy quantification of phagocytosis for Fib1L, Fib3L, Fib5L, and Fib7L target particles. Error bars represent standard error across 9 independent wells. For each well, internalized lipid is an average quantification of N > 330 cells. P-values are two-sample Student’s T-test, where *P < 0.05, **P < 0.01, ***p < 0.001. (C) Flow-cytometry quantification of phagocytosis for Fib1L, Fib3L, Fib5L, and Fib7L targets at increasing anti-biotin IgG concentrations. Data points corresponds to an independent well with N > 8000 cells. IgG fluorescence intensity (anti-biotin IgG, Alexa Fluor 488) was pre-measured via flow cytometry from a sample of target particles (N > 3500 beads). Each set of data points is fit with a hill equation with a coefficient of 2 using the equation f(x) = (ymax*x2) / (kd + x2). (D) Full-length CEACAM5 (CEA-FL, 28.0 nm) and truncated CEACAM5 consisting of the N-terminal domain (CEA-N, 4.0 nm). A pan-CEACAM IgG1 antibody (anti-CEA IgG) (D14HD11) binds to the shared N-terminal domain. (E) Representative confocal fluorescence images (20×) of phagocytosis of target particles bound with CEA-N and CEA-FL antigen opsonized with 4 ng/mL anti-CEA IgG. Cells are labeled with 0.5 μM CellTracker Green (CMFDA) and 10 μg/mL Hoechst 33342. Scale bar is 50 μm. (F) Microscopy quantification of phagocytosis for CEA-N and CEA-FL target particles. Error bars are standard error across 9 independent wells. For each well, internalized lipid is an average quantification of N > 420 cells. P-values are two-sample Student’s T-test, where ***p < 0.001. (G) Flow-cytometry quantification of phagocytosis for CEA-N and CEA-FL targets across a range of bound anti-CEA IgG concentrations. IgG fluorescence intensity (anti-CEA IgG, PE) was pre-measured via flow cytometry from a sample of beads (N > 3500 beads). Each set of data points is fit with a Hill equation with a coefficient of 2 using the equation f(x) = (ymax*x2) / (kd + x2).
Figure 3.
Figure 3.. Fc receptor phosphorylation decreases with increasing antigen height.
(A) A live-cell sensor of ITAM phosphorylation (pITAM sensor). The sensor consists of a N-terminal mCherry fluorescent protein flexibly linked to the tandem-SH2 domains of Syk kinase. Upon phosphorylation of FcγR ITAM by Src family kinases, the sensor protein is recruited to the phosphorylated ITAM through the tandem-SH2 domains. (B) TIRF microscopy of the interface between a macrophage and an antibody opsonized planar supported lipid bilayer enables high-resolution visualization of protein spatial organization at the contact site. (C) TIRF microscopy (lOOx) images of the contact interface between a macrophage and a supported lipid bilayer bound with Fib1L (top) or Fib7L antigen and opsonized with anti-biotin IgG. Scale bar is 10 μm. (D) Quantification of TIRF signal from pITAM sensor across the membrane-contact area at macrophage-SLB contact sites for FiblL, Fib3L, Fib5L, and Fib7L bound SLBs. Error bars are standard deviation over N > 180 cells from three independent trials. P-values are two-sample Student’s T-test on the mean value from independent trials, where **P < 0.01. (E) Quantification of mean TIRF signal from anti-biotin IgG (Alexa Fluor 488) from high-intensity clusters within the membrane-contact area at macrophage-SLB contact sites for Fib1L and Fib7L bound SLBs. Error bars are standard deviation from N > 18 cells. P-values are two-sample Student’s T-test, where ***p < 0.001. (F) TIRF images of antibiotin IgG (green, Alexa Fluor 488) and pITAM sensor (red) at macrophage-SLB contacts for Lat-A treated cells (left). Quantification of TIRF signal from pITAM sensor across the membrane-contact area at macrophage-SLB contacts for Lat-A treated cells (right). Scale bar is 10 μm. Error bars are standard deviation over N > 600 cells from three independent trials. P-values are two-sample Student’s T-test on the mean value from independent trials, where *P < 0.05. (G) Quantification of TIRF signal from pITAM sensor across the membrane-contact area for Lat-A treated cells contacting SLBs bound with CEA-N and CEA-FL antigen and opsonized with anti-CEA IgG. Error bars are standard error over 3 independent wells with mean intensity computed from N > 200 cells for each well. P-values are two-sample Student’s T-test on the mean value from independent trials, where *P < 0.05. See also Figure S3.
Figure 4.
Figure 4.. Receptor activation is dependent on height rather than receptor density.
(A) Giant plasma membrane vesicles (GPMVs) are formed by treating adhered macrophages to induce membrane blebbing and vesiculation. GPMVs dropped onto an opsonized supported lipid bilayer triggers binding between FcγR in the GPMVs and antibody on the SLB. (B) TIRF microscopy (lOOx) images of GPMV-SLB contacts at anti-biotin IgG opsonized SLBs for Fib1L, Fib3L, Fib5L, and Fib7L show a decrease in anti-biotin IgG (green, Alexa Fluor 488) intensity at the contact site with increasing antigen height. Anti-biotin IgG enrichment is calculated as the ratio of intensity within the GPMV-SLB contact site (in) and outside the contact site (out). Scale bar is 5 μm. (C) Quantification of anti-biotin IgG enrichment at GPMV-SLB contacts for Fib1L, Fib3L, Fib5L, and Fib7L bound SLBs. Error bars are standard deviation over N > 180 GPMVs from three independent trials. P-values are two-sample Student’s T-test on the mean value from independent trials, where *P < 0.05. (D) Quantification of pITAM sensor intensity in TIRF as a function of anti-biotin IgG at single GPMV contacts for Fib1L and Fib7L bound SLBs. Points are binned along the x-axis into three equally spaced bins by Anti-biotin (AU) value. Error bars are standard error over a minimum of 4 and a maximum of 13 binned cells. P-values are two-sample Student’s T-test on the mean value from independent trials, where **P < 0.01.
Figure 5.
Figure 5.. Phosphatase exclusion from antibody-FcγR clusters is antigen-height dependent.
(A) Live-cell TIRF microscopy (100×) images at the macrophage-SLB contact interface for SLBs bound with FiblL and Fib7L opsonized with anti-biotin IgG. For FiblL SLBs (top), anti-biotin IgG (green, Alexa Fluor 488) is clustered at the cell-SLB interface, while CD45 (red, anti-CD45 Alexa Fluor 647) is segregated from IgG clusters. A line-scan through a region of the interface shows an anti-correlation between anti-biotin IgG and CD45 localization. For Fib7L SLBs (bottom), anti-biotin IgG is similarly clustered at the cell-SLB interface, however CD45 is not segregated from high-intensity IgG clusters. A line-scan through a region of the interface shows correlation between anti-biotin IgG and CD45 localization. Scale bar is 15 μm. (B) TIRF microscopy (100×) images at the GPMV-SLB contact interface for SLBs bound with DPPE-biotin, FiblL, Fib3L, Fib5L, and Fib7L antigens. Anti-biotin IgG (green, Alexa Fluor 488) is enriched at the contact interface for each antigen. CD45 (red, anti-CD45 Alexa Fluor 647) is excluded in a size-dependent manner from DPPE-biotin and FiblL, but not Fib3L, Fib5L, and Fib7L, GPMV-SLB contacts. Scale bar is 5 μm. (C) Quantification of the Pearson’s correlation coefficient between anti-biotin IgG (green) and anti-CD45 (red) channels for individual GPMV-SLB contacts. CD45 segregation, corresponding to a Pearson’s correlation coefficient of ~0, is evident for DPPE-biotin and FiblL antigens, but not for Fib3L, Fib5L, and Fib7L GPMV-SLB contacts. Box and whiskers denote inner quartile range and full range excluding outliers (> 1.5 quartile range). (D) Model of size-dependent segregation of CD45 at contact sites formed by FcγR-IgG binding. The FcγR-IgG complex spans ~11.5 nm, while CD45RO is ~22.5 nm tall. The membrane-membrane distance enforced by the FcγR-IgG-FiblL complex is ~15.0 nm.
Figure 6.
Figure 6.. Truncation of the CD45 ectodomain using CRISPR/Cas9 disrupts phagocytosis.
(A) Truncation of the CD45 ectodomain using CRISPR/Cas9 genome editing. Dual cutting by independent guide RNAs within intronic regions flanking the first coding exon results in excision of the genomic region coding for the variable mucin domain and dl-d2 FNIII domains of CD45. Repair by non-homologous end-joining results in a gene coding for CD45 with a truncated ectodomain and the native transmembrane domain and tandem phosphatase domains of CD45. (B) Confocal fluorescence images (60×) of CD45 wild-type RAW 264.7 cells (left) and CD45 D3-D4 RAW 264.7 cells (right) incubated with FiblL antigen and anti-biotin opsonized target particles. Scale bar is 20 μm. (C) Quantification of phagocytosis for CD45 wild-type and CD45 D3-D4 cells. Error bars are standard error over 3 independent wells. For each well, internalized lipid is an average quantification of N > 250 cells. P-values are two-sample Student’s T-test, where ***p < 0.001. (D) A model of the inhibition of phagocytosis by CD45 D3-D4. Truncation of the CD45 ectodomain reduces its height from −22.5 nm to −7.0 nm. An interface formed by FcγR-IgG-FiblL binding spans −15.0 nm, which is sufficiently close to segregate wild-type CD45, reducing the local concentration of the phosphatase at sites of FcγR-IgG and triggering phosphorylation and activation of the macrophage. However, CD45 D3-D4 is −8 nm shorter than the interface, and thus is not segregated from the contact site. The failure to segregate CD45 D3-D4 upon FcγR-IgG binding leaves a higher local concentration of CD45 phosphatase at the contact site, suppressing phosphorylation and inhibiting phagocytosis. See also Figure S4 and Figure S5.

References

    1. Williams AF, and Barclay AN (1988). The Immunoglobulin Superfamily—Domains for Cell Surface Recognition. Annu. Rev. Immunol 6, 381–405. - PubMed
    1. Akira S, and Takeda K (2004). Toll-like receptor signalling. Nat. Rev. Immunol 4, 499–511. - PubMed
    1. Anton van der Merwe P, Davis SJ, Shaw AS, and Dustin ML (2000). Cytoskeletal polarization and redistribution of cell-surface molecules during T cell antigen recognition. Semin. Immunol 12, 5–21. - PubMed
    1. Baselga J (2001). Clinical trials of Herceptin® (trastuzumab). Eur. J. Cancer 37, 1824. - PubMed
    1. Beauchemin N, and Arabzadeh A (2013). Carcinoembryonic antigen-related cell adhesion molecules (CEACAMs) in cancer progression and metastasis. Cancer Metastasis Rev. 32, 643–671. - PubMed

Publication types

MeSH terms