

Evaluation of 2D Imaging Schemes for Pulsed Arterial Spin Labeling of the Human Kidney Cortex
- PMID: 29958409
- PMCID: PMC6165477
- DOI: 10.3390/diagnostics8030043
Evaluation of 2D Imaging Schemes for Pulsed Arterial Spin Labeling of the Human Kidney Cortex
Abstract
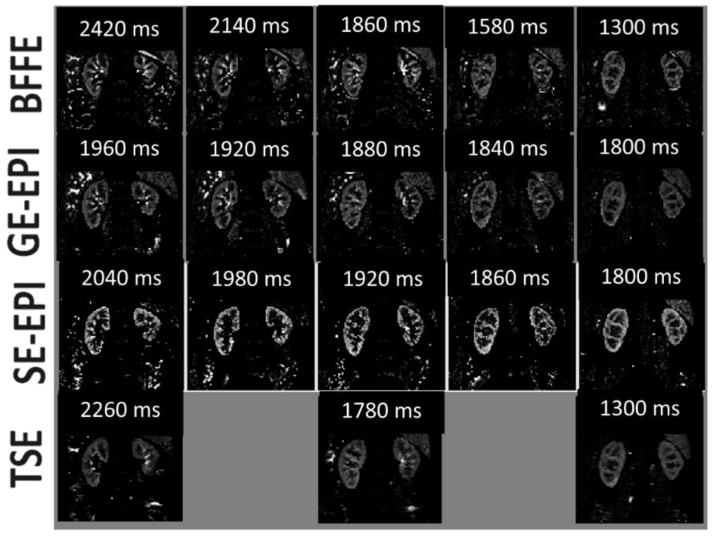
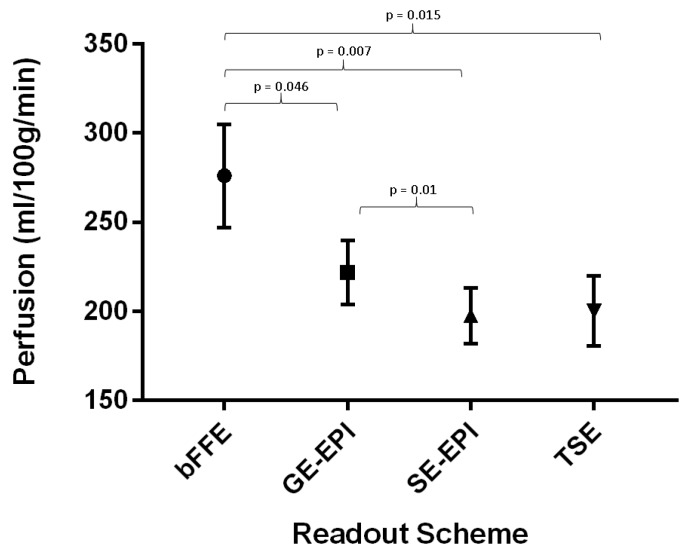
A number of imaging readout schemes are proposed for renal arterial spin labeling (ASL) to quantify kidney cortex perfusion, including gradient echo-based methods of balanced fast field echo (bFFE) and gradient-echo echo-planar imaging (GE-EPI), or spin echo-based schemes of spin-echo echo-planar imaging (SE-EPI) and turbo spin-echo (TSE). Here, we compare these two-dimensional (2D) imaging schemes to evaluate the optimal imaging scheme for pulsed ASL (PASL) assessment of human kidney cortex perfusion at 3 T. Ten healthy volunteers with normal renal function were scanned using each 2D multi-slice imaging scheme, in combination with a respiratory triggered flow-sensitive alternating inversion recovery (FAIR) ASL scheme on a 3 T Philips Achieva scanner. All volunteers returned for a second identical scan session within two weeks of the first scan session. Comparisons were made between the imaging schemes in terms of perfusion-weighted image (PWI) signal-to-noise ratio (SNR) and perfusion quantification, temporal SNR (tSNR), spatial coverage, and repeatability. For each imaging scheme, the renal cortex perfusion was calculated (bFFE: 276 ± 29 mL/100g/min, GE-EPI: 222 ± 18 mL/100g/min, SE-EPI: 201 ± 36 mL/100g/min, and TSE: 200 ± 20 mL/100g/min). Perfusion was found to be higher for GE-based readouts when compared with SE-based readouts, with significantly higher measured perfusion for the bFFE readout when compared with all other schemes (p < 0.05), attributed to the greater vascular signal present. Despite the PWI-SNR being significantly lower for SE-EPI when compared with all other schemes (p < 0.05), the SE-EPI readout gave the highest tSNR, and was found to be the most reproducible scheme for the assessment of kidney cortex, with a coefficient of variation (CoV) of 17.2%, whilst minimizing variability of the perfusion-weighted signal across slices for whole-kidney perfusion assessment. For the assessment of kidney cortex perfusion using 2D readout schemes, SE-EPI provides optimal tSNR, minimal variability across slices, and repeatable data acquired in a short scan time with low specific absorption rate.
Keywords: arterial spin labeling; magnetic resonance imaging (MRI); perfusion; renal ASL; renal MRI.
Conflict of interest statement
The authors declare no conflict of interest.
Figures


References
-
- Gardener A., Francis S. Multi-slice kidney perfusion using SE-EPI FAIR: Optimised acquisition and analysis strategies; Proceedings of the 17th Scientific Meeting, International Society for Magnetic Resonance in Medicine; Honolulu, HI, USA. 18–24 April 2009; p. 2035.
-
- Gillis K.A., McComb C., Foster J.E., Taylor A.H.M., Patel R.K., Morris S.T.W., Jardine A.G., Schneider M.P., Roditi G.H., Delles C., et al. Inter-study reproducibility of arterial spin labelling magnetic resonance imaging for measurement of renal perfusion in healthy volunteers at 3 Tesla. BMC Nephrol. 2014;15:23. doi: 10.1186/1471-2369-15-23. - DOI - PMC - PubMed
LinkOut - more resources
Full Text Sources
Other Literature Sources
Molecular Biology Databases
