Comparative Study
. 2018 Jun 29;11(1):37.
doi: 10.1186/s13072-018-0205-1.

Consistent inverse correlation between DNA methylation of the first intron and gene expression across tissues and species

Affiliations
Comparative Study

Consistent inverse correlation between DNA methylation of the first intron and gene expression across tissues and species

Dafni Anastasiadi et al. Epigenetics Chromatin. .

Abstract

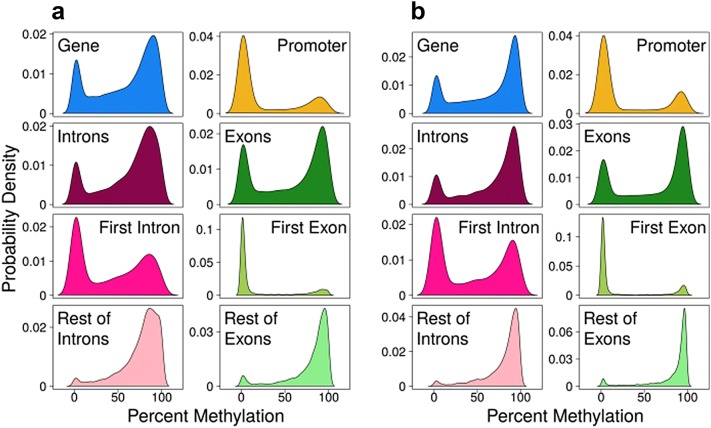
Background: DNA methylation is one of the main epigenetic mechanisms for the regulation of gene expression in eukaryotes. In the standard model, methylation in gene promoters has received the most attention since it is generally associated with transcriptional silencing. Nevertheless, recent studies in human tissues reveal that methylation of the region downstream of the transcription start site is highly informative of gene expression. Also, in some cell types and specific genes it has been found that methylation of the first intron, a gene feature typically rich in enhancers, is linked with gene expression. However, a genome-wide, tissue-independent, systematic comparative analysis of the relationship between DNA methylation in the first intron and gene expression across vertebrates has not been explored yet.

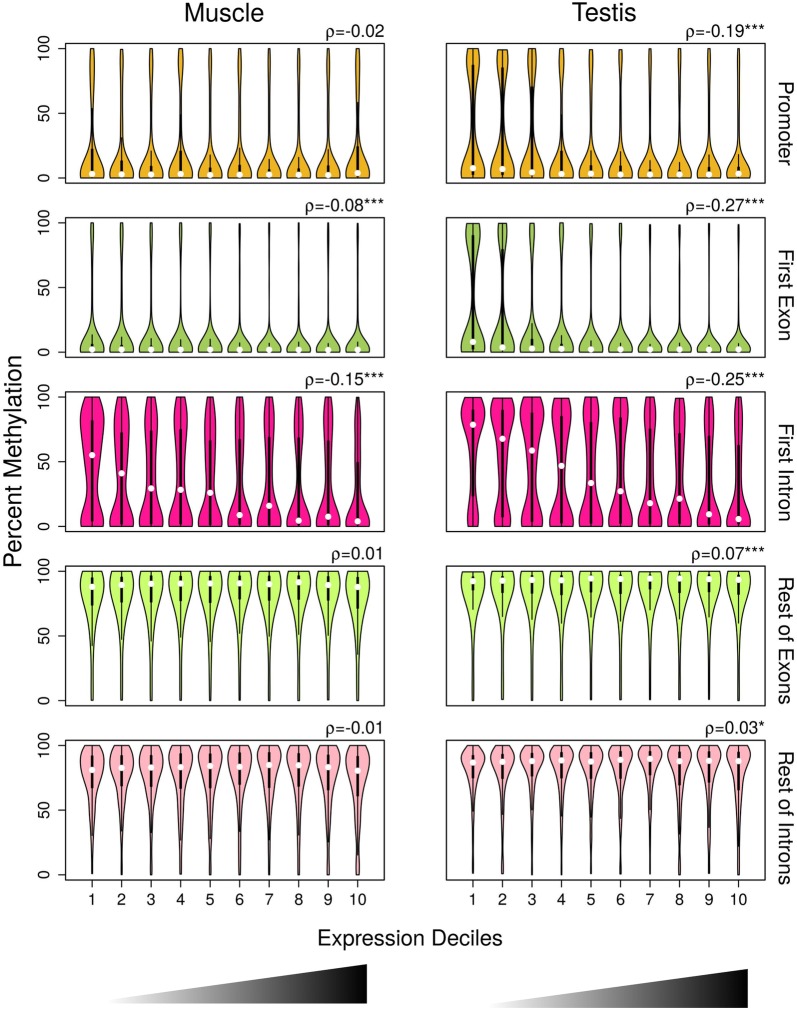
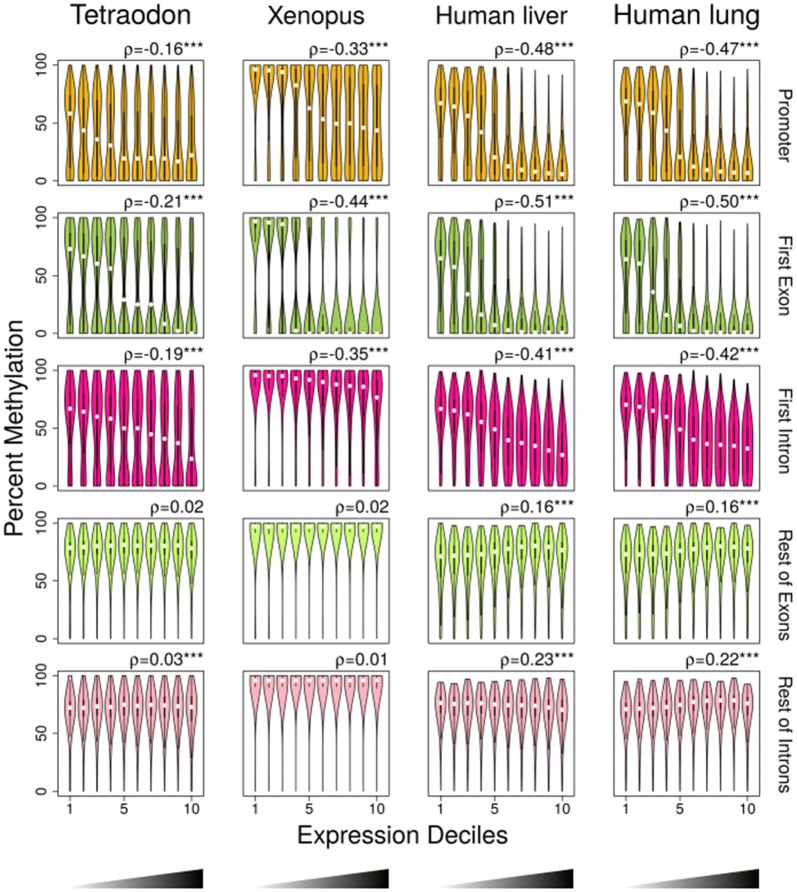
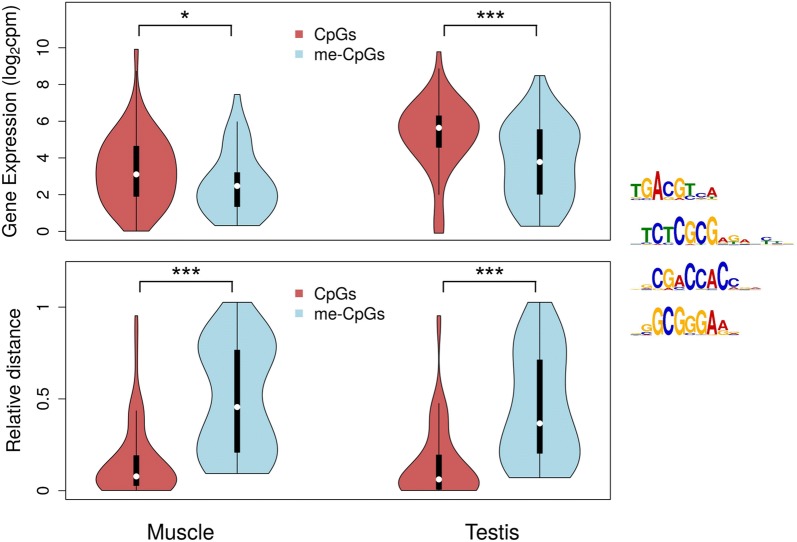
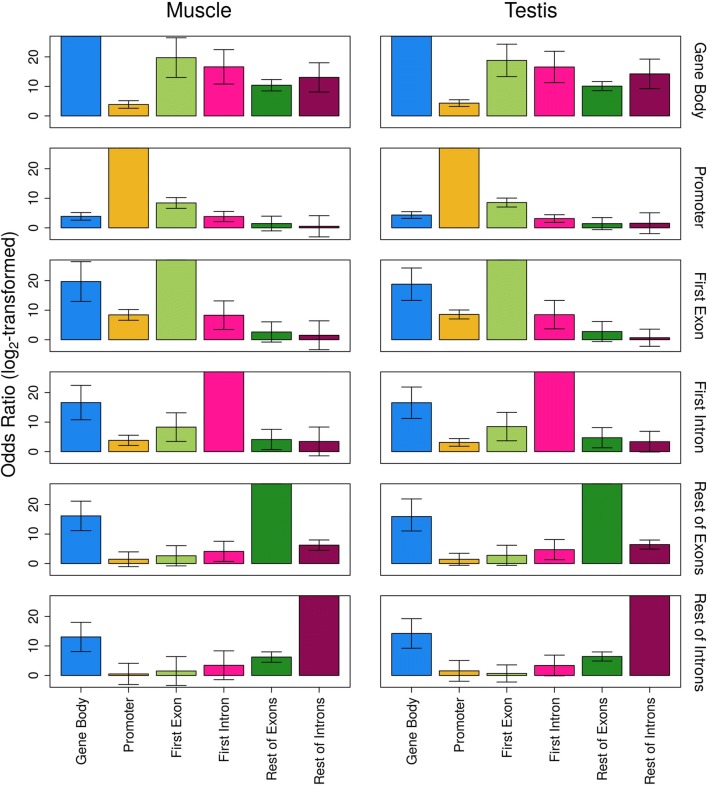
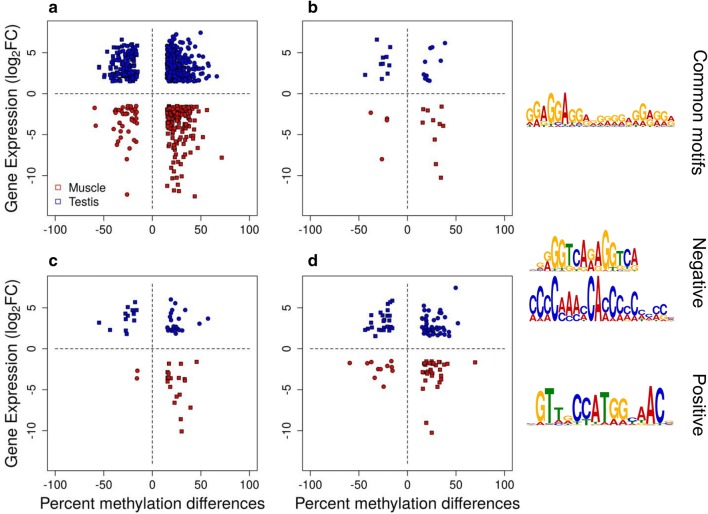
Results: The most important findings of this study are: (1) using different tissues from a modern fish, we show a clear genome-wide, tissue-independent quasi-linear inverse relationship between DNA methylation of the first intron and gene expression. (2) This relationship is conserved across vertebrates, since it is also present in the genomes of a model pufferfish, a model frog and different human tissues. Among the gene features, tissues and species interrogated, the first intron's negative correlation with the gene expression was most consistent. (3) We identified more tissue-specific differentially methylated regions (tDMRs) in the first intron than in any other gene feature. These tDMRs have positive or negative correlation with gene expression, indicative of distinct mechanisms of tissue-specific regulation. (4) Lastly, we identified CpGs in transcription factor binding motifs, enriched in the first intron, the methylation of which tended to increase with the distance from the first exon-first intron boundary, with a concomitant decrease in gene expression.

Conclusions: Our integrative analysis clearly reveals the important and conserved role of the methylation level of the first intron and its inverse association with gene expression regardless of tissue and species. These findings not only contribute to our basic understanding of the epigenetic regulation of gene expression but also identify the first intron as an informative gene feature regarding the relationship between DNA methylation and gene expression where future studies should be focused.

Keywords: DNA methylation; First intron; Gene expression; Gene features; Regulation.


Figures

Fig. 1
Fig. 1
DNA methylation per gene in gene features in muscle (a) and in testis (b). Kernel density plots for DNA methylation in genes (n = 15,456), promoters (− 1000 bp from the transcription start site; n = 5034), all introns (n = 9184) and all exons (n = 12,317). Separation of exons in first exon (n = 5790) and rest of exons (n = 8798) and of introns in first intron (n = 4387) and rest of introns (n = 5646)
Fig. 2
Fig. 2
DNA methylation in gene features by expression deciles in muscle and in testis. Violin plots of DNA methylation in promoter (muscle, n = 2745; testis, n = 3345), first exon (muscle, n = 3537; testis, n = 4064), first intron (muscle, n = 2801; testis, n = 3122), rest of exons (muscle, n = 5523; testis, n = 6398) and rest of introns (muscle, n = 4043; testis, n = 4897) divided into deciles based on increasing ranking of gene expression measured as log2-transformed count per million (cpm) values. Box plots with rotated kernel density plots at both sides indicate the interquartile range, and white central dots the median of the distribution. Correlations between DNA methylation and gene expression were measured using Spearman’s rank correlation coefficient (ρ), and the significance levels are reported as follows: *p < 0.05; ***p < 0.001
Fig. 3
Fig. 3
Violin plots of DNA methylation in promoter (Tetraodon, n = 12,896; Xenopus, n = 12,704; human liver, n = 22,680; human lung, n = 23,012), first exon (Tetraodon, n = 11,887; Xenopus, n = 10,361; human liver, n = 20,383; human lung, n = 20,704), first intron (Tetraodon, n = 11,420; Xenopus, n = 12,202; human liver, n = 20,029; human lung, n = 20,757), rest of exons (Tetraodon, n = 12,618; Xenopus, n = 12,662; human liver, n = 18,961; human lung, n = 19,331) and rest of introns (Tetraodon, n = 11,840; Xenopus, n = 11,905; human liver, n = 16,930; human lung, n = 17,007) divided into deciles based on increasing ranking of gene expression. Box plots with rotated kernel density plots at both sides indicate the interquartile range, and white central dots the median of the distribution. Correlations between DNA methylation and gene expression were measured using Spearman’s rank correlation coefficient (ρ), and the significance levels are reported as follows: ***p < 0.001
Fig. 4
Fig. 4
CpGs in enriched transcription factor (TF) binding sites of the first intron. CpGs were classified as unmethylated (below the first quartile of the total distribution; CpGs, dark red) or methylated (above the third quartile of the total distribution; me-CpGs, light blue) for muscle and for testis. The expression of genes measured as log2-transformed count per million (cpm) values is shown in the upper panel depending on the type of CpGs these genes contained in their first intron. In the lower panel, the relative distance of the CpGs and me-CpGs from the first exon-first intron boundary was calculated as distance from nucleotide 0 (bp)/width of the intron (bp). The sequences of the four enriched TF-binding motifs that contained CpGs are also shown. The Wilcoxon rank sum test with continuity correction was used to test for statistical differences of gene expression and relative distance between CpGs and me-CpGs, which are reported with the following equivalence: ***p < 0.001; *p < 0.05
Fig. 5
Fig. 5
Association of DNA methylation between pairs of gene features as measured by odds ratio. A gene feature was considered methylated if DNA methylation > 90% and unmethylated if DNA methylation < 10%. The odds ratio (OR) indicates the pairwise association between the methylation states of the gene features of interest, including gene body (all exons and introns), promoter, first exon, first intron, rest of exons and rest of introns in muscle and testis. The odds ratio is represented as log2-transformed values, and the bars indicate the 99.9% confidence intervals based on the Wald approximation. For the associations of gene feature A versus gene feature A, values were set to maximum and confidence intervals are not applicable
Fig. 6
Fig. 6
Differentially expressed genes with differentially methylated regions (tDMRs) between tissues. tDMRs overlap with the gene body and/or  4 kb upstream from the transcription start site or downstream of the 3’ UTR (a, n = 1044), the promoter (b, n = 47), the first exon (c, n = 75) or the first intron (d, n = 187). Positive (circles) and negative (boxes) correlation is shown for up-regulated genes in muscle (red) and up-regulated genes in testis (blue). Hyper-methylated tDMRs and up-regulated DEGs in testis (blue circles), hypo-methylated tDMRs and up-regulated DEGs in testis (blue squares), hypo-methylated tDMRs and up-regulated DEGs in muscle (red squares) and hyper-methylated tDMRs and up-regulated DEGs in muscle (red circles). Differentially expressed were considered the genes with log2 fold change > |1.5| and false discovery rate < 0.05. tDMRs were defined as regions showing more than 15% methylation difference between tissues and q value < 0.001, with a minimum number of 5 CpGs and 3 differentially methylated cytosines (DMCs), where a DMC showed more than 15% methylation difference between tissues. Transcription factor binding motifs present in the tDMRs of gene bodies and/or ± 4 kb that are common between positive and negative correlation of DNA methylation with gene expression or that are correlation specific (negative or positive)

References

    1. Lowdon RF, Jang HS, Wang T. Evolution of epigenetic regulation in vertebrate genomes. Trends Genet TIG. 2016;32:269–283. doi: 10.1016/j.tig.2016.03.001. - DOI - PMC - PubMed
    1. Gilbert SF, Epel D. Ecological developmental biology: integrating epigenetics, medicine, and evolution. Sunderland: Sinauer Associates; 2008.
    1. Moore LD, Le T, Fan G. DNA methylation and its basic function. Neuropsychopharmacology. 2013;38:23–38. doi: 10.1038/npp.2012.112. - DOI - PMC - PubMed
    1. Illingworth RS, Bird AP. CpG islands—‘a rough guide’. FEBS Lett. 2009;583:1713–1720. doi: 10.1016/j.febslet.2009.04.012. - DOI - PubMed
    1. Straussman R, Nejman D, Roberts D, Steinfeld I, Blum B, Benvenisty N, et al. Developmental programming of CpG island methylation profiles in the human genome. Nat Struct Mol Biol. 2009;16:564–571. doi: 10.1038/nsmb.1594. - DOI - PubMed

Publication types