. 2018 Jun 29;6(1):52.
doi: 10.1186/s40478-018-0557-6.

Phosphorylation of different tau sites during progression of Alzheimer's disease

Affiliations

Phosphorylation of different tau sites during progression of Alzheimer's disease

Joerg Neddens et al. Acta Neuropathol Commun. .

Abstract

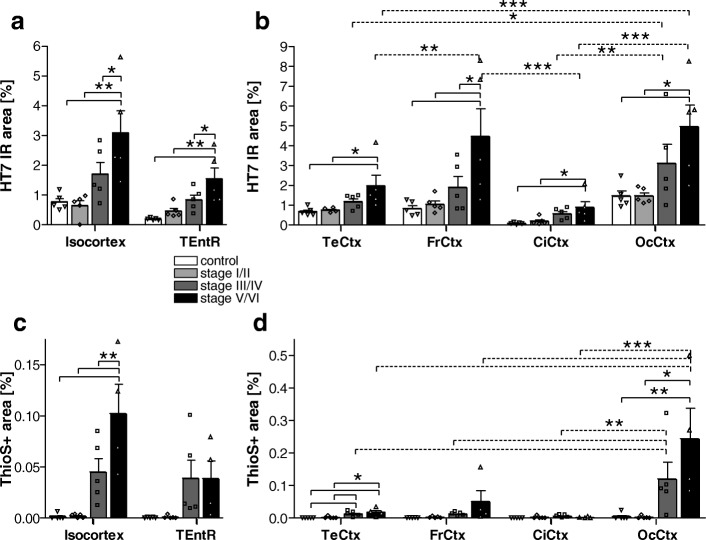
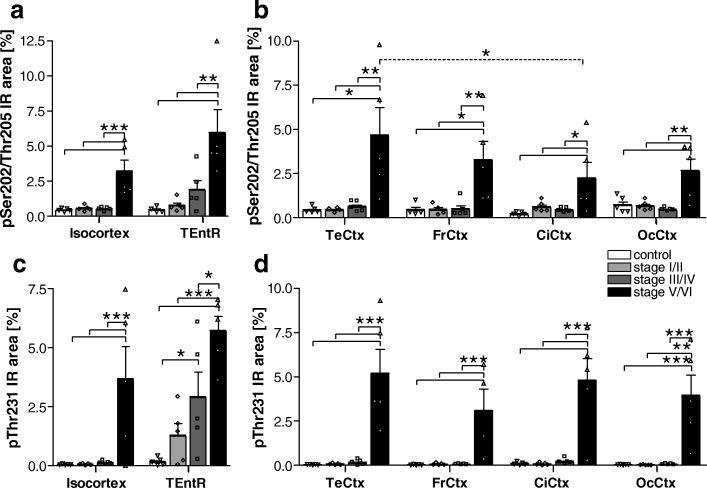
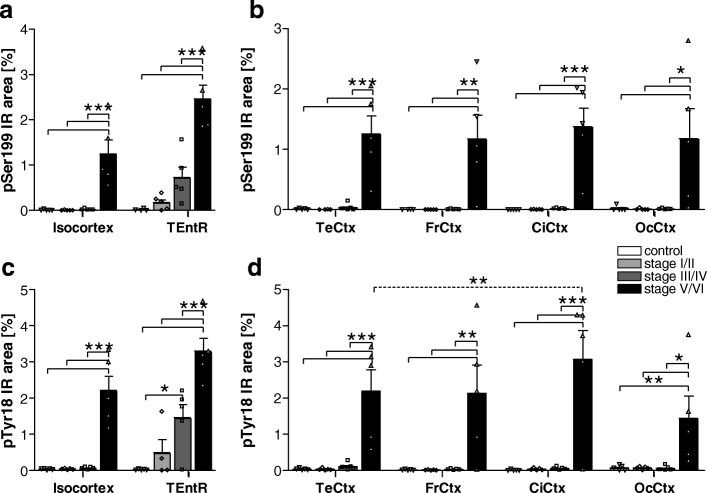
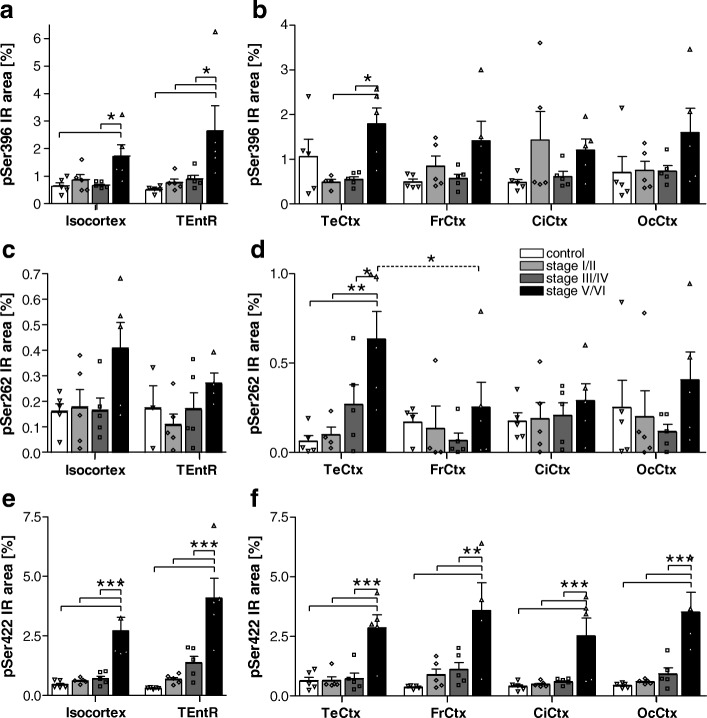
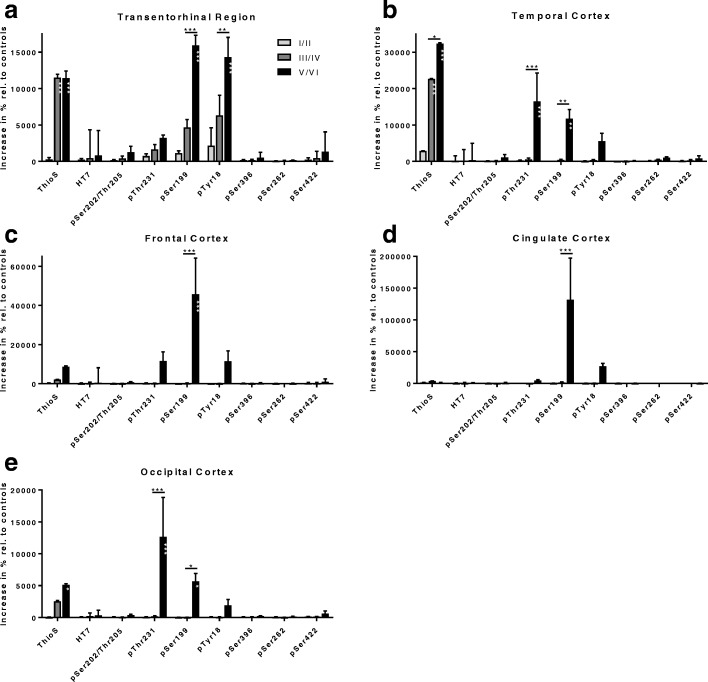
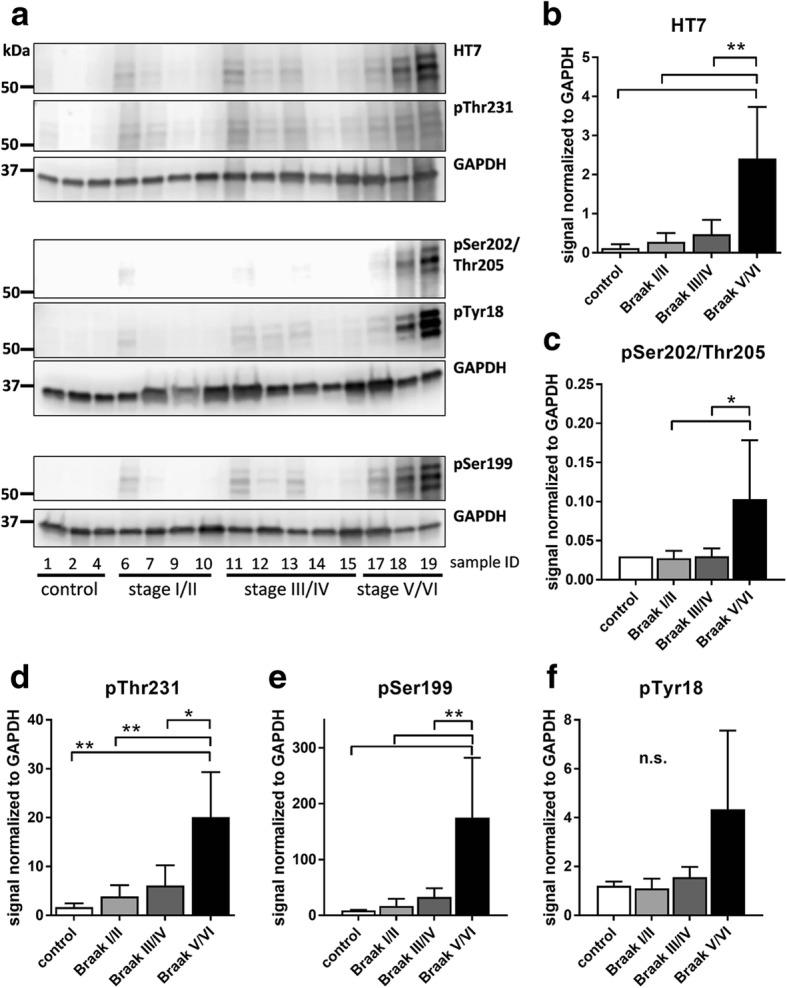
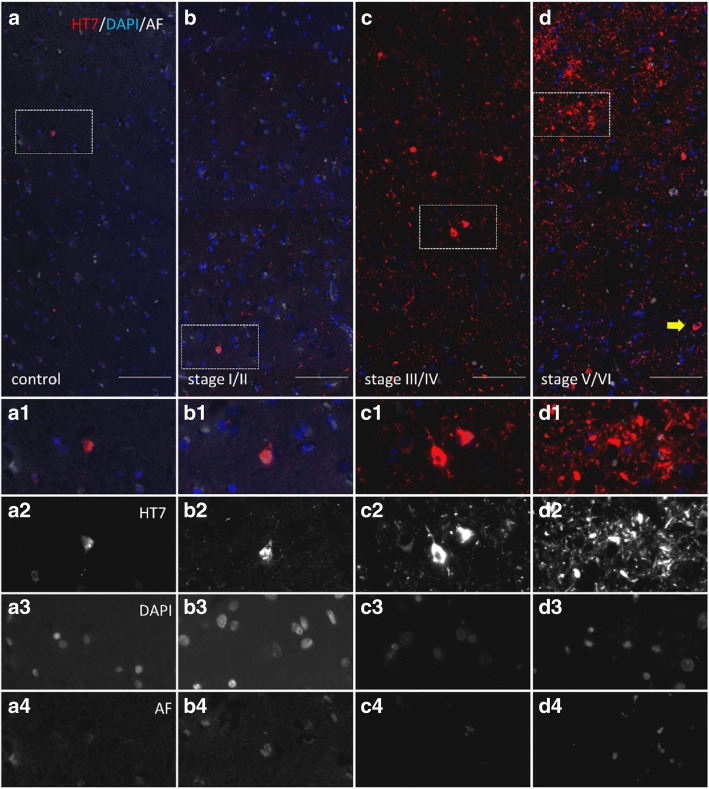
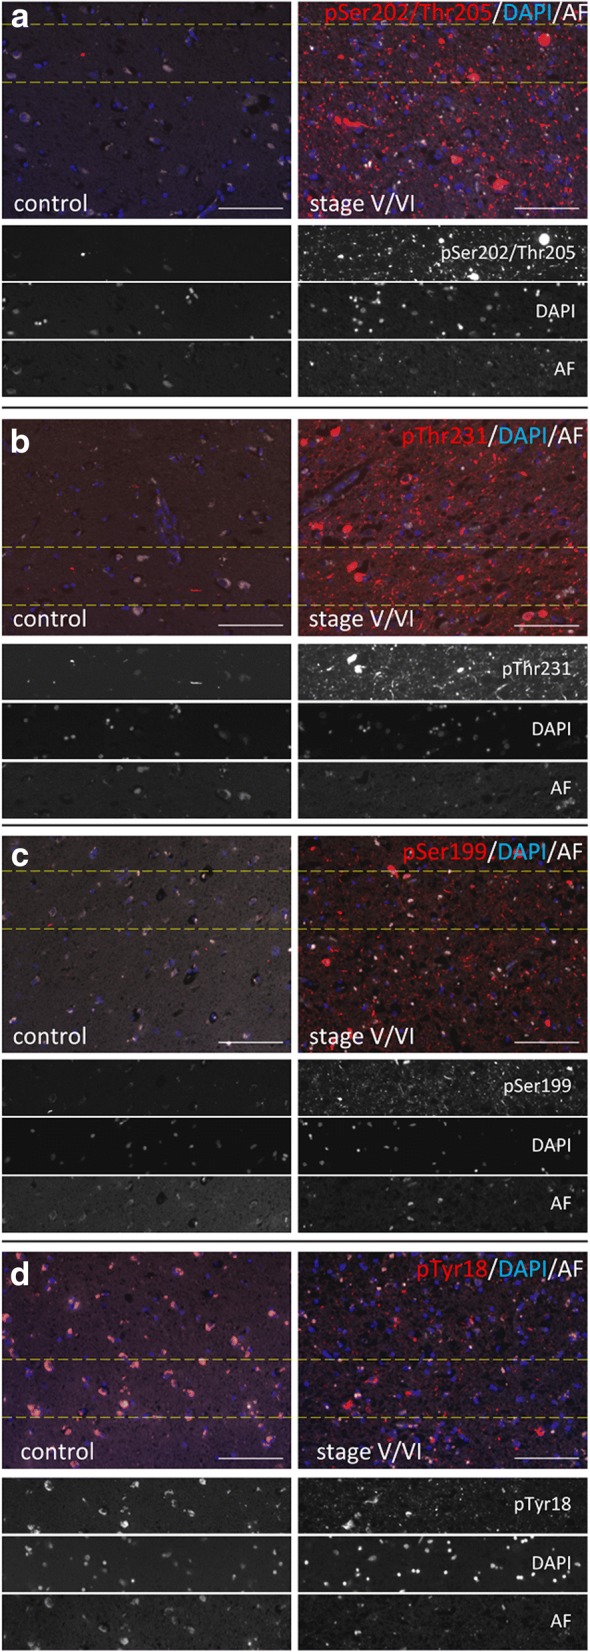
Alzheimer's disease is characterized by accumulation of amyloid plaques and tau aggregates in several cortical brain regions. Tau phosphorylation causes formation of neurofibrillary tangles and neuropil threads. Phosphorylation at tau Ser202/Thr205 is well characterized since labeling of this site is used to assign Braak stage based on occurrence of neurofibrillary tangles. Only little is known about the spatial and temporal phosphorylation profile of other phosphorylated tau (ptau) sites. Here, we investigate total tau and ptau at residues Tyr18, Ser199, Ser202/Thr205, Thr231, Ser262, Ser396, Ser422 as well as amyloid-β plaques in human brain tissue of AD patients and controls. Allo- and isocortical brain regions were evaluated applying rater-independent automated quantification based on digital image analysis. We found that the level of ptau at several residues, like Ser199, Ser202/Thr205, and Ser422 was similar in healthy controls and Braak stages I to IV but was increased in Braak stage V/VI throughout the entire isocortex and transentorhinal cortex. Quantification of ThioS-stained plaques showed a similar pattern. Only tau phosphorylation at Tyr18 and Thr231 was already significantly increased in the transentorhinal region at Braak stage III/IV and hence showed a progressive increase with increasing Braak stages. Additionally, the increase in phosphorylation relative to controls was highest at Tyr18, Thr231 and Ser199. By contrast, Ser396 tau and Ser262 tau showed only a weak phosphorylation in all analyzed brain regions and only minor progression. Our results suggest that the ptau burden in the isocortex is comparable between all analyzed ptau sites when using a quantitative approach while levels of ptau at Tyr18 or Thr231 in the transentorhinal region are different between all Braak stages. Hence these sites could be crucial in the pathogenesis of AD already at early stages and therefore represent putative novel therapeutic targets.

Keywords: Cingulate; Frontal; Immunofluorescent labeling; Microtubule-associated protein tau; Occipital and temporal cortex; Phosphorylation; Transentorhinal region.


Conflict of interest statement

Ethics approval and consent to participate

Human tissue was provided by the Newcastle Brain Tissue Resource (NBTR), Newcastle University, UK in accordance with the approval of the joint Ethics Committee of Newcastle and North Tyneside Health Authority and following NBTR brain banking procedures.

Consent for publication

Not applicable.

Competing interests

JN, MT, SF, BK, CH, TL, VN and BHP are employees of QPS Austria GmbH. The authors declare that they have no other competing interests.

Publisher’s Note

Springer Nature remains neutral with regard to jurisdictional claims in published maps and institutional affiliations.

Figures

Fig. 1
Fig. 1
Quantification of total human tau and plaque load in the cortex of AD cases. a Total human tau (HT7 antibody) immunoreactive area in percent in the isocortex and TEntR (allocortex) of different AD stages. c β sheet (ThioflavinS staining) positive area in percent in the isocortex and TEntR of different AD stages. Isocortical data in a and c present mean of different cortical regions that are shown separately in b and d, respectively. Two way ANOVA followed by Bonferroni’s posthoc test. Mean + SEM; N = 5.*p < 0.05; **p < 0.01; ***p < 0.001. c, d One outlier of Braak stage V/VI excluded for all ThioS labelings. Solid lines: Comparison of AD stages within a brain region; dotted lines: comparison of brain regions of the same AD Braak stage. CiCtx: cingulate cortex; FrCtx: frontal cortex; OcCtx: occipital cortex; TeCtx: temporal cortex; TEntR: transentorhinal region
Fig. 2
Fig. 2
Quantification of tau phosphorylation at pSer202/Thr205 and pThr231 in the cortex of AD cases. a Human pSer202/Thr205 tau immunoreactive area in percent in the isocortex and TEntR (allocortex) of different AD stages. c Human pThr231 tau immunoreactive area in percent in the isocortex and TEntR of different AD stages. Isocortical data in a and c present mean of different cortical regions that are shown separately in b and d, respectively. Two way ANOVA followed by Bonferroni’s posthoc test. Mean + SEM; N = 5.*p < 0.05; **p < 0.01; ***p < 0.001. Solid lines: Comparison of AD stages within a brain region; dotted lines: comparison of brain regions of the same AD Braak stage. CiCtx: cingulate cortex; FrCtx: frontal cortex; OcCtx: occipital cortex; TeCtx: temporal cortex; TEntR: transentorhinal region
Fig. 3
Fig. 3
Quantification of tau phosphorylation at pSer199 and pTyr18 in the cortex of AD cases. a Human pSer199 tau immunoreactive area in percent in the isocortex and TENtR (allocortex) of different AD stages. c Human pTyr18 tau immunoreactive area in percent in the isocortex and TEntR of different AD stages. Isocortical data in a and c present mean of different cortical regions that are shown separately in b and d, respectively. Two way ANOVA followed by Bonferroni’s posthoc test. Mean + SEM; N = 5.*p < 0.05; **p < 0.01; ***p < 0.001. Solid lines: Comparison of AD stages within a brain region; dotted lines: comparison of brain regions of the same AD Braak stage. CiCtx: cingulate cortex; FrCtx: frontal cortex; OcCtx: occipital cortex; TeCtx: temporal cortex; TEntR: transentorhinal region
Fig. 4
Fig. 4
Quantification of tau phosphorylation at pSer396, pSer262 and pSer422 in the cortex of AD cases. a Human pSer396 tau immunoreactive area in percent in the isocortex and TEntR (allocortex) of different AD stages. c Human pSer422 tau immunoreactive area in percent in the isocortex and TEntR of different AD stages. e Human pSer262 tau immunoreactive area in percent in the isocortex and TEntR of different AD stages. Isocortical data in a, c and e present mean of different cortical regions that are shown separately in b, d and f, respectively. Two way ANOVA followed by Bonferroni’s posthoc test. Mean + SEM; N = 5.*p < 0.05; **p < 0.01; ***p < 0.001. Solid lines: Comparison of AD stages within a brain region; dotted lines: comparison of brain regions of the same AD Braak stage. CiCtx: cingulate cortex; FrCtx: frontal cortex; OcCtx: occipital cortex; TeCtx: temporal cortex; TEntR: transentorhinal region
Fig. 5
Fig. 5
Signal increase relative to control brain tissue in the cortex of AD cases. Values are calculated from means of absolute IR area from Figs. 1, 2, 3 and 4 relative to control brain samples. Calculation is shown for ThioS, HT7, pSer202/Thr205, pThr231, pSer199, pTyr18, pSer396, pSer262 and pSer422 in the transentorhinal (a), temporal (b), frontal (c), cingulate (d) and occipital cortex (e) at Braak stages I/II; III/IV and V/VI. Two way ANOVA followed by Bonferroni’s posthoc test. Mean + SEM. White asterisks within bars mark significance compared to Braak stage I/II. *p < 0.05; **p < 0.01; ***p < 0.001
Fig. 6
Fig. 6
Quantification of total tau and tau phosphorylation in the transentorhinal cortex of AD cases by Western blotting. a: Western blots of total tau, pThr231, pSer202/Thr205, pTyr18, and pSer199. GAPDH was used as loading control. Quantification of Western blot for (b) total tau by HT7 antibody, (c) pSer202/Thr205, (d) pThr231, (e) pSer199, and (f) pTyr18. All samples shown in (a) were used for quantification of (b-f). One way ANOVA followed by Tukey’s multiple comparisons test. Mean + SEM. *p < 0.05; **p < 0.01; n.s.: not significant
Fig. 7
Fig. 7
Representative images of total tau labeling in the transentorhinal cortex grey matter of AD cases. Labeling of total tau using HT7 antibody (a-d, a1-d1, a2-d2) and nuclei by DAPI staining (a-d, a1-d1,a3-d3). Autofluorescence is shown in white (a-d, a1-d1, a4-d4). Samples of healthy control tissue (a-a4, case 2), Braak stage I/II (b-b4, case 8), Braak stage III/IV (c-c4, case 11) and Braak stage V/VI (d-d4, case 16) are shown. Scale bar: 100 μm
Fig. 8
Fig. 8
Representative images of ptau labelings in the transentorhinal cortex of control and AD cases. Labeling of pSer202/Thr205 (a), pThr231 (b), pSer199 (c), and pTyr18 (d) are shown. Tissues were additionally stained with DAPI to visualize nuclei. Autofluorescence is shown in white. Dotted lines indicate areas shown in grey scale images. Samples of healthy control tissue (case 2) and Braak stage V/VI (case 16) are shown. Scale bar: 100 μm

References

    1. Alafuzoff I, Arzberger T, Al-Sarraj S, Bodi I, Bogdanovic N, Braak H, Bugiani O, Del-Tredici K, Ferrer I, Gelpi E et al (2008) Staging of neurofibrillary pathology in Alzheimer's disease: a study of the BrainNet Europe consortium. Brain Pathol 18: 484–496 doi 10.1111/j.1750-3639.2008.00147.x - PMC - PubMed
    1. Amadoro G, Corsetti V, Atlante A, Florenzano F, Capsoni S, Bussani R, Mercanti D, Calissano P. Interaction between NH(2)-tau fragment and Abeta in Alzheimer's disease mitochondria contributes to the synaptic deterioration. Neurobiol Aging. 2012;33(833):e831–e825. - PubMed
    1. Amadoro G, Corsetti V, Ciotti MT, Florenzano F, Capsoni S, Amato G, Calissano P. Endogenous Abeta causes cell death via early tau hyperphosphorylation. Neurobiol Aging. 2011;32:969–990. doi: 10.1016/j.neurobiolaging.2009.06.005. - DOI - PubMed
    1. Andorfer C, Kress Y, Espinoza M, de Silva R, Tucker KL, Barde YA, Duff K, Davies P. Hyperphosphorylation and aggregation of tau in mice expressing normal human tau isoforms. J Neurochem. 2003;86:582–590. doi: 10.1046/j.1471-4159.2003.01879.x. - DOI - PubMed
    1. Ariza M, Kolb HC, Moechars D, Rombouts F, Andres JI. Tau positron emission tomography (PET) imaging: past, present, and future. J Med Chem. 2015;58:4365–4382. doi: 10.1021/jm5017544. - DOI - PubMed

Publication types