. 2018 Jul 17;49(1):178-193.e7.
doi: 10.1016/j.immuni.2018.06.006. Epub 2018 Jun 26.

Tumor Cell-Intrinsic Factors Underlie Heterogeneity of Immune Cell Infiltration and Response to Immunotherapy

Affiliations

Tumor Cell-Intrinsic Factors Underlie Heterogeneity of Immune Cell Infiltration and Response to Immunotherapy

Jinyang Li et al. Immunity. .

Abstract

The biological and functional heterogeneity between tumors-both across and within cancer types-poses a challenge for immunotherapy. To understand the factors underlying tumor immune heterogeneity and immunotherapy sensitivity, we established a library of congenic tumor cell clones from an autochthonous mouse model of pancreatic adenocarcinoma. These clones generated tumors that recapitulated T cell-inflamed and non-T-cell-inflamed tumor microenvironments upon implantation in immunocompetent mice, with distinct patterns of infiltration by immune cell subsets. Co-injecting tumor cell clones revealed the non-T-cell-inflamed phenotype is dominant and that both quantitative and qualitative features of intratumoral CD8+ T cells determine response to therapy. Transcriptomic and epigenetic analyses revealed tumor-cell-intrinsic production of the chemokine CXCL1 as a determinant of the non-T-cell-inflamed microenvironment, and ablation of CXCL1 promoted T cell infiltration and sensitivity to a combination immunotherapy regimen. Thus, tumor cell-intrinsic factors shape the tumor immune microenvironment and influence the outcome of immunotherapy.


Conflict of interest statement

Declaration of Interests

The authors have no competing interests.

Figures

Figure 1.
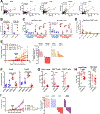
Figure 1.. The immune TME is a dictated by tumor cell-intrinsic traits and influences metastatic tumor growth
(A-B) Percentages of CD8+ (A) or CD3+ (B) T cells among CD45+ cells of human PDA tumors by flow cytometry, segregated by k-means analysis with n=2 clusters. (C) Quantification of intratumoral CD3+ T cells measured by IF in 24 primary tumors from KPCY mice, shown as box-whisker plot, n=5 fields/tumor sample. (D) Experimental design for establishing a library of congenic cell clones from KPCY tumors. (E-F) Flow cytometric analysis of percentages of CD8+ (E) and total CD3+ (F) T cells among CD45+ cells in s.c. tumors from (D) (n=10–30 samples/clone, n=17 clones), segregated as described in 1A. (G) Unsupervised clustering of tumor clones from 1E-F showing the abundance of indicated immune subsets among CD45+ cells after flow cytometric analysis. Blue bar indicates T cell low tumors, green bar indicates T cell intermediate (“int”) tumors, and red bar indicates T cell high tumors. Black arrow highlights CD8+ T cells, red and blue arrows indicate clones used in subsequent studies. (H) Analysis of s.c. tumors from T cell high or low clones for the indicated immune subsets after flow cytometry, n=5 mice/clone, n=2 clones/group. (I) Representative IF images (left) and quantification (right) of CD3+ T cells in tumors from indicated clones stained for CD3 (red), YFP (green), and DAPI (blue). (J) Flow cytometric analysis of CD3+ and CD3+CD8+ T cells, CD11b+ myeloid cells, and gMDSCs among CD45+ cells in orthotopic tumors from indicated clones (n=4–5 mice/clone). (K) Representative IF images (left) and quantification (right) of CD3+ T cells in orthotopic tumors from indicated clones. Co-staining for CD3 (red), YFP (green), and DAPI (blue). (L) Quantification of lung weight 21 days after tail vein injection of T cell high or low clones; lungs from non-injected mice served as controls (n=5 mice/group). (M) Quantification of metastatic growth of T cell high clones after tail vein injection into NOD/SCID mice or C57BL/6 mice following CD4/CD8 depletion (n=5 mice/group). Each symbol or box represents a single patient or mouse sample (A, B, H, J, L, M), an average of samples from n=10–30 tumors (E, F, G), or an average field (C, I, K), with horizontal lines indicating mean and error bars indicating SD (A, H-M), range (C), or SEM (E). Statistical analysis by Students’ unpaired t-test (A, B, E, F, H, J, K, M) or one-way ANOVA with Tukey’s HSD post-test (I, L) with significance indicated (*, p<0.05; **, p<0.01; ***, p<0.001; ****, p<0.0001; ns, not significant in this and all subsequent figures, unless otherwise indicated). See also Table S1 and Figure S1.
Figure 2.
Figure 2.. The abundance of pre-existing tumor-infiltrating CD8+ T cells predicts durable response to combined immunotherapy
(A-B) Tumor growth curve and waterfall plot showing changes in tumor volume 3 weeks after start of therapy. PDA clones (T cell low/high, as indicated) were implanted s.c. (A) or orthotopically (B) into C57BL/6 mice (n=4–8 mice per group) and treated with GAFCP for 9–15 days (average diameter of 3–5mm) (A) or 7 days (B) after implantation. (C) Waterfall plots (left) or survival curves (right) from mice bearing tumors from T cell high clone 2838c3 treated with the indicated combinations of GAFCP beginning on day 12 after tumor implantation (n=6–7 mice/group). (D-F) Survival of mice cured by the therapies in (A) and (C) challenged with secondary tumors. (D) Mice from (A) and (C) cured of primary 2838c3 tumors by the indicated therapy were rechallenged with 2838c3 (primary cured with CP or GACP, n=5; primary cured with F, FCP, or GAFCP, n=11). An additional group of mice cured of primary 2838c3 tumors after treatment (n=9) received anti-CD8. (E) Mice cured of primary tumors from T cell high clones 6620c1 (n=2) or 6499c4 (n=3) after GAFCP therapy or naïve mice (n=5) were challenged with the unrelated T cell high clone 2838c3. (F) Mice cured of primary 2838c3 tumors from (A) or (C) after treatment with GACP (n=1) or GAFCP (n=6) were challenged with the unrelated T cell low clone 6419c5 and survival was compared to naïve mice injected with 6419c5 (n=5). Each symbol in the tumor volume curves represents the mean of a group of mice (n=4–8), with error bars indicating SEM. Each bar in the waterfall plots represents a single mouse. Statistical differences were identified by linear mixed-effect modeling with Tukey’s HSD post-test (A-B), or Kaplan-Meier with log-rank test (C-F), with significance against control groups indicated next to group, or other comparisons indicated by brackets. In C, the GA group was also at least ** vs. all other treatment groups. See also Figure S2.
Figure 3.
Figure 3.. Increased prevalence of PD-1+ activated CD8+ T cells predicts response to combination immunotherapy
(A-J) Flow analysis of indicated subsets of CD4+ and CD8+ T cells in s.c. tumors among CD45+ cells (n=5–10 mice/clone, n=2 clones/group). (A) Quantification of CD4+ regulatory T cells (Treg) and helper T cells (Th). (B) Ratio of CD8+ T cells to CD4+ Tregs. (C) Quantification of CD44hi or PD-1+CD8+ cells within CD8+ cells. (D) Representative flow plots of CD8+ T cells from T cell low (left, 6419c5) or T cell high (right, 2838c3) clones stained for PD-1 and CD44. (E) Mean fluorescence intensity (MFI) of Nur77, Lag3, CTLA-4, and Tim-3 within CD8+ T cells. (F) Intracellular cytokine staining in CD8+ T cells after ex vivo PMA/ionomycin stimulation. (G-H) Intracellular staining for Ki67 (G) or Granzyme B (GzmB) (H) among CD45+ and within the CD8+ T cells, and qPCR for GZMB from CD8+ T cells sorted from s.c. tumors (n=4–5 mice/clone, n=1–2 clones/group). (I-J) PD-1+ cells among CD8+ T cells (I) or total PD-1+CD8+ T cells among CD45+ cells (J) in all T cell high clones (n=10–30 mice/clone, n=7 clones), T cell low clones (n=9–37 mice/clone, n=8 clones), and T cell intermediate clones (n=14–15 mice per clone, n=2 clones, as indicated). (K-L) Tumor growth curves and waterfall plots showing changes in tumor volume 3 weeks after the start of therapy on the indicated day (n=7–8 mice/group). Each symbol represents a single mouse (A-I) or a group mean (K, L), and each bar represents a single mouse (K, L), with horizontal lines indicating mean and error bars indicating SD (A-J) or SEM (K, L), except for J, where bars indicate range. Statistical differences were determined by Students’ t-test (A-H), one-way ANOVA with Tukey’s HSD post-test (I, J) or linear mixed-effects modeling with Tukey’s HSD post-test (K, L), significance as indicated. See also Figure S3.
Figure 4.
Figure 4.. CD103+ cross-presenting dendritic cells and CXCR3 mediate infiltration of CD8+ T cells into T cell high PDA tumors
(A) Correlation of transcript abundance for CD8A and cross-presenting DC markers in 134 human PDA samples from TCGA. (B-C) Flow analysis of indicated subsets among CD45+ cells from indicated s.c. tumors. (B) Proportion of CD103+ DCs in s.c. (n=5 mice/group, n=2 clones/group) or orthotopic (n=3 mice/group, n=1 clone/group) T cell high and low tumors. (C) Proportion of CD44hi or PD-1+ cells among CD8+ cells in wild-type C57BL/6 (solid symbols) or Batf3−/− (open symbols) mice for indicated T cell high (red) or low (blue) clones, n=5 mice/group. (D) Flow analysis of adoptively transferred Thy1.1+CD8+ T cells from spleens of wild-type, treatment-matched 2838c3 tumor-bearing donors on day 21 in tumors of wild-type and Batf3−/− (Thy1.2+) hosts three days after transfer. Tumor-bearing wild-type donors (Thy1.1+), TB; wild-type hosts (Thy1.2+), WT; non-tumor bearing donors (Thy1.1+), NT; Batf3−/− hosts (Thy1.2+), −/−; tumor-bearing wild-type mice without adoptive transfer (Thy1.2+), No AT. (E) Tumor growth curves and waterfall plots showing changes in tumor volume 3 weeks after the beginning of treatment. Clone 2838c3 was implanted s.c. in C57BL/6 or Batf3−/− mice (n=5–7 mice per group) as described in Figure 2A, with therapy starting 12 days after implantation. (F) Quantitative PCR of CXCL9 and CXCL10 from sorted tumor cells from T cell low or high clones (n=5 samples/clone, n=2 clones/group). (G-H) Flow analysis of indicated subsets among CD45+ cells from s.c. 2838c3 tumors. (G) Proportion of CD3+, CD4+, CD8+ T cells. (H) Proportion of CD44hi or PD-1+ cells among CD8+ cells. Mice were treated with anti-CXCR3 continuously before harvest on day 21 (n=5–7 mice/group). (I) Tumor growth curves and waterfall plots at day 21 after the start of therapy in mice bearing T cell high clone 2838c3 tumors treated starting at day 12 with GAFCP (+/− αCXCR3) (n=5–7 mice/group). Each symbol represents a single patient or mouse (A-D, F-H) or a group mean (E, I), each bar represents a single mouse (E, I), and error bars indicate SD (A-D, F-H) or SEM (E, I). Statistical differences were determined by Pearson correlation analysis (A), Students’ unpaired T test (B-C, F-H), one-way ANOVA with Tukey’s HSD post-test (F), linear mixed-effects modeling with Tukey’s HSD post-test (E, I), or Kaplan-Meier with log-rank test (E, I), with significance indicated between groups in brackets. See also Figure S4.
Figure 5.
Figure 5.. T cell low tumor clones actively enhance myeloid cell mobilization to the local tumor site.
(A) Flow analysis of CD8+ T cells, gMDSCs, and CD11b+ myeloid cells among CD45+ cells in the blood, spleen, and TDLN of mice bearing tumors (s.c. implanted, n=10 samples/clone, n=2 clones/group, n=4 non-tumor bearing control mice). (B-C) Schematic of the dual injection model (B). (C) Flow analysis of s.c. tumors from dual injection experiments outlined in (B) showing the proportion of indicated cell subsets among CD45+ cells, or among CD8+ T cells. Blue bars: dual T cell low clone injections, red bars: dual T cell high clone injections, and purple bars: T cell low clone on one flank and T cell high clone on the other (each bar indicates n=5 mice/group, error bars indicate SD). (D) Schematic of the co-mixing injection model used for (E). (E) Flow cytometric analysis of the experiment outlined in (D), showing the proportion of indicated cell subsets among CD45+ cells, or among CD8+ T cells, n=5 mice per group. Statistical differences were identified by one-way ANOVA with Tukey’s HSD post-test (A, E) or Students’ unpaired t-test with comparisons indicated by brackets. See also Figure S4.
Figure 6.
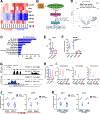
Figure 6.. Genomic, epigenetic, and transcriptional features, including distinct epigenetic status and expression of Cxcl1, distinguish T cell low and T cell high tumors
(A) Heatmap illustration of copy number states for selected genomic loci in T cell high/low clones. (B) Pipeline for RNA-seq analysis and identification of secreted chemokines. (C) Gene set enrichment analysis of differentially expressed genes enriched in T cell low versus high bulk tumor samples using the HALLMARK gene sets. (D) Volcano plot of differentially expressed genes based on an RNA-sequencing analysis of T cell low vs T cell high tumors as generated by DESeq2. Dashed line represents padj = 0.1. Genes exhibiting padj < 0.1 and fold change >1.5 highlighted in blue; the three chemokines that were significantly increased in T cell low tumors are bolded. (E) Boxplot of Cxcl1 gene expression in transcripts per million (Tpm) in sorted tumor cells from s.c. tumors. (F) Relative expression of Cxcl1 (qPCR) in sorted tumor cells from s.c. tumors (n=5 samples/clone, n=2 clones/group). (G) Representative RNA-seq and ATAC-seq tracks of Cxcl1 locus in sorted 2838c3 and 6419c5 tumor cells as indicated. (H) Scaled values of chromatin accessibility at the Cxcl1 promoter derived from DESeq2 normalized value as measured by ATAC-seq in sorted tumor cells from s.c. tumors. (I) Quantification of the H3K4me3 mark in the Cxcl1 promoter region of cultured tumor clones as measured by ChIP-PCR (n=3 samples/clone, n=2 clones/group). (J) Relative expression of c-Myc and Cxcl1 as measured by quantitative PCR in T cell high clones transduced with either pCDH-FHC-empty vector (EV; Control) or pCDH-FHC-Myc (Myc-OE). Data combined from n=3–7 independent experiments. (K) Quantitative PCR analysis of Cxcl1 expression in T cell low clones with 72-hour treatment of JQ1 (0.5 μM) or I-BET (1 μM), combined data from n=5 independent experiments. Horizontal line indicates mean; error bars indicate range (E, F, H-K), except for F, where error bars indicate SD and each symbol represents an individual sorted tumor replicate. Statistical differences were determined by Students’ unpaired t-test for comparison between just two groups (J, K) or one-way ANOVA with Tukey’s HSD post-test (F), with significance indicated as compared to the control group or as indicated by brackets. See also Figure S5.
Figure 7.
Figure 7.. Blocking tumor cell-derived CXCL1 renders T cell low tumors sensitive to immunotherapy
(A) Flow analysis of indicated subsets among CD45+ cells from indicated s.c. tumors derived from 2838c3 or 6499c4 tumor cell clones transduced with pCDH-FHC-empty vector (Ctrl) or pCDHFHC-Cxcl1 (Cxcl1-OE) (n=5 mice/group). (B) Flow analysis of indicated subsets among CD45+ cells from indicated s.c. 6419c5 T cell low tumors in wild-type, Cxcr2+/−, or Cxcr2−/− mice (n=5 mice/group). (C-D) Flow analysis of indicated subsets among CD45+ cells from indicated s.c. tumors derived from 6419c5 (top) or 6694c2 (bottom) T cell low clones, and two independent Cxcl1−/− clones for each parental clone (n=5 mice/group). (E-F) Tumor growth curves and waterfall plots showing changes in tumor volume 21 days after the indicated start of therapy (FCP, no GA) for cell low clone tumor 6419c5 (E) or 6694c2 (F). Top row: T cell low clones with empty vector (CRISPR-lentiV2). Second and third rows: two independent T cell low clones lacking Cxcl1 (A or B, respectively), (n=5–8mice/group). Each symbol or bar represents a single mouse (A, E, F) or the mean of a group (B-F) with error bars indicating SD (A), range (B-D), or SEM (E, F). Statistical differences were determined by Students’ unpaired t-test for comparison between two groups (A), one-way ANOVA with Tukey’s HSD post-test (B-D), or linear mixed-effects modeling with Tukey’s HSD post-test (E, F), with significance indicated. See also Figure S6.

Comment in

Similar articles

Cited by

References

    1. Ahmadzadeh M, Johnson LA, Heemskerk B, Wunderlich JR, Dudley ME, White DE, and Rosenberg SA (2009). Tumor antigen–specific CD8 T cells infiltrating the tumor express high levels of PD-1 and are functionally impaired. Blood 114, 1537–1544. - PMC - PubMed
    1. Bailey P, Chang DK, Forget M-A, Lucas FAS, Alvarez HA, Haymaker C, Chattopadhyay C, Kim S-H, Ekmekcioglu S, Grimm EA, et al. (2016). Exploiting the neoantigen landscape for immunotherapy of pancreatic ductal adenocarcinoma. Scientific Reports 6, 5. - PMC - PubMed
    1. Balachandran VP, Łuksza M, Zhao JN, Makarov V, Moral JA, Remark R, Herbst B, Askan G, Bhanot U, Senbabaoglu Y, et al. (2017). Identification of unique neoantigen qualities in long-term survivors of pancreatic cancer. Nature 551, 512–516. - PMC - PubMed
    1. Balli D, Rech AJ, Stanger BZ, and Vonderheide RH (2017). Immune Cytolytic Activity Stratifies Molecular Subsets of Human Pancreatic Cancer. Clin. Cancer Res. 23, 3129–3138. - PubMed
    1. Baslan T, Kendall J, Rodgers L, Cox H, Riggs M, Stepansky A, Troge J, Ravi K, Esposito D, Lakshmi B, et al. (2012). Genome-wide copy number analysis of single cells. Nature Protocols 2012 7:6 7, 1024–1041. - PMC - PubMed

Publication types

MeSH terms

Substances