. 2018 Jul 17;49(1):93-106.e7.
doi: 10.1016/j.immuni.2018.05.004. Epub 2018 Jun 26.

Sympathetic Neuronal Activation Triggers Myeloid Progenitor Proliferation and Differentiation

Affiliations

Sympathetic Neuronal Activation Triggers Myeloid Progenitor Proliferation and Differentiation

Sathish Babu Vasamsetti et al. Immunity. .

Abstract

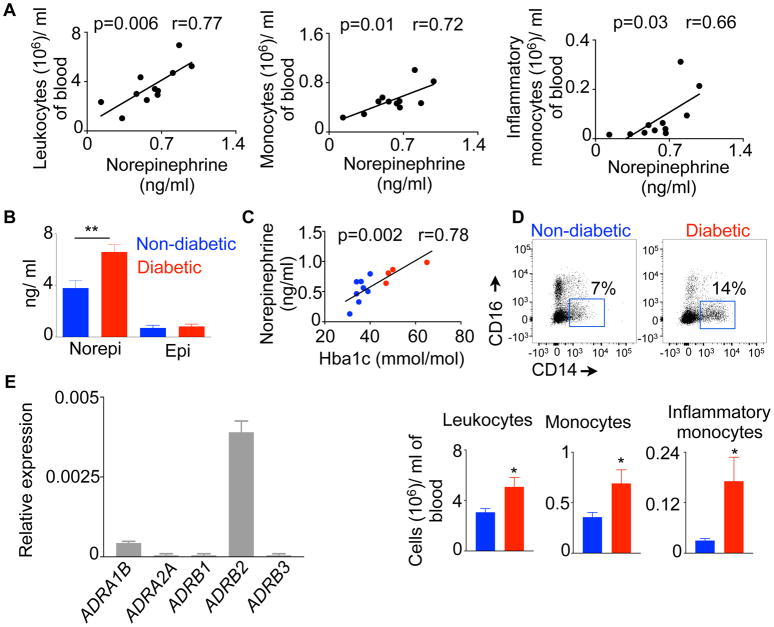
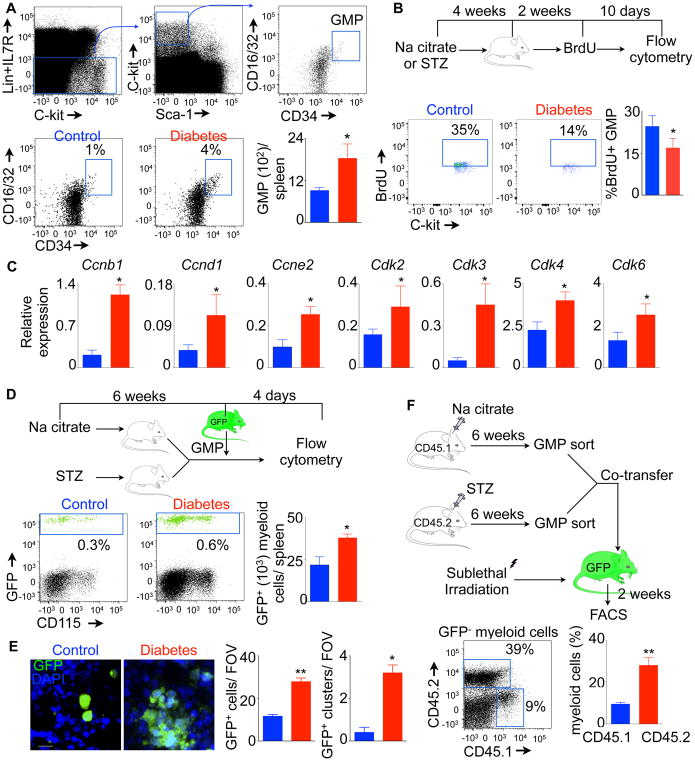
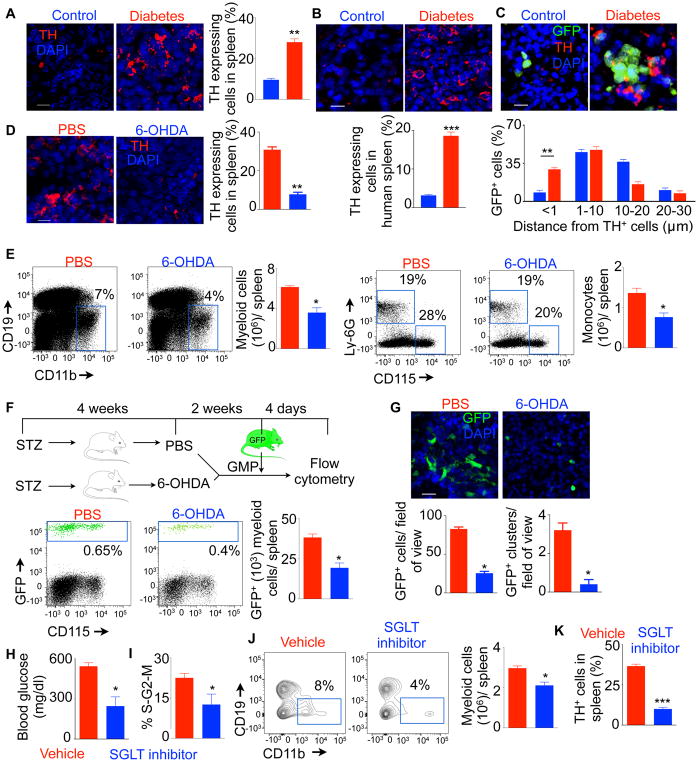
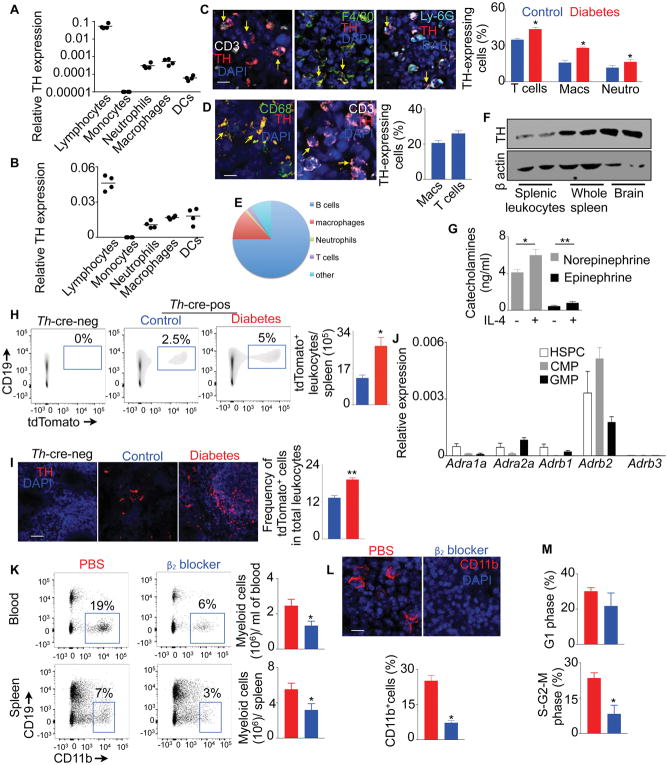
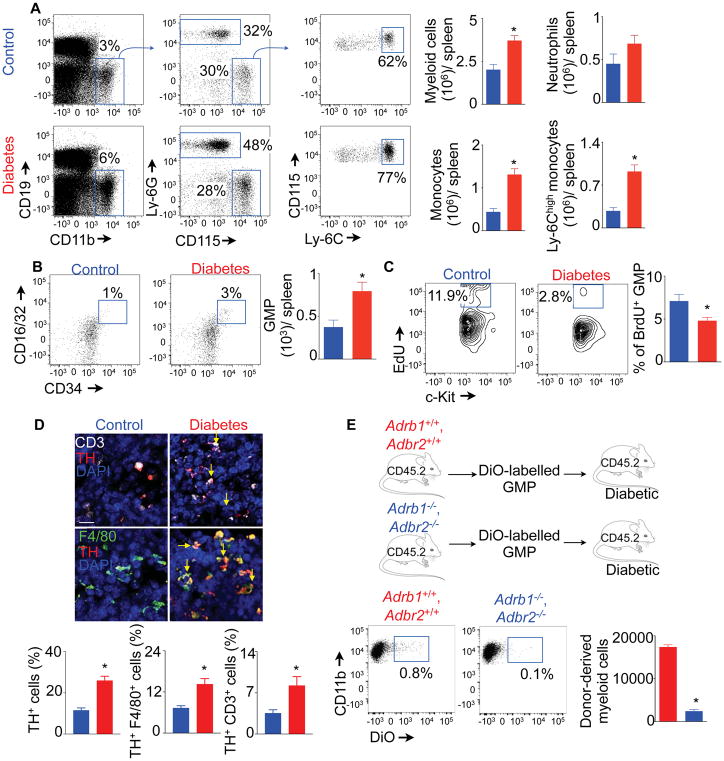
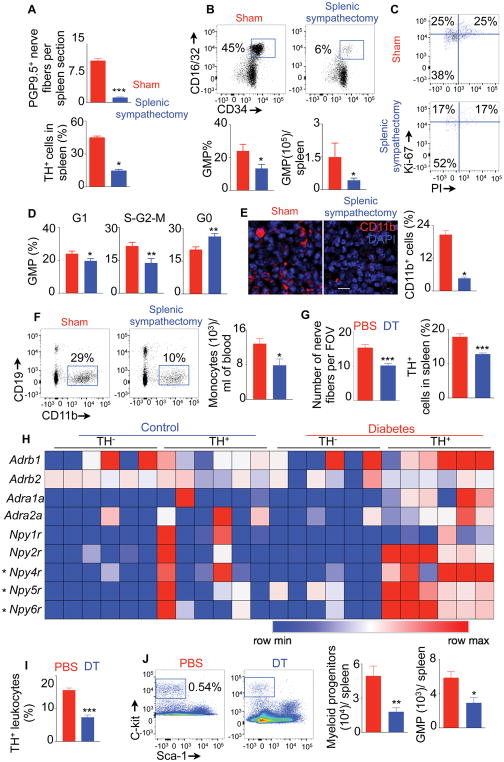
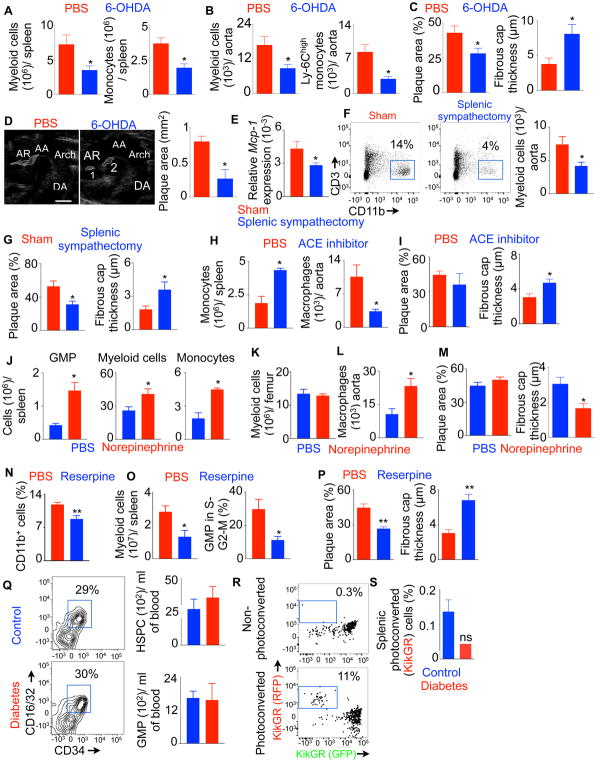
There is a growing body of research on the neural control of immunity and inflammation. However, it is not known whether the nervous system can regulate the production of inflammatory myeloid cells from hematopoietic progenitor cells in disease conditions. Myeloid cell numbers in diabetic patients were strongly correlated with plasma concentrations of norepinephrine, suggesting the role of sympathetic neuronal activation in myeloid cell production. The spleens of diabetic patients and mice contained higher numbers of tyrosine hydroxylase (TH)-expressing leukocytes that produced catecholamines. Granulocyte macrophage progenitors (GMPs) expressed the β2 adrenergic receptor, a target of catecholamines. Ablation of splenic sympathetic neuronal signaling using surgical, chemical, and genetic approaches diminished GMP proliferation and myeloid cell development. Finally, mice lacking TH-producing leukocytes had reduced GMP proliferation, resulting in diminished myelopoiesis. Taken together, our study demonstrates that catecholamines produced by leukocytes and sympathetic nerve termini promote GMP proliferation and myeloid cell development.

Keywords: GMP; adrenergic receptors; atherosclerosis; catecholamines; diabetes; myeloid progenitors; myelopoiesis; neuropeptide Y receptor; norepinephrine; sympathetic neuronal activation.


Conflict of interest statement

Conflict of interest: The authors have declared that no conflict of interest exists.

Figures

Fig. 1
Fig. 1. Plasma Norepinephrine (NE) concentrations strongly correlate with circulatory myeloid cell numbers in patients
A) Plasma NE concentrations are correlated with circulatory leukocyte, monocyte and inflammatory monocytes in patients. B) Catecholamine concentrations in diabetic patients. C) Correlation between NE and Hba1c in patients. D) Circulatory leukocyte, monocyte and inflammatory monocyte numbers determined by flow cytometry. E) Relative expression of the adrenergic receptors in GMP isolated from human spleens. n=4–8/group. Mean ± s.e.m. * P < 0.05, ** P < 0.01.
Fig. 2
Fig. 2. Splenic GMP proliferate and differentiate into myeloid cells in diabetic C57BL/6 mice
A) Shows representative flow cytometric gating strategy and quantification of splenic GMP. B) Quantification of BrdU+ GMP at the end of 10 days of chase after BrdU saturation. C) Quantitation of cell cycle regulating genes in splenic GMP using quantitative RT-PCR. Enumeration of donor-derived myeloid cells in the spleen after GFP+ GMP transfer in diabetic and non-diabetic control mice using flow cytometry (D) and confocal microscopy (E). Scale bar = 10 μm. F) Quantification of donor GMP-derived myeloid cells in sublethally irradiated mice. With an exception of Fig. 2F, all data are pooled from at least two independently performed experiments. n=10/group (A) and n=5–6 mice/group (B–F). Mean ± s.e.m. * P < 0.05, ** P < 0.01. Please also see Figure S1.
Fig. 3
Fig. 3. Splenic myelopoiesis is regulated by sympathetic neuronal activity in diabetic C57BL/6 mice
Immunofluorescent confocal images and quantification of tyrosine hydroxylase (TH)+ cells in the spleen of control and diabetic C57BL/6 mice (A) (Scale bar = 20 μm.) and humans (B) (Scale bar = 10 μm.). C) Measurement of distances between GFP+ splenocytes derived from transferred GMP and TH+ cells in the spleen. Scale bar = 10 μm. D) TH-stained cells in the spleen after 6-OHDA treatment. Scale bar = 20 μm. E) Representative flow cytometric plots and bar graphs showing quantification of myeloid cells after 6-OHDA treatment in the diabetic mice. Quantification of donor GMP-derived GFP+ myeloid cells after 6-OHDA treatment by flow cytometry (F) and confocal microscopy (G) (Scale bar = 20 μm). H) Fasting blood glucose concentrations after SGLT inhibitor treatment. Flow cytometric analysis for GMP proliferation (I) and myeloid cell enumeration (J). K) The frequency of TH-expressing splenic leukocytes was determined using confocal microscopy. All data except H–K are pooled from at least two independently performed experiments. n=8/ group (A–C), n=10/ group (D), n=6/ group (E–G) and n=4 / group (H–K). Mean ± s.e.m. * P < 0.05, ** P < 0.01, *** P < 0.001.
Fig. 4
Fig. 4. β2 adrenergic receptor blockade reduces splenic myelopoiesis
Quantitation of TH expression by lymphocytes (CD11b CD3+ or CD19+), monocytes (CD3 CD19 CD11b+ CD115+ Ly-6G), neutrophils (CD3 CD19 CD11b+ CD115 Ly-6G+), macrophages (CD3 CD19 F4/80+ CD64+) and DCs (CD3 CD19 F4/80 CD11c+) sorted from the spleens of non-diabetic C57BL/6 mice (A) and humans (B) using quantitative RT-PCR. Please also see Figure S2. Quantification of TH-expressing splenic T cells, macrophages and neutrophils in mouse (C) (Scale bar = 10 μm) and human (D) (Scale bar = 10 μm) spleens by confocal microscopy. E) Distribution of TH-tdTomato+ cells among various leukocyte population in non-diabetic Th-cre-ROSA-tdTOmato mice. Please also see Figure S3. F) Immuno blot to detect TH in sorted splenic leukocytes, whole spleen and brain of non-diabetic wild type mice. G) Catecholamine production by splenic macrophages in culture in the presence or absence of IL-4. Quantification of tdTomato+ leukocytes in Th-cre-ROSA-tdTOmato mice by flow cytometry (H) and immunofluorescence (I) (Scale bar = 100 μm). J) Quantification of mRNA amounts of the adrenergic receptors expressed by splenic hematopoietic progenitors sorted from non-diabetic mice using quantitative RT-PCR. K) Flow cytometric enumeration of myelo cells in the blood and spleen after β2 blocker treatment in diabetic mice. L) Confocal images and quantification of myeloid cells in the spleen after β2 blocker treatment in diabetic mice (Scale bar = 10 μm). M) Flow cytometric analysis of the cell cycle of GMP after β2 blocker treatment in diabetic mice. All data except Fig. 4B are pooled from two independently performed experiments. n=4/ group (A–D), n=2/ group (F), n=7/group (E, H & I), n=5/ group (G) and n=9–10/ group (K–M). Mean ± s.e.m. * P < 0.05, ** P < 0.01.
Fig. 5
Fig. 5. Sympathetic neuronal activation triggers myelopoiesis in type 2 diabetes
C57BL/6 mice were fed with a high fat diet for 16 weeks. A) Flow cytometric enumeration of myeloid cells in the spleens. B) Quantification of splenic GMP. C) Measurement of GMP proliferation with a BrdU dilution assay. D) Quantification of TH+ leukocytes, macrophages and T cells in the spleen. (Scale bar = 10 μm). E) Schematic representation of the experimental design and quantification of donor GMP-derived myeloid cells. All of the experiments were performed at least twice. n=8/ group (A&B) and n=8–12 mice/ group (C–E). Mean ± s.e.m. * P < 0.05, ** P < 0.01. See also Figure S6.
Fig. 6
Fig. 6. Splenic sympathectomy and TH+ leukocyte depletion diminish diabetes-induced splenic myelopoiesis
Quantification of splenic PGP9.5+ nerve fibers and TH-expressing cells (A), enumeration of splenic GMP (B) and cell cycle analysis of splenic GMP (C&D) after surgical splenic sympathectomy. E) Confocal images and quantification of CD11b+ myeloid cells in the spleen after surgical splenic sympathectomy. (Scale bar = 10 μm). F) Quantification of monocytes in the blood using flow cytometry. Scale bar = 10 μm. G) Quantification of splenic nerve termini and TH-expressing leukocytes in the spleen after DT injection in Th-cre-ROSA-iDTR mice transplanted with wild type BM cells. H) Adrenergic receptors and neuropeptide Y (NPY) receptors were quantified by PCR array in TH+ and TH cells isolated from the spleens of non-diabetic and diabetic Th-cre-ROSA-tdTomato mice. I) Quantification of TH+ splenic leukocytes after DT injection in wild type mice reconstituted with BM from Th-cre-ROSA-iDTR. J) Myeloid progenitor and GMP numbers in the spleen determined by flow cytometry after TH+ leukocyte depletion. All data are pooled from at least two independently performed experiments. n=8–9/group (A–D), n=8/group (E–G) and n=6–7 mice/ group (H–J). Mean ± s.e.m. *P < 0.05, ** P < 0.01, *** P < 0.001. Please also see Figure S4.
Fig. 7
Fig. 7. Sympathetic neuronal activation in diabetes accelerates atherosclerosis
A) Flow cytometric quantification of splenic myeloid cells in diabetic Apoe/− mice after 6-OHDA treatment. B) The bar graphs depict quantification of myeloid cells in the aorta. C) Quantification of atherosclerotic plaque area and fibrous cap thickness by Masson’s trichrome staining. D) Representative ultrasound images showing plaques in the aortic root. The bar graph shows quantification of atherosclerotic plaque area. (Scale bar = 1 mm). E) Relative Mcp-1 expression in the aorta of diabetic Apoe−/− mice after sham surgery or splenic sympathectomy. Enumeration of myeloid cells in the aortas (F) and histological analysis of atherosclerotic plaques (G) of Apoe−/− mice at 4 weeks after splenic sympathectomy. ACE inhibitor, NE, reserpine or PBS was administered into the spleens of diabetic Apoe−/− mice using micro-osmotic pumps for three weeks. H–P) Myeloid cells in the spleen, BM and aorta were enumerated by flow cytometry. Atherosclerotic plaque area and fibrous cap thickness were quantified using Masson’s trichrome staining. n=5 per group. Q) Hematopoietic progenitors in the blood were quantified in non-diabetic (control) and diabetic mice. n=4 per group. R) Representative flow cytometric plots showing photoconverted cells in the calvarium of KikGR mice. S) Enumeration of the photoconverted cells in the spleen. n=3–11 per group. n=6–8/ group (A,B,C), n=8–9/ group (D–G), n=4–5/ group (H–Q) and n=3–11 mice/ group (R&S). Mean ± s.e.m. * P < 0.05, ** P < 0.01. Please also see Figures S5–7.

Comment in

Similar articles

Cited by

References

    1. Andersson U, Tracey KJ. Neural reflexes in inflammation and immunity. J Exp Med. 2012;209:1057–1068. - PMC - PubMed
    1. Barnes MA, Carson MJ, Nair MG. Non-traditional cytokines: How catecholamines and adipokines influence macrophages in immunity, metabolism and the central nervous system. Cytokine. 2015;72:210–219. - PMC - PubMed
    1. Bokhari S, Plummer E, Emmerson P, Gupta A, Meyer C. Glucose counterregulation in advanced type 2 diabetes: effect of beta-adrenergic blockade. Diabetes Care. 2014;37:3040–3046. - PubMed
    1. Brown SW, Meyers RT, Brennan KM, Rumble JM, Narasimhachari N, Perozzi EF, Ryan JJ, Stewart JK, Fischer-Stenger K. Catecholamines in a macrophage cell line. J Neuroimmunol. 2003;135:47–55. - PubMed
    1. Carnevale D, Pallante F, Fardella V, Fardella S, Iacobucci R, Federici M, Cifelli G, De Lucia M, Lembo G. The angiogenic factor PlGF mediates a neuroimmune interaction in the spleen to allow the onset of hypertension. Immunity. 2014;41:737–752. - PubMed

Publication types

MeSH terms

Substances