

Intestinal β-carotene bioconversion in humans is determined by a new single-sample, plasma isotope ratio method and compared with traditional and modified area-under-the-curve methods
- PMID: 29958897
- PMCID: PMC6094152
- DOI: 10.1016/j.abb.2018.06.015
Intestinal β-carotene bioconversion in humans is determined by a new single-sample, plasma isotope ratio method and compared with traditional and modified area-under-the-curve methods
Abstract
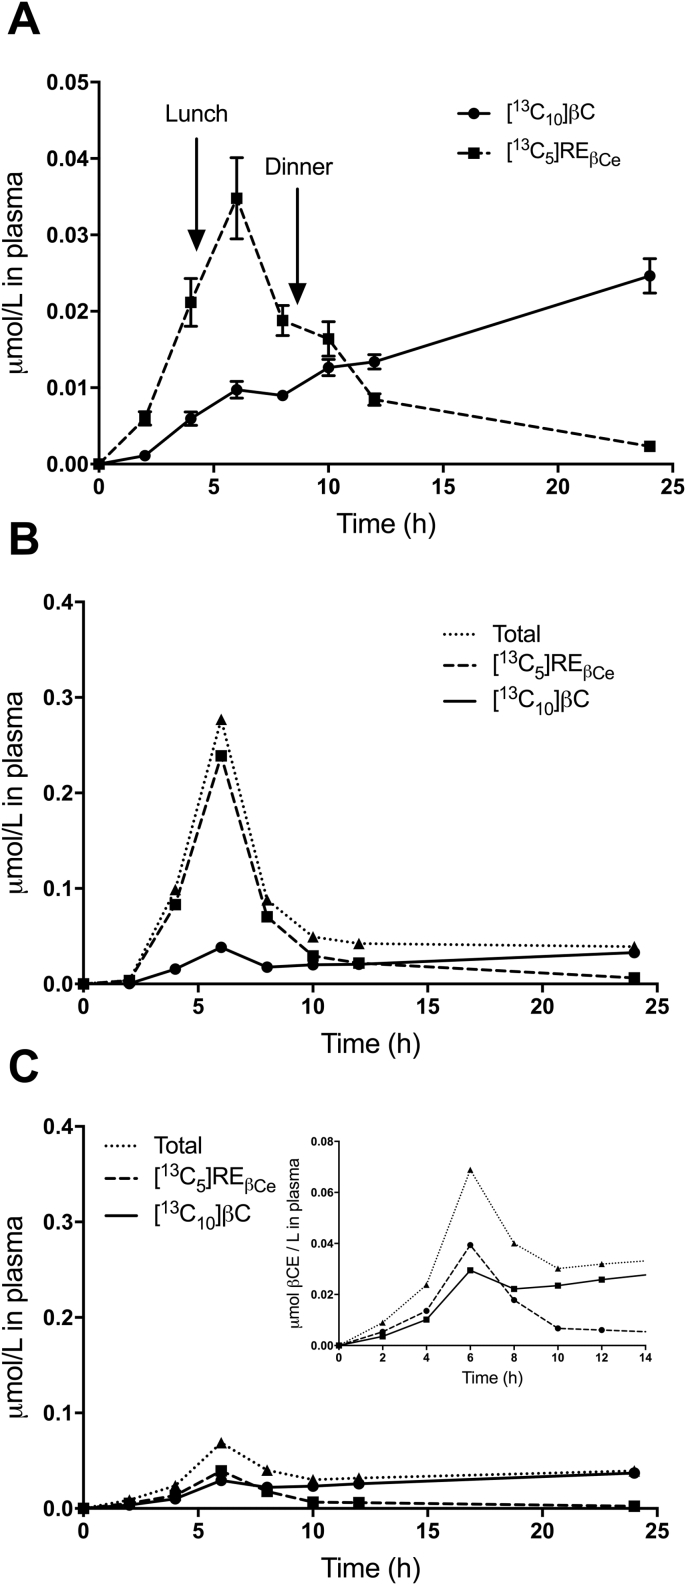
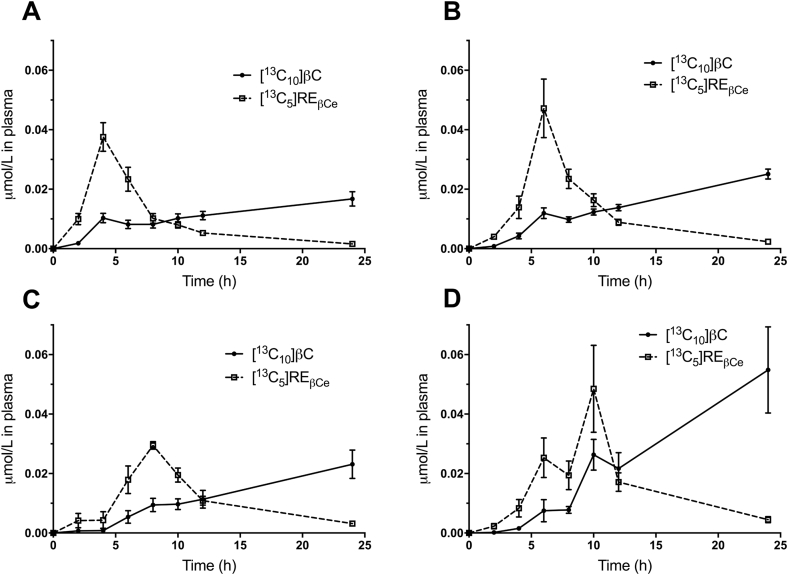
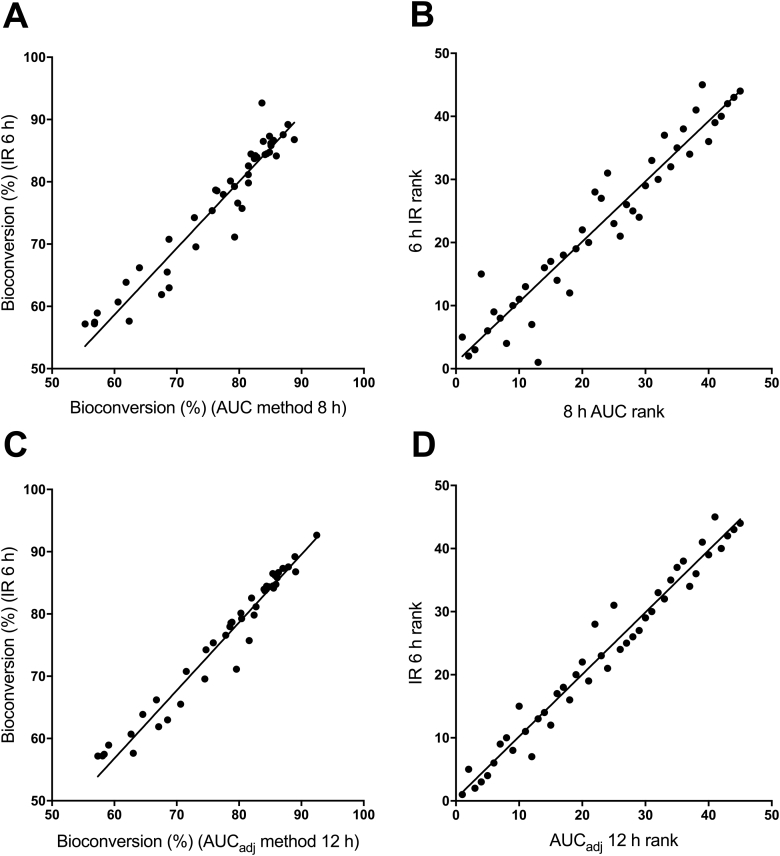
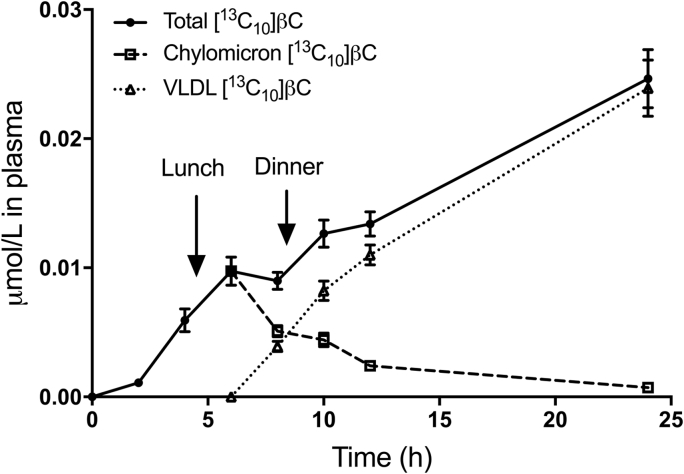
The vitamin A value (bioefficacy) of provitamin A carotenoids is determined by absorption of the carotenoid (bioavailability) and its subsequent conversion to retinol (bioconversion). Here we show that intestinal bioconversion of β-carotene can be estimated based on analysis of a single plasma sample collected 6 h after subjects ingest a test dose of stable isotope-labeled β-carotene from the ratio of retinyl esters to retinyl esters plus β-carotene. Plasma isotope ratio predictions of bioconversion ranged from 50 to- 93% (mean 76%) for 45 healthy young adults with low vitamin A stores. Results were the same as predictions made by a traditional area-under-the-curve method calculated from 0 to- 8 h or a modified area-under-the-curve method calculated from 0 to- 12 h. The modified method may provide better estimates of bioconversion between 8 and 24 h after ingestion of a carotenoid dose when stable isotopes cannot be used due to cost or logistics. Furthermore, because the plasma isotope ratio method requires only one blood sample and no isolation of triglyceride-rich lipoproteins, its use will facilitate estimation of provitamin A carotenoid bioconversion in human subjects and especially children, in whom repeated blood sampling is not feasible.
Keywords: Area under the curve; Carotenoid bioconversion; Carotenoid bioefficacy; Vitamin A; β-Carotene.
Copyright © 2018. Published by Elsevier Inc.
Figures
Similar articles
-
A Simple Plasma Retinol Isotope Ratio Method for Estimating β-Carotene Relative Bioefficacy in Humans: Validation with the Use of Model-Based Compartmental Analysis.J Nutr. 2017 Sep;147(9):1806-1814. doi: 10.3945/jn.117.252361. Epub 2017 Jul 26. J Nutr. 2017. PMID: 28747484
-
An LC/MS/MS method for stable isotope dilution studies of β-carotene bioavailability, bioconversion, and vitamin A status in humans.J Lipid Res. 2014 Feb;55(2):319-28. doi: 10.1194/jlr.D040204. Epub 2013 Oct 24. J Lipid Res. 2014. PMID: 24158962 Free PMC article.
-
Plasma Retinol Kinetics and β-Carotene Bioefficacy Are Quantified by Model-Based Compartmental Analysis in Healthy Young Adults with Low Vitamin A Stores.J Nutr. 2016 Oct;146(10):2129-2136. doi: 10.3945/jn.116.233486. Epub 2016 Aug 10. J Nutr. 2016. PMID: 27511941 Free PMC article.
-
Influence of dietary fat on beta-carotene absorption and bioconversion into vitamin A.Nutr Rev. 2002 Apr;60(4):104-10. doi: 10.1301/00296640260085831. Nutr Rev. 2002. PMID: 12002680 Review.
-
Quantification of the "SLAMENGHI" factors for carotenoid bioavailability and bioconversion.Int J Vitam Nutr Res. 1998;68(6):371-7. Int J Vitam Nutr Res. 1998. PMID: 9857264 Review.
Cited by
-
Vitamin A Absorption Efficiency Determined by Compartmental Analysis of Postprandial Plasma Retinyl Ester Kinetics in Theoretical Humans.J Nutr. 2020 Aug 1;150(8):2223-2229. doi: 10.1093/jn/nxaa176. J Nutr. 2020. PMID: 32614427 Free PMC article.
-
Nanoparticles Loaded with a Carotenoid-Rich Extract from Cantaloupe Melon Improved Hepatic Retinol Levels in a Diet-Induced Obesity Preclinical Model.ACS Omega. 2023 Jul 26;8(31):28475-28486. doi: 10.1021/acsomega.3c02750. eCollection 2023 Aug 8. ACS Omega. 2023. PMID: 37576634 Free PMC article.
-
Vitamin A Absorption Determined in Rats Using a Plasma Isotope Ratio Method.J Nutr. 2020 Jul 1;150(7):1977-1981. doi: 10.1093/jn/nxaa092. J Nutr. 2020. PMID: 32271921 Free PMC article.
-
Scientific opinion on the tolerable upper intake level for preformed vitamin A and β-carotene.EFSA J. 2024 Jun 6;22(6):e8814. doi: 10.2903/j.efsa.2024.8814. eCollection 2024 Jun. EFSA J. 2024. PMID: 38846679 Free PMC article.
-
Novel Spectrophotometric Method for Robust Detection of Trace Copper and Cobalt in High-Concentration Zinc Solution.Molecules. 2024 Dec 6;29(23):5765. doi: 10.3390/molecules29235765. Molecules. 2024. PMID: 39683921 Free PMC article.
References
-
- Haskell M.J. The challenge to reach nutritional adequacy for vitamin A: β-carotene bioavailability and conversion – evidence in humans. Am. J. Clin. Nutr. 2012;96(suppl):1193S–1203S. - PubMed
-
- Castenmiller J.J.M., West C.E. Bioavailability and bioconversion of carotenoids. Annu. Rev. Nutr. 1998;18:19–38. - PubMed
-
- van Lieshout M., West C.E., van Breemen R.B. Isotopic tracer techniques for studying the bioavailability and bioefficacy of dietary carotenoids, particularly β-carotene, in humans: a review. Am. J. Clin. Nutr. 2003;77(1):12–28. - PubMed
-
- Van Loo-Bouwman C.A., Naber T.H.J., Schaafsma G. A review of vitamin A equivalency of β-carotene in various food matrices for human consumption. Br. J. Nutr. 2014;111:2153–2166. - PubMed
Publication types
MeSH terms
Substances
Grants and funding
LinkOut - more resources
Full Text Sources
Other Literature Sources
