. 2018 Sep;46(9):1310-1319.
doi: 10.1124/dmd.118.082008. Epub 2018 Jun 29.

Glycyrrhizin Alleviates Nonalcoholic Steatohepatitis via Modulating Bile Acids and Meta-Inflammation

Affiliations

Glycyrrhizin Alleviates Nonalcoholic Steatohepatitis via Modulating Bile Acids and Meta-Inflammation

Tingting Yan et al. Drug Metab Dispos. 2018 Sep.

Abstract

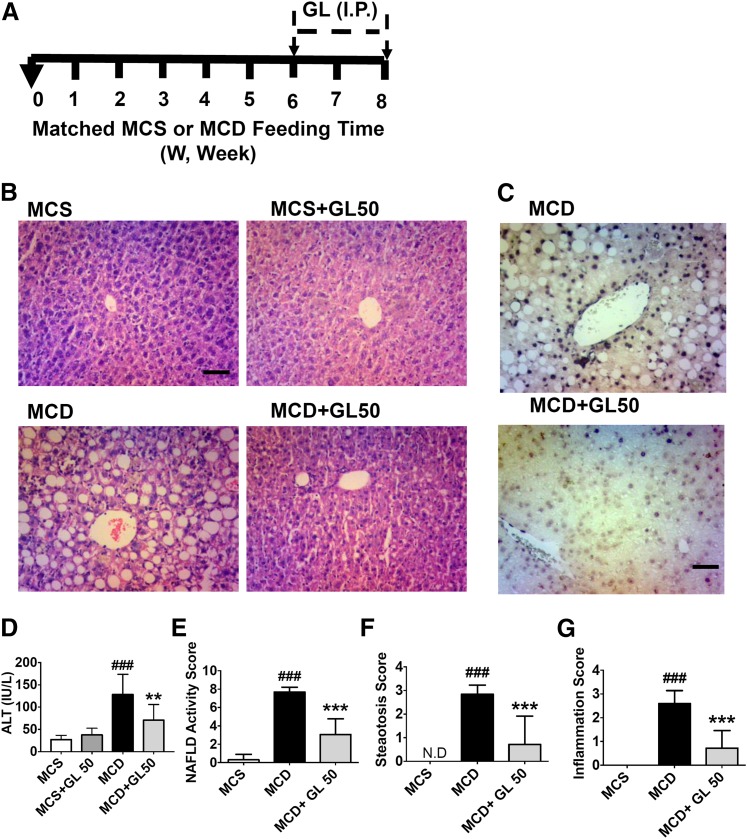
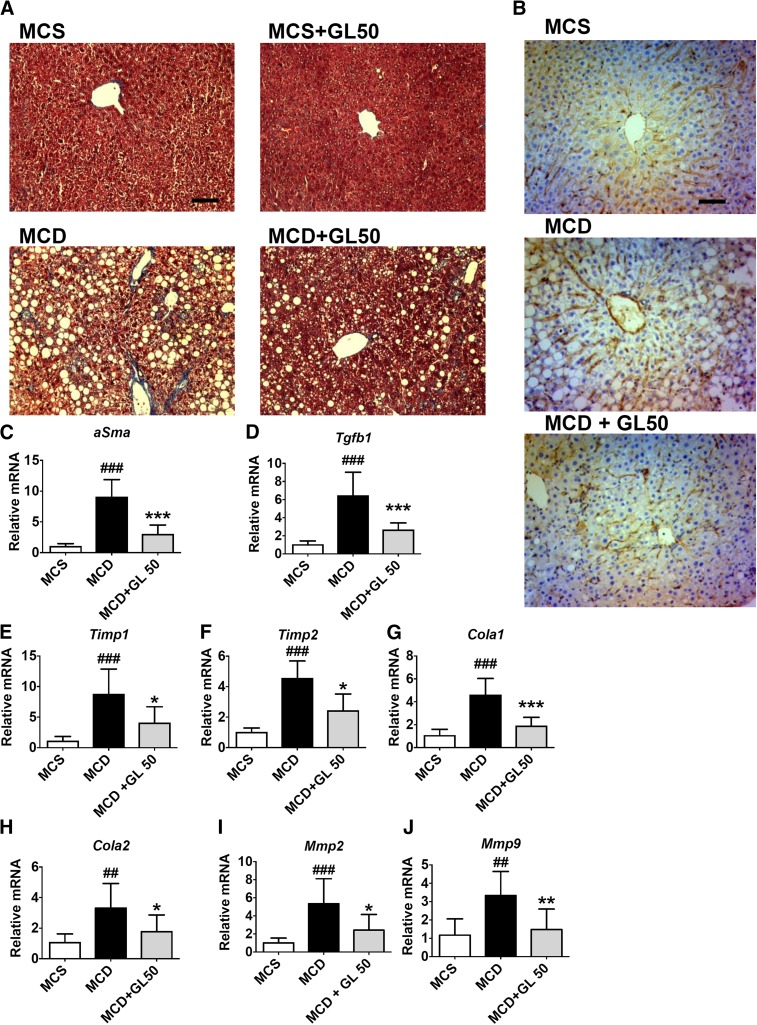
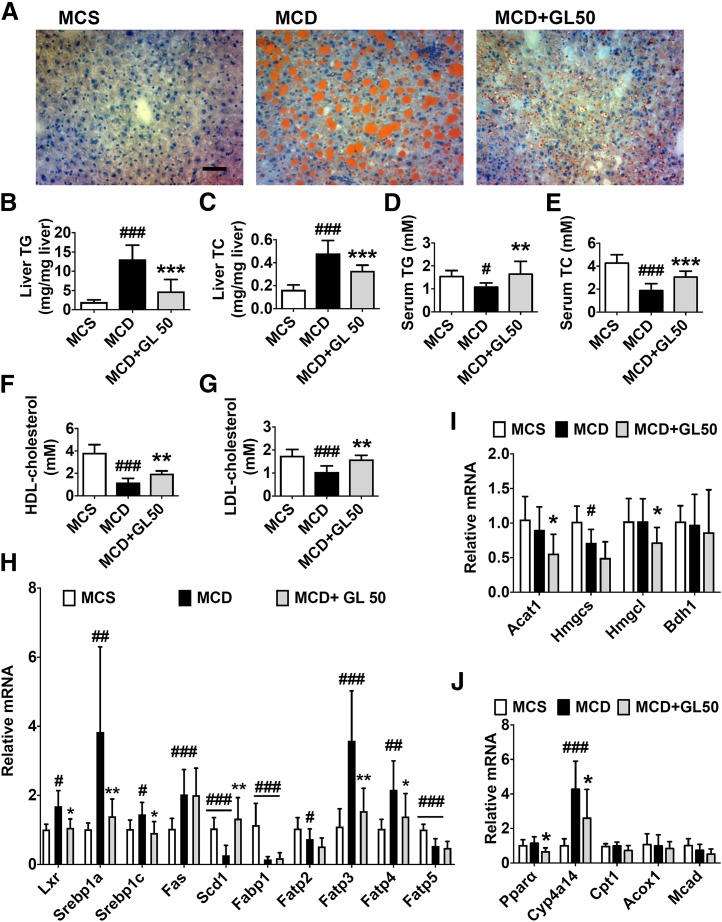
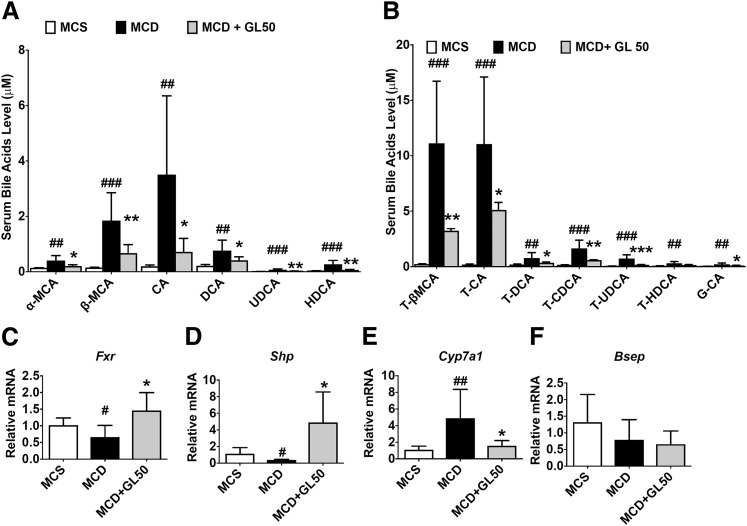
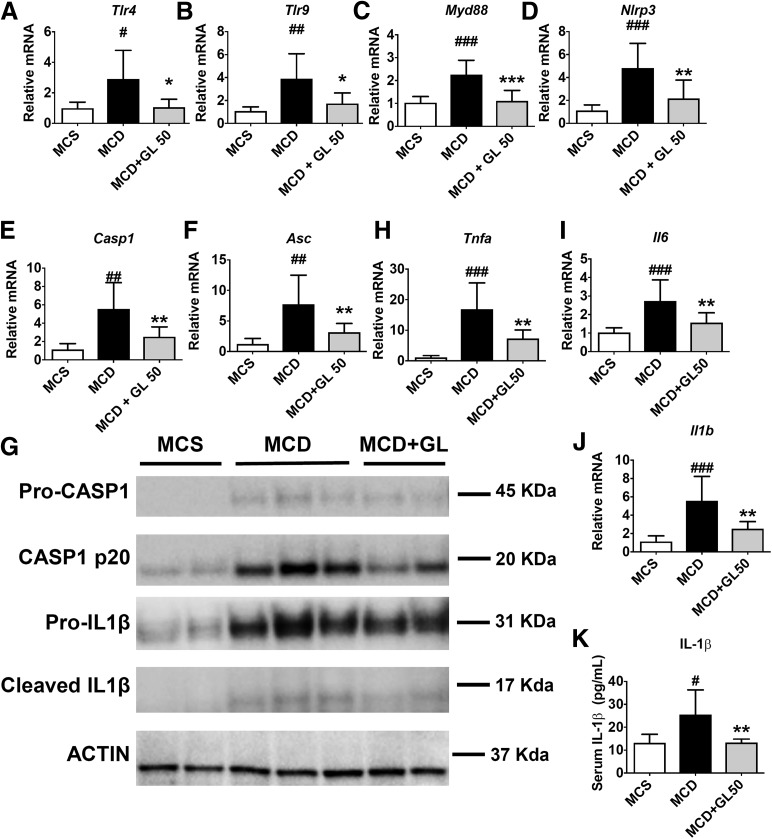
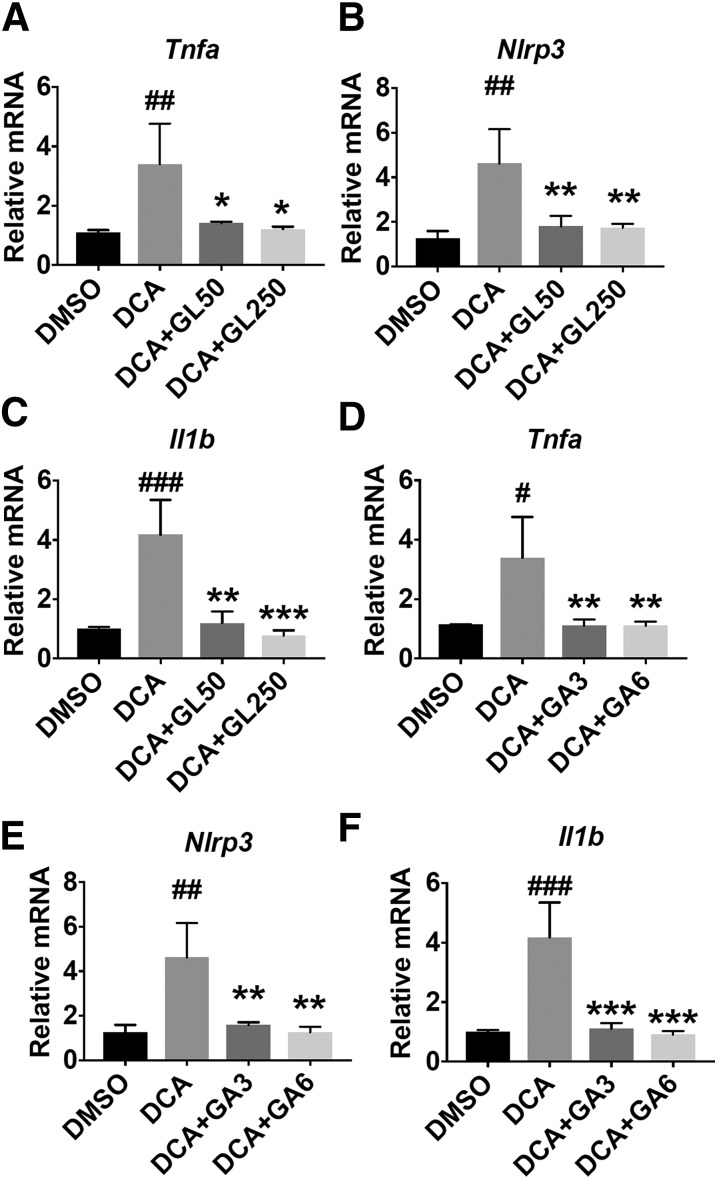
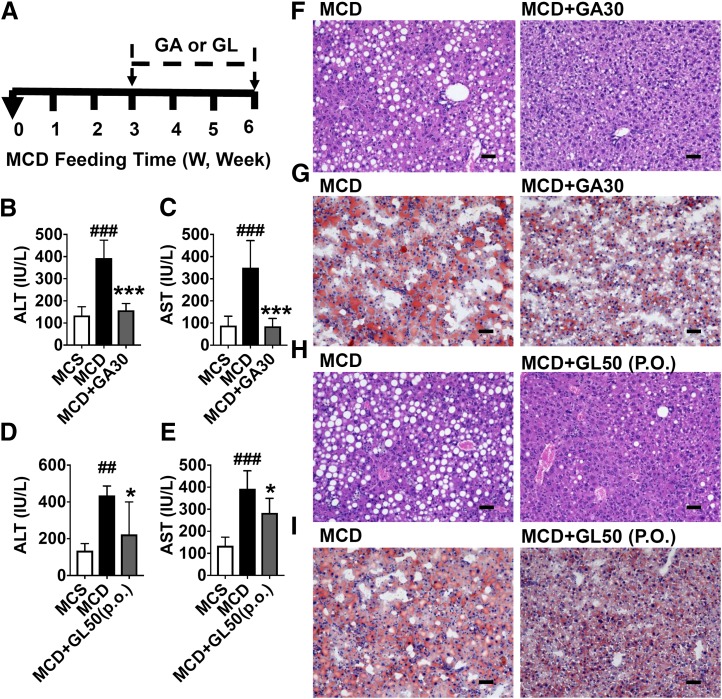
Nonalcoholic steatohepatitis (NASH) is the progressive stage of nonalcoholic fatty liver disease that may ultimately lead to cirrhosis and liver cancer, and there are few therapeutic options for its treatment. Glycyrrhizin (GL), extracted from the traditional Chinese medicine liquorice, has potent hepatoprotective effects in both preclinical animal models and in humans. However, little is currently known about its effects and mechanisms in treating NASH. To explore the effects of GL on NASH, GL or its active metabolite glycyrrhetinic acid (GA) was administered to mice treated with a methionine- and choline-deficient (MCD) diet-induced NASH model, and histologic and biochemical analyses were used to measure the degree of lipid disruption, liver inflammation, and fibrosis. GL significantly improved MCD diet-induced hepatic steatosis, inflammation, and fibrosis and inhibited activation of the NLR family pyrin domain-containing 3 (NLRP3) inflammasome. GL significantly attenuated serum bile acid accumulation in MCD diet-fed mice partially by restoring inflammation-mediated hepatic farnesoid X receptor inhibition. In Raw 264.7 macrophage cells, both GL and GA inhibited deoxycholic acid-induced NLRP3 inflammasome-associated inflammation. Notably, both intraperitoneal injection of GL's active metabolite GA and oral administration of GL prevented NASH in mice, indicating that GL may attenuate NASH via its active metabolite GA. These results reveal that GL, via restoration of bile acid homeostasis and inhibition of inflammatory injury, can be a therapeutic option for treatment of NASH.


Figures

Fig. 1.
Fig. 1.
GL significantly alleviates MCD diet-induced liver damage, improves TUNEL staining, and reduces serum transaminases. (A) Mouse experiment procedure scheme. (B) H&E staining of liver sections. (C) TUNEL staining analysis of paraffin-embedded livers. (D) Serum ALT levels. (E–G) NAFLD scoring statistics for H&E slides for NAFLD activity (E), steatosis scores (F), and inflammation scores (G). Data are presented as means ± S.D. Statistical differences between experimental groups were determined by the two-tailed t test (n = 6–8 for each group). **P < 0.01; ***P < 0.001 vs. the MCD group; ###P < 0.001 vs. the MCS group. H&E, hematoxylin and eosin; TUNEL, terminal deoxynucleotidyl transferase–mediated digoxigenin-deoxyuridine nick-end labeling. Original magnification, ×20. Scale bar, 50 µm.
Fig. 2.
Fig. 2.
GL significantly dampens MCD-induced liver fibrogenesis. (A and B) Masson trichrome staining (A) and immunohistochemistry staining of α-SMA (B) for paraffin-embedded livers. (C–F) Levels of αSma (C), Tgfb1 (D), Timp1 (E), and Timp2 (F) mRNAs in the liver. (G–J) Levels of Cola1 (G), Cola2 (H), Mmp2 (I), and Mmp9 (J) mRNAs in the liver. Data are presented as means ± S.D. Statistical differences between experimental groups were determined by the two-tailed t test (n = 6–8 in each group). *P < 0.05; **P < 0.01; ***P < 0.001 vs. the MCD group; ##P < 0.01; ###P < 0.001 vs. the MCS group. Cola, collagen; Mmp, matrix metalloproteinase; Sma, smooth muscle actin; Tgfb1, transforming growth factor β-1; Timp, tissue inhibitor of metalloproteinases. Original magnification, ×20. Scale bar, 50 μm.
Fig. 3.
Fig. 3.
GL significantly reduces MCD-induced lipid accumulation in the liver via inhibiting fatty acid uptake. (A) Oil Red O staining of liver sections. (B and C) Levels of liver TG (B) and TC (C). (D and E) Levels of serum TG (D) and TC (E). (F and G) Levels of serum HDL cholesterol (F) and LDL cholesterol (G). (H–J) Effect of GL in the mRNA expression involved in the pathway of lipogenesis (H), ketogenesis (I), and β-oxidation (J). Data are presented as means ± S.D. Statistical differences between experimental groups were determined by the two-tailed t test (n = 6–8 in each group). *P < 0.05; **P < 0.01; ***P < 0.001 vs. MCD group; #P < 0.05; ##P < 0.01; ###P < 0.001 vs. the MCS group. HDL, high-density lipoprotein; LDL, low-density lipoprotein. Original magnification, ×20. Scale bar, 50 μm.
Fig. 4.
Fig. 4.
GL activates liver FXR/SHP/CYP7A1 signaling and rescues MCD-induced bile acid disruption. (A) Serum level of free bile acids α-MCA, β-MCA, CA, DCA, UDCA, and HDCA. (B) Serum level of conjugated bile acids T-β-MCA, T-CA, T-DCA, T-CDCA, T-UDCA, T-HDCA, and G-CA. (C–F) Hepatic mRNA levels of Fxr (C), Shp (D), Cyp7a1 (E), and Bsep (F). Data are presented as means ± S.D. Statistical differences between experimental groups were determined by the two-tailed t test (n = 6–8 in each group). *P < 0.05; **P < 0.01; ***P < 0.001 vs. the MCD group; #P < 0.05; ##P < 0.01; ###P < 0.001 vs. the MCS group. Bsep, bile salt export pump; CDCA, chenodeoxycholic acid; G-CA, glycocholic acid; HDCA, hyodeoxycholic acid; UDCA, ursodeoxycholic acid.
Fig. 5.
Fig. 5.
GL significantly reduces MCD-induced TLR/NLRP3 inflammasome activation and related meta-inflammation. (A–C) mRNA levels of Tlr4 (A), Tlr9 (B), and Myd88 (C) in the liver. (D–F) mRNA levels of Nlrp3 (D), Casp1 (E), and Asc (F) in the liver. (G) Western blot analysis of pro-CASP1, cleaved CASP1, pro–IL-1β, and cleaved IL-1β in the liver. (H–J) mRNA levels of proinflammatory cytokines Tnfa (H), Il6 (I), and Il1b (J) in the liver. (K) ELISA analysis of serum IL-1β levels in mice. Data are presented as means ± S.D. Statistical differences between experimental groups were determined by the two-tailed t test (n = 6–8 in each group). *P < 0.05; **P < 0.01; ***P < 0.001 vs. the MCD group; #P < 0.05; ##P < 0.01; ###P < 0.001 vs. the MCS group. Asc, apoptosis-associated speck-like protein containing a caspase recruitment domain; ELISA, enzyme-linked immunosorbent assay; Myd88, myeloid differentiation primary response 88.
Fig. 6.
Fig. 6.
Both GL and GA significantly inhibit DCA-induced Tnfa, Nlrp3, and Il1b mRNA. (A–C) Effect of GL in DCA-induced mRNA of Tnfa (A), Nlrp3 (B), and Il1b (C) mRNAs in Raw 264.7 cells. (D–F) Effect of GA in DCA-induced Tnfa (D), Nlrp3 (E), and I11b (F) mRNAs in Raw 264.7 cells. Data are presented as means ± S.D. Statistical differences were determined by one-way analysis of variance followed by the Dunnett multiple-comparisons test among multiple-group comparisons (n = 3 per group). Raw 264.7 cells were pretreated with 0.1% DMSO, GL, or GA for 30 minutes and then treated with 200 μM DCA for an additional 4 hours to further perform mRNA analysis. *P < 0.05; **P < 0.01; ***P < 0.001 vs. the DCA group; #P < 0.05; ##P < 0.01; ###P < 0.001 vs. the DMSO group. DMSO, dimethylsulfoxide.
Fig. 7.
Fig. 7.
GL’s active metabolite, GA, significantly reduces MCD-induced liver injury. (A) Mouse experiment procedure scheme. (B and C) Levels of serum ALT (B) and AST (C) in saline- or GA-treated mice. (D and E) Levels of serum ALT (D) and AST (E) in saline- or GL gavage-treated mice. (F and G) Representative H&E staining (F) and Oil Red O staining (G) for livers from the MCD group and the MCD+GA30 group. (H and I) Representative H&E staining (H) and Oil Red O staining (I) for livers from the MCD group and MCD+GL50 (p.o.) group. Data are presented as means ± S.D. Statistical differences between experimental groups were determined by the two-tailed t test (n = 5 in each group). *P < 0.05 and ***P < 0.001 vs. the MCD group; ##P < 0.01 and ###P < 0.001 vs. the MCS group. H&E, hematoxylin and eosin. Original magnification, 20×; Scale bar, 50 μm.

References

    1. Akao T, Hayashi T, Kobashi K, Kanaoka M, Kato H, Kobayashi M, Takeda S, Oyama T. (1994) Intestinal bacterial hydrolysis is indispensable to absorption of 18 beta-glycyrrhetic acid after oral administration of glycyrrhizin in rats. J Pharm Pharmacol 46:135–137. - PubMed
    1. Arab JP, Karpen SJ, Dawson PA, Arrese M, Trauner M. (2017) Bile acids and nonalcoholic fatty liver disease: molecular insights and therapeutic perspectives. Hepatology 65:350–362. - PMC - PubMed
    1. Bechmann LP, Kocabayoglu P, Sowa JP, Sydor S, Best J, Schlattjan M, Beilfuss A, Schmitt J, Hannivoort RA, Kilicarslan A, et al. (2013) Free fatty acids repress small heterodimer partner (SHP) activation and adiponectin counteracts bile acid-induced liver injury in superobese patients with nonalcoholic steatohepatitis. Hepatology 57:1394–1406. - PubMed
    1. Chaurasia B, Summers SA. (2015) Ceramides - lipotoxic inducers of metabolic disorders. Trends Endocrinol Metab 26:538–550. - PubMed
    1. Duewell P, Kono H, Rayner KJ, Sirois CM, Vladimer G, Bauernfeind FG, Abela GS, Franchi L, Nuñez G, Schnurr M, et al. (2010) NLRP3 inflammasomes are required for atherogenesis and activated by cholesterol crystals. Nature 464:1357–1361. - PMC - PubMed

Publication types

MeSH terms