Dual Src and MEK Inhibition Decreases Ovarian Cancer Growth and Targets Tumor Initiating Stem-Like Cells
- PMID: 29959144
- PMCID: PMC6557165
- DOI: 10.1158/1078-0432.CCR-17-3697
Dual Src and MEK Inhibition Decreases Ovarian Cancer Growth and Targets Tumor Initiating Stem-Like Cells
Abstract
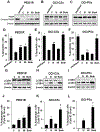
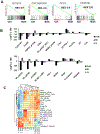
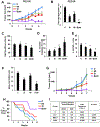
Purpose: Rational targeted therapies are needed for treatment of ovarian cancers. Signaling kinases Src and MAPK are activated in high-grade serous ovarian cancer (HGSOC). Here, we tested the frequency of activation of both kinases in HGSOC and the therapeutic potential of dual kinase inhibition.Experimental Design: MEK and Src activation was assayed in primary HGSOC from The Cancer Genome Atlas (TGGA). Effects of dual kinase inhibition were assayed on cell-cycle, apoptosis, gene, and proteomic analysis; cancer stem cells; and xenografts.Results: Both Src and MAPK are coactivated in 31% of HGSOC, and this associates with worse overall survival on multivariate analysis. Frequent dual kinase activation in HGSOC led us to assay the efficacy of combined Src and MEK inhibition. Treatment of established lines and primary ovarian cancer cultures with Src and MEK inhibitors saracatinib and selumetinib, respectively, showed target kinase inhibition and synergistic induction of apoptosis and cell-cycle arrest in vitro, and tumor inhibition in xenografts. Gene expression and proteomic analysis confirmed cell-cycle inhibition and autophagy. Dual therapy also potently inhibited tumor-initiating cells. Src and MAPK were both activated in tumor-initiating populations. Combination treatment followed by drug washout decreased sphere formation and ALDH1+ cells. In vivo, tumors dissociated after dual therapy showed a marked decrease in ALDH1 staining, sphere formation, and loss of tumor-initiating cells upon serial xenografting.Conclusions: Selumetinib added to saracatinib overcomes EGFR/HER2/ERBB2-mediated bypass activation of MEK/MAPK observed with saracatinib alone and targets tumor-initiating ovarian cancer populations, supporting further evaluation of combined Src-MEK inhibition in clinical trials. Clin Cancer Res; 24(19); 4874-86. ©2018 AACR.
©2018 American Association for Cancer Research.
Conflict of interest statement
Figures


Similar articles
-
Src Inhibition with saracatinib reverses fulvestrant resistance in ER-positive ovarian cancer models in vitro and in vivo.Clin Cancer Res. 2012 Nov 1;18(21):5911-23. doi: 10.1158/1078-0432.CCR-12-1257. Epub 2012 Aug 15. Clin Cancer Res. 2012. PMID: 22896656 Free PMC article.
-
MAPK Activation Predicts Poor Outcome and the MEK Inhibitor, Selumetinib, Reverses Antiestrogen Resistance in ER-Positive High-Grade Serous Ovarian Cancer.Clin Cancer Res. 2016 Feb 15;22(4):935-47. doi: 10.1158/1078-0432.CCR-15-0534. Epub 2015 Oct 19. Clin Cancer Res. 2016. PMID: 26482043 Free PMC article.
-
Antitumor activity of saracatinib (AZD0530), a c-Src/Abl kinase inhibitor, alone or in combination with chemotherapeutic agents in gastric cancer.Mol Cancer Ther. 2013 Jan;12(1):16-26. doi: 10.1158/1535-7163.MCT-12-0109. Epub 2012 Nov 9. Mol Cancer Ther. 2013. PMID: 23144237
-
Combined Src and aromatase inhibition impairs human breast cancer growth in vivo and bypass pathways are activated in AZD0530-resistant tumors.Clin Cancer Res. 2009 May 15;15(10):3396-405. doi: 10.1158/1078-0432.CCR-08-3127. Clin Cancer Res. 2009. PMID: 19451593
-
Repurposing Food and Drug Administration-approved cancer therapies: exploring endocrine and targeted pathways in low-grade serous ovarian cancer treatment.Int J Gynecol Cancer. 2025 May 15:101938. doi: 10.1016/j.ijgc.2025.101938. Online ahead of print. Int J Gynecol Cancer. 2025. PMID: 40480868 Review.
Cited by
-
Tuning Cancer Fate: Tumor Microenvironment's Role in Cancer Stem Cell Quiescence and Reawakening.Front Immunol. 2020 Oct 21;11:2166. doi: 10.3389/fimmu.2020.02166. eCollection 2020. Front Immunol. 2020. PMID: 33193295 Free PMC article. Review.
-
PTPRS drives adaptive resistance to MEK/ERK inhibitors through SRC.Oncotarget. 2019 Nov 26;10(63):6768-6780. doi: 10.18632/oncotarget.27335. eCollection 2019 Nov 26. Oncotarget. 2019. PMID: 31827720 Free PMC article.
-
Gut-Vaginal Microbiome Crosstalk in Ovarian Cancer: Implications for Early Diagnosis.Pathogens. 2025 Jun 25;14(7):635. doi: 10.3390/pathogens14070635. Pathogens. 2025. PMID: 40732683 Free PMC article. Review.
-
ALDH1: A potential therapeutic target for cancer stem cells in solid tumors.Front Oncol. 2022 Oct 28;12:1026278. doi: 10.3389/fonc.2022.1026278. eCollection 2022. Front Oncol. 2022. PMID: 36387165 Free PMC article. Review.
-
HLF promotes ovarian cancer progression and chemoresistance via regulating Hippo signaling pathway.Cell Death Dis. 2023 Sep 14;14(9):606. doi: 10.1038/s41419-023-06076-5. Cell Death Dis. 2023. PMID: 37709768 Free PMC article.
References
-
- Burger RA, Brady MF, Bookman MA, Fleming GF, Monk BJ, Huang H, et al. Incorporation of bevacizumab in the primary treatment of ovarian cancer. N Engl J Med 2011;365(26):2473–83. - PubMed
Publication types
MeSH terms
Substances
Grants and funding
LinkOut - more resources
Full Text Sources
Other Literature Sources
Medical
Molecular Biology Databases
Research Materials
Miscellaneous

