RNase H2, mutated in Aicardi-Goutières syndrome, promotes LINE-1 retrotransposition
- PMID: 29959219
- PMCID: PMC6068448
- DOI: 10.15252/embj.201798506
RNase H2, mutated in Aicardi-Goutières syndrome, promotes LINE-1 retrotransposition
Abstract
Long INterspersed Element class 1 (LINE-1) elements are a type of abundant retrotransposons active in mammalian genomes. An average human genome contains ~100 retrotransposition-competent LINE-1s, whose activity is influenced by the combined action of cellular repressors and activators. TREX1, SAMHD1 and ADAR1 are known LINE-1 repressors and when mutated cause the autoinflammatory disorder Aicardi-Goutières syndrome (AGS). Mutations in RNase H2 are the most common cause of AGS, and its activity was proposed to similarly control LINE-1 retrotransposition. It has therefore been suggested that increased LINE-1 activity may be the cause of aberrant innate immune activation in AGS Here, we establish that, contrary to expectations, RNase H2 is required for efficient LINE-1 retrotransposition. As RNase H1 overexpression partially rescues the defect in RNase H2 null cells, we propose a model in which RNase H2 degrades the LINE-1 RNA after reverse transcription, allowing retrotransposition to be completed. This also explains how LINE-1 elements can retrotranspose efficiently without their own RNase H activity. Our findings appear to be at odds with LINE-1-derived nucleic acids driving autoinflammation in AGS.
Keywords: Aicardi‐Goutières Syndrome; LINE‐1 retrotransposition; RNA:DNA hybrids; RNase H2.
© 2018 The Authors. Published under the terms of the CC BY 4.0 license.
Figures
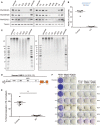
Western blot analysis shows absence of RNASEH2A and reduced RNASEH2B and C in RNASEH2A‐KO clones (KO1‐6), compared to parental cells or control clones (C1‐5). Tubulin was used as a loading control.
RNase H assay shows absence of activity against single‐embedded ribonucleotides in KO clones, with a smaller, but consistent reduction in all control clones. Activity in parental HeLa cells set at 100%. Data points represent the mean of three technical replicates for individual clones. Lines indicate the mean of six biological replicates (C1‐6 and KO1‐6) ± SEM.
High levels of genome‐embedded ribonucleotides in KO clones. Genomic DNA isolated from parental cells, KO and control clones, was RNase H2 treated and separated by alkaline gel electrophoresis. Smaller fragments indicate larger numbers of embedded ribonucleotides.
Schematic of retrotransposition vector JJ101/L1.3 (see also Fig EV1A). Within L1‐ORF2p, relative positions of EN (endonuclease), RT (reverse transcriptase) and C (cysteine‐rich) domains are indicated. Orange box with backward BLAST label depicts the retrotransposition indicator cassette mblastI.
Quantification of L1‐WT retrotransposition, normalised to the level in parental cells and normalised for transfection efficiency (TE), set to 100% for comparison. Data points represent the mean of three technical replicates for individual clones. Lines indicate the mean of six biological replicates (C1‐6 and KO1‐6) ± SEM (representative of six independent experiments). Mann–Whitney test; **P < 0.001
Representative retrotransposition assay conducted in parental cells, control clones (C1‐6) and RNASEH2A‐KO clones (KO1‐6). Cells were transfected with JJ101/L1.3‐derived vectors containing an active human LINE‐1 (WT‐hL1, element L1.3), an EN‐mutant LINE‐1 (ENm‐hL1, L1.3 D205A) or an RT‐mutant LINE‐1 (RTm‐hL1, L1.3 D702A).
- A
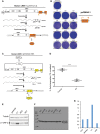
Rationale of the retrotransposition assay using mblastI tagged LINE‐1s (orange box with a backward BLAST label). Schematic of the retrotransposition vector JJ101/L1.3. Within the mblastI cassette, the orange arrow and the orange lollipop indicate the presence of a promoter and polyadenylation signal, respectively. Within L1‐ORF2p, the relative position of the EN (endonuclease), RT (reverse transcriptase) and C (cysteine‐rich) domains are indicated. SD and SA indicate splice donor and acceptor sites, respectively. Upon transcription from the CMV promoter located upstream of the L1, the L1 mRNA can be spliced by canonical cis‐splicing and undergo a round of retrotransposition, resulting in the activation of the mblastI reporter and subsequent translation of the blasticidin deaminase protein (orange oval with blue BLAST label). In the retrotransposition event shown, the black arrows indicate the presence of target site duplications (TSDs) flanking the 5′ truncated insertion.
- B
Toxicity controls: Similar numbers of blasticidin‐resistant colonies were generated for all cell lines after transfection with the pcDNA6.1 control vector (schematic). Representative results of transfection/selection experiments in parental HeLa cells, control clones (C1‐6) and KO clones (KO1‐6) are shown.
- C
Rationale and schematic of plasmid pYX014. With this plasmid, L1 retrotransposition activates Firefly luciferase expression. Briefly, an active human L1 is tagged with a luciferase retrotransposition indicator cassette (yellow box with a backward F‐luc label). Note that the backbone of the plasmid contains an expression cassette for Renilla luciferase, to normalise for transfection efficiency (big white arrow with R‐luc label). The black arrow and the black lollipop indicate the presence of a promoter and polyadenylation signal, respectively, in the F‐luc cassette. Upon transfection of plasmid pXY014 in cells, the L1 mRNA is spliced by canonical cis‐splicing and undergoes retrotransposition, resulting in the activation of the firefly luciferase reporter and subsequent translation of the F‐luciferase protein (yellow star with F‐luc label). On the other hand, the R‐luc cassette on the plasmid can be transcribed and translated into Renilla luciferase (white star with R‐luc label). In the retrotransposition event shown, the black arrows indicate the presence of TSDs flanking the 5′ truncated insertion.
- D
Results from retrotransposition assays conducted in HeLa parental cells, three control clones (C) and three RNASEH2A‐KO clones (KO). The retrotransposition level in parental cells was set at 100%. Dots represent the mean of three technical replicates for individual clones. Lines indicate the mean of three biological replicates (C2, 4 and 5, and KO2‐4) ± SEM (representative of three independent experiments). t‐test, ***P < 0.001
- E, F
Western blot analysis of L1‐ORF1p expression (in triplicate) in parental HeLa cells, a control clone (C1) and two KO clonal lines (KO1 and KO2), shows no indirect effect of RNase H2 deficiency on L1 expression. Tubulin (E) or β‐actin (F) was used as a loading control.
- G
Quantification of Western blot from panel (C) using a LI‐COR device following manufacturer's instructions.

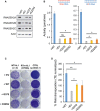
Western blot analysis shows absence of RNASEH2A and reduced RNASEH2B and C in RNASEH2A‐KO clones (KO1, KO2), compared to parental cells or a control clone (C1). Vinculin was used as a loading control.
RNase H assay shows absence of activity against single‐embedded ribonucleotides in KO clones, compared to control cells. Activity in parental U2OS cells set at 100%. Mean ± SD for two independent experiments.
High levels of genome‐embedded ribonucleotides in U2OS RNASEH2‐KO clones. Genomic DNA was isolated from parental cells, KO and control clones, RNase H2 treated and separated by alkaline gel electrophoresis. Smaller fragments indicate more genome‐embedded ribonucleotides.
Schematic of plasmid JJ101/L1.3 and representative retrotransposition and toxicity assays conducted in parental U2OS cells, a control clone (C1), and two RNASEH2A‐KO clones (KO1 and KO2). Cells were transfected with vectors containing an active human LINE‐1 (WT‐hL1, element L1.3), an RT‐mutant (RTm‐hL1, L1.3 D702A), or a toxicity control vector (CTRL, pcDNA6.1). Quantification of L1‐WT retrotransposition, with the level in parental cells set to 100% for comparison. Plotted, mean ± SD for three technical replicates. Numbers indicate the average ± SD of n = 2 controls (parental, C1) and n = 2 (KO1, KO2) (representative of three independent experiments).

Schematic of retrotransposition vectors Zfl2‐2mneoI and JM101/L1.3. The relative position of the EN domain (endonuclease), RT domain (reverse transcriptase) and C domain (cysteine‐rich), if present, is indicated. The purple box with a backward NEO label depicts the retrotransposition indicator cassette mneoI.
Representative retrotransposition assays conducted in parental cells, control (C2) and RNASEH2A‐KO (KO2) clones. Cells were transfected with vectors containing an active human LINE‐1 (WT‐hL1, element L1.3), an RT‐mutant human LINE‐1 (RTm‐hL1, L1.3 D702A), or an active zebrafish LINE‐2 (WT‐zL2, element Zfl2‐2).
Quantification of WT‐hL1 (circles) and WT‐zL2 (squares) retrotransposition in HeLa cells, normalised to the level in parental cells (set at 100%). Data points represent the mean of three technical replicates for individual clones. Lines indicate the mean of five biological replicates (C2‐6 and KO2‐6) ± SEM (representative of three independent experiments). For WT‐hL1, in control lines (n = 5) retrotransposition levels averaged 83 ± 2.5%; in null lines (n = 5) retrotransposition levels averaged 7 ± 2.3%. Mann–Whitney test; **P < 0.001.
Left, schematic of a neoTNF tagged MusD LTR‐retrotransposon. The relative position of the gag, pro and pol genes is indicated. The purple box with a backward NEO label depicts the retrotransposition indicator cassette neoTNF. Right, quantification of MusD retrotransposition, normalised to the level in parental cells (set at 100%). Data points represent the mean of three technical replicates for individual clones. Lines indicate the mean of six biological replicates (C1‐6 and KO1‐6) ± SEM (representative of three independent experiments). t‐test; ns, P > 0.05.
Left, schematic of the two plasmids used in Sleeping Beauty transposition assays. The purple box with a NEO label depicts the neo expression cassette, flanked by Terminal Inverted Repeats (TIR). Underneath, a representative result is shown for DNA‐transposition assays (pT2neo + SB100x) or controls (only pT2neo). Right, quantification of the SB transposition results (pT2neo + SB100x samples), with the level in parental cells set at 100% for comparison. Mean ± SD for n = 3 technical replicates (representative of three independent experiments).
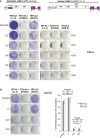
Schematic of retrotransposition vectors Zfl2‐2mneoI (zebrafish LINE‐2) and JM101/L1.3 (Human L1.3). The relative position of the EN domain (endonuclease), RT domain (reverse transcriptase) and C domain (cysteine‐rich), if present, is indicated. The purple box with a backward NEO label depicts the retrotransposition indicator cassette mneoI. Underneath, representative retrotransposition assays conducted in HeLa parental cells, control (C2‐6) and RNASEH2A‐KO (KO2‐6) clones (used for quantifications in Figure 3C). Cells were transfected with an active human LINE‐1 (WT‐hL1, element L1.3), an RT‐mutant human LINE‐1 (RTm‐hL1, D702A) or an active zebrafish LINE‐2 (WT‐zL2, element Zfl2‐2) vector.
Representative retrotransposition and toxicity assays conducted in parental U2OS cells, a control clone (C1) and two RNASEH2A‐KO clones (KO1 and KO2). Cells were transfected with an active human LINE‐1 (WT‐hL1, element L1.3), an RT‐mutant human LINE‐1 (RTm‐hL1, D702A) or an active zebrafish LINE‐2 (WT‐zL2, element Zfl2‐2) vector. Right, quantification of WT‐hL1 (dark grey bars) and WT‐zL2 (light grey bars) retrotransposition in U2OS cells, with retrotransposition in parental cells for both elements set at 100% for comparison. Mean ± SD for n = 3 technical replicates (representative of three independent experiments).
- A, B
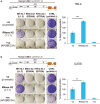
Panels (A) (HeLa cells) and (B) (U2OS cells) follow the same nomenclature. Shown is a representative result for retrotransposition and toxicity assays, underneath a schematic of the retrotransposition vector JJ101/L1.3 used. Cells were transfected with JJ101/L1.3‐based vectors [as indicated: WT‐hL1 (L1.3), active human LINE‐1; ENm‐hL1 (D205A), EN‐mutant; RTm‐hL1 (D702A), RT‐mutant] or the toxicity control vector (CTRL, pcDNA 6.1), alongside an expression vector for β‐arrestin as a negative control (−ve), the three RNase H2 subunits (RNase H2, at a 1:1:1 ratio), or a plasmid expressing APOBEC3A as a positive control (+ve) known to restrict LINE‐1 retrotransposition. Right panel, quantification of this retrotransposition assay; with the level in cells co‐transfected with β‐arrestin set at 100% for comparison. Values were normalised for transfection efficiency and toxicity. Mean ± SD for n = 3 technical replicates (representative of four independent experiments). Unpaired two‐sided t‐test; **P < 0.01; ***P < 0.001.
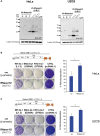
- A
Anti‐V5 Western blots using lysates of HeLa (left) or U2OS (right) cells transfected with the indicated plasmids. Cells were transfected with individual plasmids expressing single RNase H2 subunits or co‐transfected with plasmids expressing all three subunits using two different ratios (1:1:1 or 14:7:1). β‐Actin was used as loading control. Asterisks indicate the presence of individual subunits. UTF, untransfected.
- B, C
Schematic of the retrotransposition vector JJ101/L1.3. Underneath, representative results from retrotransposition and toxicity assays conducted in HeLa (B) or U2OS (C) cells. Cells were transfected with vector JJ101/L1.3 or with the toxicity control vector (CTRL, pcDNA6.1) alongside an expression vector for β‐arrestin (used as a negative control, −ve) or for each of the three RNase H2 subunits at the indicated ratio (RNase H2 14:7:1). Labels indicate if cells were transfected with an active human LINE‐1 (WT‐hL1, element L1.3), an EN‐mutant LINE‐1 (ENm‐hL1, D205A), an RT‐mutant LINE‐1 (RTm‐hL1, D702A), or with the toxicity control plasmid (CTRL, pcDNA6.1). Right panels, L1‐WT retrotransposition quantifications, with the retrotransposition level in cells co‐transfected with β‐arrestin (−ve) set at 100% for comparison. Values were normalised for transfection efficiency and toxicity. Mean ± SD for n = 3 technical replicates (representative of four independent experiments). Unpaired two‐sided t‐test; *P < 0.05.
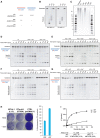
- A
Schematic of substrates used in RNase H activity assays. These assays either use an 18‐bp RNA:DNA hybrid (left), or a short dsDNA containing a single‐embedded ribonucleotide (DRD:DNA). RNASEH2A‐WT can cleave both with high efficiency (++++), whereas RNASEH2A‐CD (with D34A and D169A mutations) cannot cleave either (−). The separation of function mutant (SoF, with P40D and Y210A mutations) retains some activity against RNA:DNA heteroduplexes (++), but has virtually no activity against single‐embedded ribonucleotides (−).
- B
RNase H2 SoF has reduced activity against RNA:DNA heteroduplexes and does not fully process the hybrid, even at high concentration and/or long incubation times. RNase H activity was measured using the 18‐bp RNA:DNA substrate, separating products by denaturing PAGE after cleavage with RNase H2. WT, SoF and CD RNase H2 were used at 0.25 nM for 4 h (left) or 2.0 nM for 2 h (right). Note the different pattern of products generated for SoF and WT.
- C
As expected, the high levels of genome‐embedded ribonucleotides in RNASEH2A‐KO cells are rescued only by complementation with wild‐type RNASEH2A (+WT), not by SoF RNASEH2A (+SoF), CD RNASEH2A‐A (+CD) or the empty vector (+EV). Genomic DNA was isolated from parental cells, a control clone (C1) and the four complemented cell lines (+EV, +WT, +SoF and +CD), RNase H2 treated and separated by alkaline gel electrophoresis. Smaller fragments indicate larger numbers of embedded ribonucleotides.
- D–G
Representative gels (used for quantifications in Figure 5F and G) with results from RNase H activity against single‐embedded ribonucleotides (D and E) and activity against RNA:DNA heteroduplexes (F and G) assays conducted with lysates from the indicated cell lines. Because RNase H1 is expressed in all of these cells, activity measured against RNA:DNA heteroduplex substrate in RNASEH2A‐KO cell lysates is not completely absent. In addition, other nucleases present in the cell lysate act (non‐specifically) on the substrate, causing further background activity on both substrates.
- H
Wild‐type RNASEH2A rescues the LINE‐1 retrotransposition defect in RNASEH2A‐KO2 cells. Representative retrotransposition and toxicity assays conducted in RNASEH2A‐KO2 cells and RNASEH2A‐KO2 complemented with wild‐type RNASEH2A (+WT). Cells were transfected with an active human LINE‐1 (WT‐hL1, element L1.3), an RT‐mutant LINE‐1 (RTm‐hL1, D702A), or a toxicity control plasmid (CTRL, pcDNA6.1). Right panel, quantification of L1‐WT retrotransposition. For comparison, the retrotransposition level in KO2 cells was set at 100%. Mean ± SD for n = 3 technical replicates (representative of three independent experiments).
- I
RNase H2 SoF has reduced RNA:DNA heteroduplex substrate affinity. Initial substrate conversion rates (Vi) by 0.1 nM recombinant RNase H2 were measured at different 18‐mer RNA:DNA substrate concentrations. Mean ± SEM for n = 3 independent experiments. Km and kcat ± SEM were calculated in GraphPad Prism 5.04, using non‐linear regression. Change for SoF compared to WT indicated between brackets.
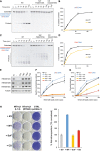
- A, B
RNase H activity assays against single‐embedded ribonucleotides using recombinant purified proteins (WT‐RNase H2 and SoF‐RNase H2). Note that only WT‐RNase H2 shows activity in this assay. Plotted, mean ± SEM for three independent experiments.
- C, D
RNase H activity assays against RNA:DNA heteroduplexes using recombinant purified proteins (WT‐RNase H2 and SoF‐RNase H2). Note that the pattern of products generated by SoF‐RNase H2 is different from the wild‐type pattern. Plotted, mean ± SEM for three independent experiments.
- E
Western blot analysis of RNase H2 expression in RNASEH2A‐KO HeLa cells complemented with the indicated retroviral vector (EV, empty vector; WT, wild‐type RNASEH2A; SoF, RNASEH2A‐P40D/Y210A; CD, RNASEH2A‐D34A/D169A, see main text for details). Tubulin was used as a loading control.
- F
RNase H activity against single‐embedded ribonucleotides in RNASEH2A‐KO cells is only rescued by wild‐type RNASEH2A (KO1 + WT). DRD:DNA heteroduplex (18 bp; ribonucleotide‐containing strand 3′‐labelled) was incubated with increasing amounts of whole‐cell lysate from the indicated cell line and separated by denaturing PAGE. The graph shows mean values ± SEM for three independent experiments.
- G
RNase H activity against RNA:DNA heteroduplexes in RNASEH2A‐KO cells is rescued by wild‐type (KO1 + WT), not by CD RNASEH2A (KO1 + CD) or the empty vector (KO1 + EV). Note reduced activity and the difference in cleavage pattern produced by SoF RNASEH2A (KO1 + SoF). RNA:DNA heteroduplex (18 bp; RNA strand 3′‐labelled) was incubated with increasing amounts of whole‐cell lysate from the indicated cell line and separated by denaturing PAGE. Plotted, mean ± SEM for three independent experiments.
- H
Only wild‐type RNASEH2A rescues the LINE‐1 retrotransposition defect in RNASEH2A‐KO cells. Left, representative retrotransposition and toxicity assays conducted in the four complemented lines. Cells were transfected with vectors containing an active human LINE‐1 (WT‐hL1, L1.3), an RT‐mutant LINE‐1 (RTm‐hL1, D702A) or a toxicity control plasmid (CTRL, pcDNA 6.1). Right, quantification of L1‐WT retrotransposition. For comparison, the retrotransposition level in KO1 cells complemented with the empty vector (EV) was set at 100%. Mean ± SD for n = 3 technical replicates (representative of six independent experiments).
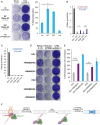
- A
Increased L1 retrotransposition upon RNase H2 SoF overexpression. Left, representative retrotransposition and toxicity assays. HeLa cells were transfected with vectors containing an active LINE‐1 (WT‐hL1, L1.3), alongside an expression vector for β‐arrestin as a negative control (−ve), the three RNase H2 subunits (RNase H2, at a 1:1:1 ratio; with RNASEH2A‐WT or SoF) or a plasmid expressing APOBEC3A, known to restrict LINE‐1 retrotransposition, as a positive control (+ve). Right panel, quantification of this retrotransposition assay, with the level in cells co‐transfected with β‐arrestin set at 100% for comparison. Values were normalised for transfection efficiency and toxicity. Mean ± SD for n = 2 technical replicates (representative of three independent experiments). Unpaired two‐sided t‐test; *P < 0.05.
- B
RNase H activity against RNA:DNA heteroduplexes in RNASEH2A‐KO cells (clones KO1 and KO2) is partially rescued by overexpression of human nuclear RNase H1 (KO1 + H1 and KO2 + H1 vs. KO1 + EV and KO2 + EV). RNA:DNA heteroduplex (18 bp; RNA strand 3′‐labelled) was incubated with whole‐cell lysate and speed of cleavage determined using a FRET‐based assay. Mean values ± SEM for n = 6 independent experiments.
- C
RNase H activity against single‐embedded ribonucleotides in RNASEH2A‐KO cells (clones KO1 and KO2) is not rescued by human RNase H1 (KO1 + H1 and KO2 + H1 vs. KO1 + EV and KO2 + EV). Speed of cleavage of an 18‐bp substrate was determined using a FRET‐based assay. Mean values ± SEM for n = 3 independent experiments.
- D, E
Representative retrotransposition and toxicity assays (D) conducted in the RNASEH2‐KO clones (KO1 and KO2) complemented with RNASEH2A‐WT (+RNASEH2A) or with human RNase H1 (+RNASEH1). Cells were transfected with vectors containing an active LINE‐1 (WT‐hL1, L1.3), an RT‐mutant LINE‐1 (RTm‐hL1, D702A), or a toxicity control plasmid (CTRL, pcDNA6.1). Quantification of L1‐WT retrotransposition (E). For comparison, the retrotransposition level in KO1 or KO2 cells was set at 100%. Mean ± SD for n = 3 technical replicates (representative of three independent experiments). Unpaired two‐sided t‐test; **P < 0.01; ***P < 0.001
- F
Proposed model for TPRT. Degradation of LINE‐1 RNA in the RNA:cDNA hybrid by cellular RNase H2 allows completion of LINE‐1 insertion.

- A, B
RNase H activity assays (against 18‐mer RNA:DNA heteroduplex) using the indicated recombinant purified proteins. Wild type or mutant recombinant RNase H2 (RNASEH2A‐P40D/Y210A, RNASEH2A‐G37S, RNASEH2A‐E225G, RNASEH2B‐A177T and RNASEH2C‐R69W) was tested using the indicated protein concentration. As previously shown (Reijns et al, 2011), the A177T mutation had limited impact on enzyme activity, whereas the G37S, E225G and R69W mutations all caused a substantial reduction in RNase H2 activity. Note that only RNase H2‐SoF (RNASEH2A‐P40D/Y210A) generates an altered cleavage pattern. Shown are representative results from three independent experiments.
- A
Western blot analysis of RNase H2 expression in RNASEH2A‐KO HeLa cells (KO2) complemented with the indicated retroviral vector (EV, empty vector; WT, wild‐type RNASEH2A; RNASEH2A‐G37S; RNASEH2A‐E225G). Actin was used as a loading control.
- B
Complementation of RNASEH2A‐KO cells with RNASEH2A with AGS mutations (G37S and E225G) leads to a small but significant increase in RNase H activity. Mean values ± SEM for n = 3 independent experiments. Unpaired two‐sided t‐test; *P < 0.05; ns, P > 0.05.
- C, D
Cells expressing AGS mutant RNase H2 fail to support efficient L1 retrotransposition. (C) Representative retrotransposition and toxicity assays conducted in the four complemented lines. Cells were transfected with vectors containing an active human LINE‐1 (WT‐hL1, L1.3), an RT‐mutant LINE‐1 (RTm‐hL1, D702A) or a toxicity control plasmid (CTRL, pcDNA 6.1). (D) Quantification of L1‐WT retrotransposition in the complemented lines. For comparison, the retrotransposition level in KO cells complemented with empty vector (EV) was set at 100%. Mean ± SD for n = 3 independent experiments (each experiment performed in technical duplicates). Unpaired two‐sided t‐test; *P < 0.05; **P < 0.01.
References
-
- Bartsch K, Knittler K, Borowski C, Rudnik S, Damme M, Aden K, Spehlmann ME, Frey N, Saftig P, Chalaris A, Rabe B (2017) Absence of RNase H2 triggers generation of immunogenic micronuclei removed by autophagy. Hum Mol Genet 26: 3960–3972 - PubMed
Publication types
MeSH terms
Substances
Supplementary concepts
Grants and funding
LinkOut - more resources
Full Text Sources
Other Literature Sources
Medical
Research Materials
Miscellaneous

