. 2018 Aug 8;38(32):7058-7071.
doi: 10.1523/JNEUROSCI.0366-18.2018. Epub 2018 Jun 29.

Regional Distribution of CNS Antigens Differentially Determines T-Cell Mediated Neuroinflammation in a CX3CR1-Dependent Manner

Affiliations

Regional Distribution of CNS Antigens Differentially Determines T-Cell Mediated Neuroinflammation in a CX3CR1-Dependent Manner

Aditya Rayasam et al. J Neurosci. .

Abstract

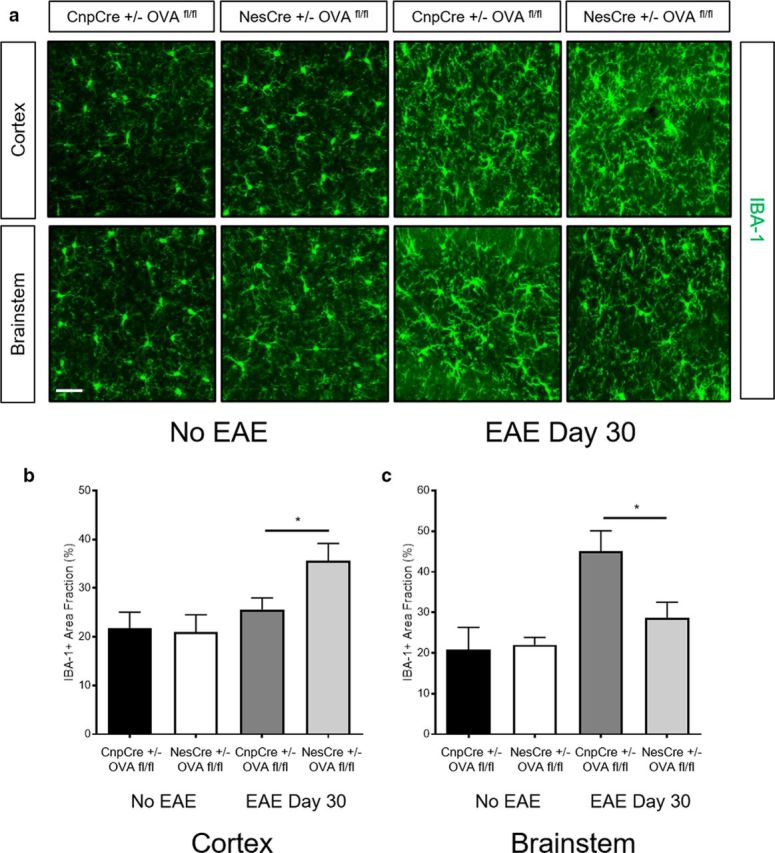
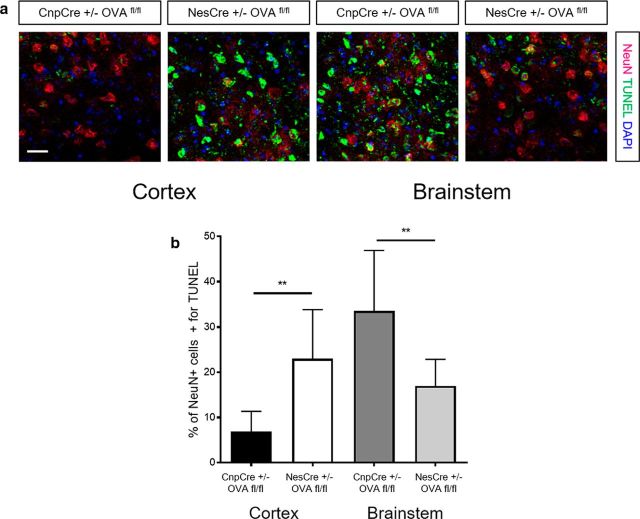
T cells continuously sample CNS-derived antigens in the periphery, yet it is unknown how they sample and respond to CNS antigens derived from distinct brain areas. We expressed ovalbumin (OVA) neoepitopes in regionally distinct CNS areas (Cnp-OVA and Nes-OVA mice) to test peripheral antigen sampling by OVA-specific T cells under homeostatic and neuroinflammatory conditions. We show that antigen sampling in the periphery is independent of regional origin of CNS antigens in both male and female mice. However, experimental autoimmune encephalomyelitis (EAE) is differentially influenced in Cnp-OVA and Nes-OVA female mice. Although there is the same frequency of CD45high CD11b+ CD11c+ CX3CL1+ myeloid cell-T-cell clusters in neoepitope-expressing areas, EAE is inhibited in Nes-OVA female mice and accelerated in CNP-OVA female mice. Accumulation of OVA-specific T cells and their immunomodulatory effects on EAE are CX3C chemokine receptor 1 (CX3CR1) dependent. These data show that despite similar levels of peripheral antigen sampling, CNS antigen-specific T cells differentially influence neuroinflammatory disease depending on the location of cognate antigens and the presence of CX3CL1/CX3CR1 signaling.SIGNIFICANCE STATEMENT Our data show that peripheral T cells similarly recognize neoepitopes independent of their origin within the CNS under homeostatic conditions. Contrastingly, during ongoing autoimmune neuroinflammation, neoepitope-specific T cells differentially influence clinical score and pathology based on the CNS regional location of the neoepitopes in a CX3CR1-dependent manner. Altogether, we propose a novel mechanism for how T cells respond to regionally distinct CNS derived antigens and contribute to CNS autoimmune pathology.

Keywords: CNS; T cells; autoimmunity; neuroinflammation.


Figures

Figure 1.
Figure 1.
GFP expression of CNPase and nestin-derived antigens in the CNS. a, Representative image of brain section from brainstem stained with CNPase (left), GFP (center), and merged (right) in CnpCre+/− OVAfl/fl mice. Scale bar, 10 μm. White arrows depict colocalization of cell-specific markers with GFP tagged neoepitope expression. b, Representative image of brain section from cortex stained with NeuN (left), GFP (center), and merged (right) in NesCre+/− OVAfl/fl mice. Scale bar, 10 μm. White arrows depict colocalization of cell-specific markers with GFP tagged neoepitope expression. c, Representative image of brain section stained with GFAP (left), GFP (center), and merged (right) in NesCre+/− OVAfl/fl mice. Scale bar, 10 μm. White arrows depict colocalization of cell-specific markers with GFP tagged neoepitope expression. d, Quantification of regional GFP expression by measure of area fraction in different CNS areas of CnpCre+/− OVAfl/fl and NesCre+/− OVAfl/fl mice (n = 5; 2 independent experiments). Data represent mean ± SEM. *p < 0.05. Mann–Whitney U test (d).
Figure 2.
Figure 2.
Systemic antigen sampling by T cells of CNPase and nestin-derived antigens is similar under homeostatic conditions. a, Experimental design to test systemic T-cell proliferation in response to CNS-derived OVA antigens. Mice received 106 epitope-specific T cells intravenously. FACS staining was performed on CLN-derived lymphocytes 5 d post-transfer. b, Histograms show representative CellTrace Violet dilution of CD8+Thy1.1+ cells (top) and CD4+Thy1.1+ cells (bottom) from CLNs of each genotype of mice. c, Quantification of mean number of CellTrace Violet low/int CD8+/Thy1.1+ cells from CLNs of each mouse. d, Quantification of mean number of CellTrace Violet low/int CD4+/Thy1.1+ cells from CLNs of each mouse (n = 6; 3 independent experiments). Data represent mean ± SEM. *p < 0.05. Mann–Whitney U test (c, d).
Figure 3.
Figure 3.
Antigen-specific T cells differentially affect EAE in CNPase and nestin-derived neoepitope-expressing transgenic mice. a, Experimental design to test the influence of secondary antigen-specific T cells on ongoing EAE. EAE was induced at day 0 in CnpCre+/− OVAfl/fl, CnpCre+/− OVA−/−, NesCre+/− OVAfl/fl and NesCre+/− OVA−/− mice. OVA peptide-specific OT-I Thy1.1 and OT-II Thy1.1 T cells were transferred intravenously at onset of disease (EAE days 7–10). EAE scores were monitored and mice were sacrificed at EAE day 30. b, Clinical score data in mice from day 0 to day 30 EAE (left) and average clinical scores for each mouse at terminal time point (right; n = 17, 11 mice, 6 independent experiments). c, Representative images of spinal cord in mice with No EAE and at EAE day 30 stained with FluoroMyelin-PE. White line depicts area of demyelination. Scale bar, 50 μm. The green box indicates the regions where image was magnified. d, Quantification of normalized demyelination in thoracic spinal cord of mice at EAE day 30 (n = 6 mice, 3 independent experiments). Data represent mean ± SEM. **p < 0.01, ****p < 0.0001 [linear regression (b, left, EAE plot), Mann–Whitney U test (b, right, d)].
Figure 4.
Figure 4.
Antigen-specific T cells differentially steer the localization of immune responses in the CNS of Nestin and CNPase neoepitope-expressing mice during EAE. a, Quantification of CD4 T cells (left) per 10 μm2 different brain regions and spinal cord at EAE day 30. Quantification of CD8 T cells (right) per 10 μm2 different brain regions and spinal cord at EAE day 30 (n = 5, 2 independent experiments). b, Representative images of hippocampus (top) and brainstem (bottom) sections stained with CD4 (red), CD8 (green), and DAPI (blue) in CnpCre+/− OVAfl/fl and NesCre+/− OVAfl/fl mice at EAE day 30. Scale bar, 80 μm. White “*” depicts CD8 T cells and white “#” depicts CD4 T cells. Data represent mean ± SEM. *p < 0.05, **p < 0.01. Mann–Whitney U test (a).
Figure 5.
Figure 5.
Antigen-specific T cells form clusters with CD11b+ CD11c+ myeloid cells in distinct CNS regions during EAE. a, Representative gating of CD45high CD11b+ CD11c+ myeloid cells from mice. Infiltrating myeloid cells are gated as CD45high CD11b+ CD11c+. Gating of CD11c+ cells based on IgG1 isotype control as stated in the Materials and Methods. b, Quantification of CD45high CD11b+CD11c+ cells per gram tissue in whole brain at EAE day 30 (n = 6, 2 independent experiments). c, Representative images of myeloid cell–T-cell clusters in brainstem of CnpCre+/− OVAfl/fl mice at EAE day 30. Scale bar, 20 μm (CD4 = red, CD11c = green, DAPI = blue). White arrows depict the localization of the clusters. d, Quantification of CD3/CD11c+ clusters in different brain areas and spinal cord at EAE day 30 in CnpCre+/− OVAfl/fl and CnpCre+/− OVA−/− mice (n = 5, 2 independent experiments). e, Quantification of CD3/CD11c+ clusters in different brain areas and spinal cord at EAE day 30 in NesCre+/− OVAfl/fl and NesCre+/− OVA−/− mice (n = 5, 2 independent experiments). Data represent mean ± SEM. *p < 0.05, **p < 0.01. Mann–Whitney U test (b, d, e).
Figure 6.
Figure 6.
CX3CR1 expression on antigen-specific T cells drives their localization to-specific regions in the CNS and influences EAE outcome. a, High-magnification representative image stained with CX3CL1 (first panel), CD11c (second panel), IBA-1 (third panel), and merged (fourth panel) of brainstem in CnpCre+/− OVAfl/fl mice and cortex in NesCre+/− OVAfl/fl mice at EAE day 30. Scale bar, 5 μm. White arrows depict CD11c+ CX3CL1-expressing cells. b, Quantification of percentage of CD45high CD11b+ CD11c+ that are CX3CL1+ in the whole brain of mice at EAE day 30 (n = 6, 2 independent experiments). c, Experimental design to test the influence of secondary antigen-specific T cells deficient in CX3CR1 on ongoing EAE. EAE was induced at day 0 in CnpCre+/− OVAfl/fl, CnpCre+/− OVA−/−, NesCre+/− OVAfl/fl, and NesCre+/− OVA−/−. CX3CR1 deficient OVA peptide-specific OT-I Thy1.1 and OT-II Thy1.1 T cells were transferred intravenously at onset of disease (EAE days 7–10). EAE scores were monitored and mice were sacrificed at EAE day 30. d, Representative gating of CX3CR1+ Thy1.1+ single-positive, double-positive, and double-negative cells from cells gated on combined single-positive CD4 and CD8 T cells from brainstem and cerebellum (top row) and hippocampus and cortex (bottom row). e, Quantification of absolute number of CX3CR1+ Thy1.1+ cells per gram tissue in brainstem and cerebellum (left) and quantification of absolute number of CX3CR1+ Thy1.1+ cells per gram tissue in hippocampus and cortex (right; n = 6, 2 independent experiments). f, EAE clinical score data in mice from day 0 to day 30 Data are pooled from two independent experiments (n = 8) EAE was induced at day 0 in CnpCre+/− OVAfl/fl, CnpCre+/− OVA−/−, NesCre+/− OVAfl/fl and NesCre+/− OVA−/−. CX3CR1 deficient OVA peptide-specific OT-I Thy1.1 and OT-II Thy1.1 T cells were transferred intravenously at onset of disease (EAE days 7–10). EAE scores were monitored and mice were killed at EAE day 30. Data represent mean ± SEM. *p < 0.05, ****p < 0.0001 [linear regression (f, EAE plot), Mann–Whitney U test (b, e)].
Figure 7.
Figure 7.
Antigen-specific T cells differentially affect myeloid cell morphology and distribution in CNPase and nestin-derived neoepitope-expressing transgenic mice during EAE. a, Representative images of cortex (top) and brainstem (bottom) sections stained with IBA-1 of naive CnpCre+/− OVAfl/fl and NesCre+/− OVAfl/fl mice as well as CnpCre+/− OVAfl/fl and NesCre+/− OVAfl/fl mice at EAE day 30. Scale bar, 10 μm. b, Quantification of IBA-1+ cells by measure of area fraction in the cortex of naive CnpCre+/− OVAfl/fl and NesCre+/− OVAfl/fl mice as well as CnpCre+/− OVAfl/fl and NesCre+/− OVAfl/fl mice at EAE day 30 (n = 6, 2 independent experiments). c, Quantification of IBA-1+ cells by measure of area fraction in the brainstem of naive CnpCre+/− OVAfl/fl and NesCre+/− OVAfl/fl mice as well as CnpCre+/− OVAfl/fl and NesCre+/− OVAfl/fl mice at EAE day 30 (n = 6, 2 independent experiments). Data represent mean ± SEM. *p < 0.05. Mann–Whitney U test (b, c).
Figure 8.
Figure 8.
Antigen-specific T cells differentially influence TUNEL expression on neurons in CNPase and nestin-derived neoepitope-expressing transgenic mice during EAE. a, Representative images of cortex and brainstem sections stained with NeuN (red), TUNEL (green), and DAPI (blue) of CnpCre+/− OVAfl/fl and NesCre+/− OVAfl/fl mice at EAE day 30. Scale bar, 10 μm. b, Quantification of the percentage NeuN+ cells also positive for TUNEL in the cortex and brainstem of CnpCre+/− OVAfl/fl and NesCre+/− OVAfl/fl mice at EAE day 30 (n = 5). Data represent mean ± SEM. **p < 0.01. Mann–Whitney U test (b).

References

    1. Anandasabapathy N, Victora GD, Meredith M, Feder R, Dong B, Kluger C, Yao K, Dustin ML, Nussenzweig MC, Steinman RM, Liu K (2011) Flt3L controls the development of radiosensitive dendritic cells in the meninges and choroid plexus of the steady-state mouse brain. J Exp Med 208:1695–1705. 10.1084/jem.20102657 - DOI - PMC - PubMed
    1. Bonfiglio T, Olivero G, Merega E, Di Prisco S, Padolecchia C, Grilli M, Milanese M, Di Cesare Mannelli L, Ghelardini C, Bonanno G, Marchi M, Pittaluga A (2017) Prophylactic versus therapeutic fingolimod: restoration of presynaptic defects in mice suffering from experimental autoimmune encephalomyelitis. PLoS One 12:e0170825. 10.1371/journal.pone.0170825 - DOI - PMC - PubMed
    1. Böttcher JP, Beyer M, Meissner F, Abdullah Z, Sander J, Höchst B, Eickhoff S, Rieckmann JC, Russo C, Bauer T, Flecken T, Giesen D, Engel D, Jung S, Busch DH, Protzer U, Thimme R, Mann M, Kurts C, Schultze JL, et al. (2015) Functional classification of memory CD8(+) T cells by CX3CR1 expression. Nat Commun 6:8306. 10.1038/ncomms9306 - DOI - PMC - PubMed
    1. Cao Y, Toben C, Na SY, Stark K, Nitschke L, Peterson A, Gold R, Schimpl A, Hünig T (2006) Induction of experimental autoimmune encephalomyelitis in transgenic mice expressing ovalbumin in oligodendrocytes. Eur J Immunol 36:207–215. 10.1002/eji.200535211 - DOI - PubMed
    1. Casanova E, Fehsenfeld S, Mantamadiotis T, Lemberger T, Greiner E, Stewart AF, Schütz G (2001) A CaMKIIalpha iCre BAC allows brain-specific gene inactivation. Genesis 31:37–42. 10.1002/gene.1078 - DOI - PubMed

Publication types

MeSH terms

LinkOut - more resources