Randomized Controlled Trial
. 2018 Jul 31;91(5):e463-e471.
doi: 10.1212/WNL.0000000000005903. Epub 2018 Jun 29.

Effects of deep brain stimulation on rest tremor progression in early stage Parkinson disease

Affiliations
Randomized Controlled Trial

Effects of deep brain stimulation on rest tremor progression in early stage Parkinson disease

Mallory L Hacker et al. Neurology. .

Abstract

Objective: To evaluate whether the progression of individual motor features was influenced by early deep brain stimulation (DBS), a post hoc analysis of Unified Parkinson's Disease Rating Scale-III (UPDRS-III) score (after a 7-day washout) was conducted from the 2-year DBS in early Parkinson disease (PD) pilot trial dataset.

Methods: The prospective pilot trial enrolled patients with PD aged 50-75 years, treated with PD medications for 6 months-4 years, and no history of dyskinesia or other motor fluctuations, who were randomized to receive optimal drug therapy (ODT) or DBS plus ODT (DBS + ODT). At baseline and 6, 12, 18, and 24 months, all patients stopped all PD therapy for 1 week (medication and stimulation, if applicable). UPDRS-III "off" item scores were compared between the ODT and DBS + ODT groups (n = 28); items with significant between-group differences were analyzed further.

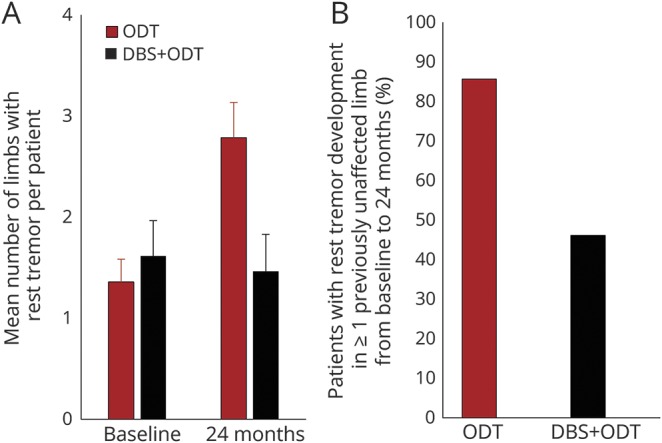
Results: UPDRS-III "off" rest tremor score change from baseline to 24 months was worse in patients receiving ODT vs DBS + ODT (p = 0.002). Rest tremor slopes from baseline to 24 months favored DBS + ODT both "off" and "on" therapy (p < 0.001, p = 0.003, respectively). More ODT patients developed new rest tremor in previously unaffected limbs than those receiving DBS + ODT (p = 0.001).

Conclusions: These results suggest the possibility that DBS in early PD may slow rest tremor progression. Future investigation in a larger cohort is needed, and these findings will be tested in the Food and Drug Administration-approved, phase III, pivotal, multicenter clinical trial evaluating DBS in early PD.

Classification of evidence: This study provides Class II evidence that for patients with early PD, DBS may slow the progression of rest tremor.


Figures

Figure 1
Figure 1. Unified Parkinson's Disease Rating Scale, part III (UPDRS-III) motor examination “off” item scores
Mean ± SEM UPDRS-III scores after a 7-day washout (day 8) by treatment group (n = 14, optimal drug therapy [ODT]; n = 13, deep brain stimulation [DBS] + ODT) and mean ± SEM changes in scores from baseline to 24 months. (A) UPDRS-III total score (excludes rigidity) at baseline and 24 months. (B) UPDRS-III item scores at baseline and 24 months. (C) Change in UPDRS-III total score (excludes rigidity) from baseline to 24 months. (D) Change in UPDRS-III item scores from baseline to 24 months. Δ = ODT minus DBS + ODT difference in change from baseline to 24 months; p values determined from Wilcoxon rank-sum test; *p < 0.0038 (0.05/13) was considered significant for this analysis.
Figure 2
Figure 2. Unified Parkinson's Disease Rating Scale, part III (UPDRS-III) motor examination “off” rest tremor
UPDRS-III rest tremor score after 7-day washout (day 8) by treatment group (n = 14, optimal drug therapy [ODT]; n = 13, deep brain stimulation [DBS] + ODT). (A) Mean ± SEM rest tremor “off” score at baseline and 6, 12, 18, and 24 months by treatment group, with regression lines showing the trend in score over time for each group. The p value for the DBS + ODT vs ODT difference in rest tremor “off” score trends (difference in slopes = −1.97 points/y) is determined from a 2 degrees of freedom χ2 test from analysis of covariance of the change in score from baseline, adjusting for the baseline score and within-patient correlations and was significant at the 0.01 level (p < 0.001, exchangeable correlations). Model for change in rest tremor “off” score over time: change in rest tremor “off” score = 1.93 × time (y) + 1.04 × DBS −1.97 × DBS × time (y) − 0.05 × Baseline rest tremor “off” score − 0.53. (B) Time to reach at least 2-point worsening in rest tremor score “off” therapy. The hazard ratio (HR) and 95% confidence interval (CI) were derived from a Cox regression model with treatment group as the single model variable; the p value was determined by the log-rank test.
Figure 3
Figure 3. De novo development of rest tremor
(A) Mean ± SEM number of limbs affected by rest tremor at baseline and 24 months. Difference between groups in change from baseline to 24 months, p = 0.001. p Value determined by the 2-sample t test with equal variances. (B) Proportion of patients who developed rest tremor in previously unaffected limbs from baseline to 24 months. Optimal drug therapy [ODT] n = 14, deep brain stimulation [DBS] + ODT n = 13. Odds ratio 7.0, 95% confidence interval 1.10–45.45, p = 0.046. p Value determined using the Fisher exact test was used to assess the difference between the ODT and DBS + ODT groups in the risk of de novo development of rest tremor (development vs no development). p < 0.05 was considered significant for this analysis.
Figure 4
Figure 4. Unified Parkinson's Disease Rating Scale, part III (UPDRS-III) motor examination “on” rest tremor and treatment use
(A) Mean ± SEM UPDRS-III rest tremor score “on” therapy (day 1) by treatment group (n = 13, optimal drug therapy [ODT]; n = 14, deep brain stimulation [DBS] + ODT) over time with regression lines showing the trend in score over time for each group. The p value for the DBS + ODT vs ODT difference in rest tremor “on” score trends (difference in slopes = −0.74 points/year) is determined from a 2 degrees of freedom χ2 test from analysis of covariance of the change in score from baseline, adjusting for the baseline score and within-patient correlations and was significant at the 0.01 level (p = 0.003, exchangeable correlations). Model for change in rest tremor “on” score over time: change in rest tremor “on” score = 0.58 × time (y) − 0.90 × DBS − 0.74 × DBS × time (years) − 0.34 × baseline rest tremor “on” score + 0.84. (B) Mean ± SEM levodopa equivalent daily dose (LEDD) for ODT (n = 14) and DBS + ODT (n = 14) over the 24-month study period. (C) Stimulation measures (rate 130 Hz, pulse width 60 ms). Mean ± SEM stimulation amplitude for the DBS + ODT group (n = 14). Amplitude shown as average of left and right leads. V = voltage. Amplitude range = 1.0–2.4 V.

References

    1. Deuschl G, Schade-Brittinger C, Krack P, et al. A randomized trial of deep-brain stimulation for Parkinson's disease. N Engl J Med 2006;355:896–908. - PubMed
    1. Follett KA, Weaver FM, Stern M, et al. Pallidal versus subthalamic deep-brain stimulation for Parkinson's disease. N Engl J Med 2010;362:2077–2091. - PubMed
    1. Wallace BA, Ashkan K, Heise CE, et al. Survival of midbrain dopaminergic cells after lesion or deep brain stimulation of the subthalamic nucleus in MPTP-treated monkeys. Brain 2007;130:2129–2145. - PubMed
    1. Spieles-Engemann AL, Steece-Collier K, Behbehani MM, et al. Subthalamic nucleus stimulation increases brain derived neurotrophic factor in the nigrostriatal system and primary motor cortex. J Parkinsons Dis 2011;1:123–136. - PMC - PubMed
    1. Musacchio T, Rebenstorff M, Fluri F, et al. Subthalamic nucleus deep brain stimulation is neuroprotective in the A53T α-synuclein Parkinson's disease rat model. Ann Neurol 2017;81:825–836. - PMC - PubMed

Publication types