. 2018 Jun 29;9(1):2541.
doi: 10.1038/s41467-018-04802-8.

Continuous biomarker monitoring by particle mobility sensing with single molecule resolution

Affiliations

Continuous biomarker monitoring by particle mobility sensing with single molecule resolution

Emiel W A Visser et al. Nat Commun. .

Abstract

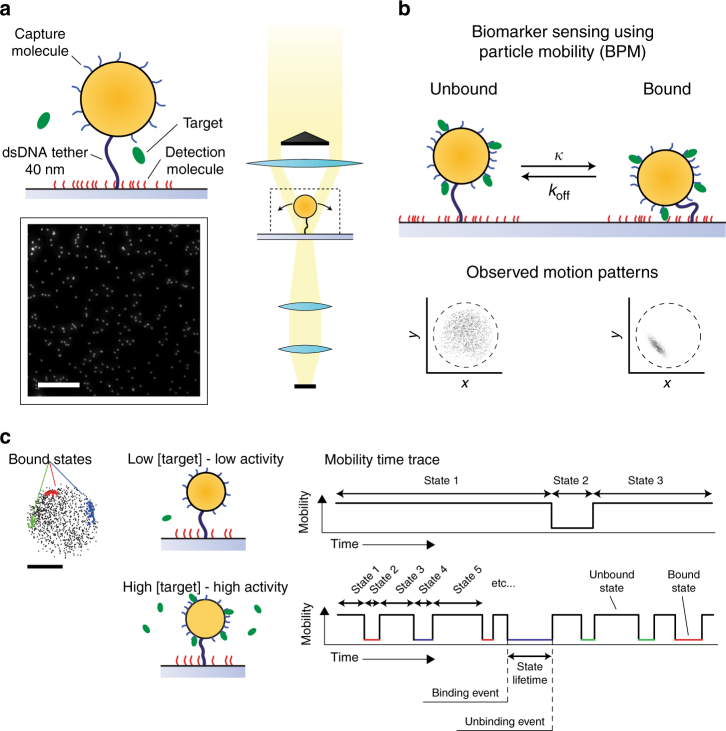
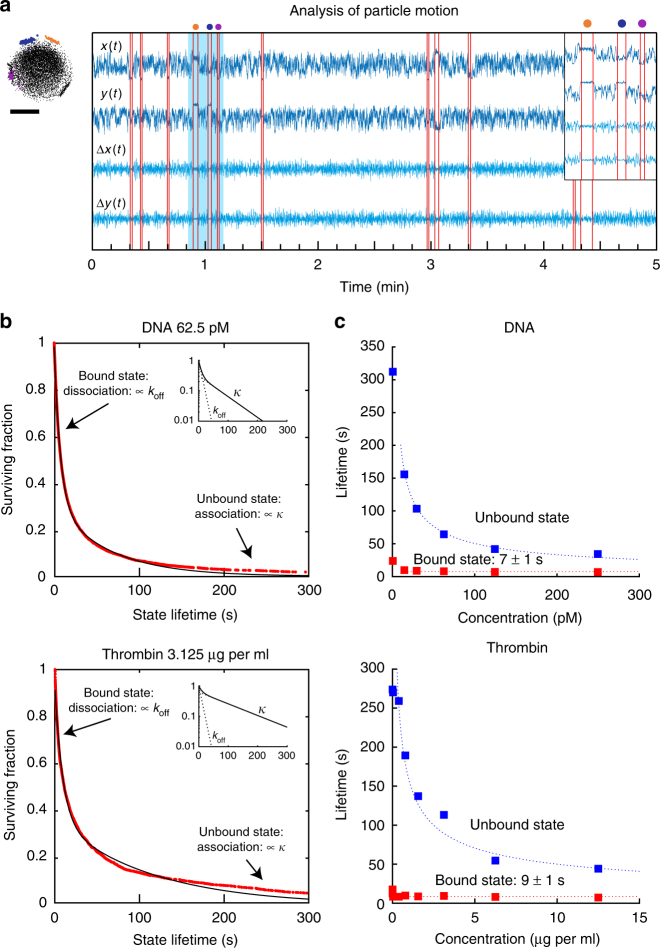
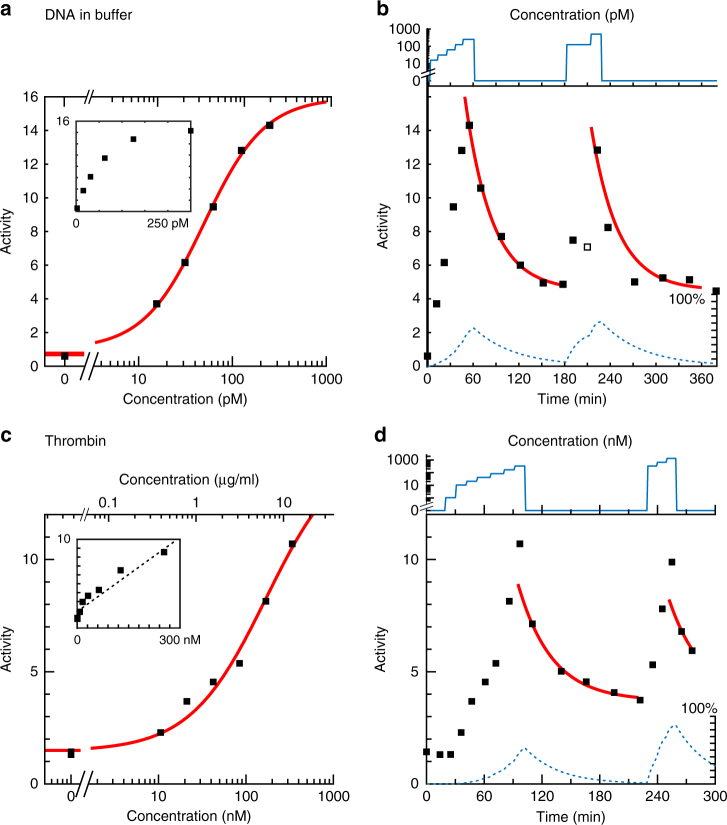
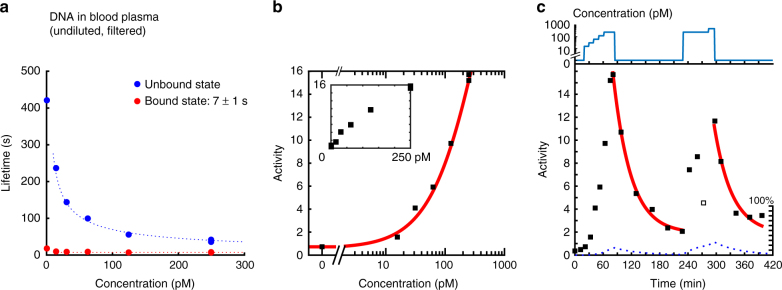
Healthcare is in demand of technologies for real-time sensing in order to continuously guard the state of patients. Here we present biomarker-monitoring based on the sensing of particle mobility, a concept wherein particles are coupled to a substrate via a flexible molecular tether, with both the particles and substrate provided with affinity molecules for effectuating specific and reversible interactions. Single-molecular binding and unbinding events modulate the Brownian particle motion and the state changes are recorded using optical scattering microscopy. The technology is demonstrated with DNA and protein as model biomarkers, in buffer and in blood plasma, showing sensitivity to picomolar and nanomolar concentrations. The sensing principle is direct and self-contained, without consuming or producing any reactants. With its basis in reversible interactions and single-molecule resolution, we envisage that the presented technology will enable biosensors for continuous biomarker monitoring with high sensitivity, specificity, and accuracy.


Conflict of interest statement

Competing interests

M.P., L.J.v.I., and E.V. are listed as inventors on patent application WO/2016/096901 “Biosensor based on a tethered particle”. The remaining authors declare no competing interests.

Publisher’s note

Springer Nature remains neutral with regard to jurisdictional claims in published maps and institutional affiliations.

Figures

Fig. 1
Fig. 1
Biomarker monitoring based on the sensing of particle mobility (BPM). a Particles (orange) are tethered to the substrate via a 40 nm dsDNA strand (black). The particles are functionalized with capture molecules (blue), which serve to capture the target molecules from solution. The substrate is functionalized with lower-affinity detection molecules (red), which create short-lived target-induced bonds between the particle and the substrate. Target molecules (green) are either 22-nucleotide ssDNA molecules or thrombin proteins. In the experiments, the high-affinity capture molecules were biotinylated and coupled to the particles by biotin–streptavidin coupling; the low-affinity detection molecules were provided with a biotin tag and coupled to the substrate by neutravidin or streptavidin (see Methods). The particles are detected using darkfield microscopy, imaging the particles as bright dots on a dark background. The scale bar represents 50 µm. b Target binding causes the particle to become intermittently bound to the substrate resulting in switching between different mobilities and motion patterns. The effective association rate of the particle to the substrate is indicated as κ, the dissociation rate is given by koff. c The mobility of the particles is analyzed as a function of time and the binding/unbinding events are digitally detected for hundreds of particles in parallel. The time between two consecutive events corresponds to the lifetime of the enclosed state. Two example mobility traces are sketched for a particle with no target molecules in solution or with a high target molecule concentration, leading to a low or a high observed switching activity. The scale bar represents 250 nm
Fig. 2
Fig. 2
Analysis of mobility time-traces in terms of state lifetimes. a The mobility of a single particle with switching activity. The optically recorded in-plane position (x, y) and the step size (Δx, Δy) are shown as a function of time. The detected times at which the motion is observed to change are indicated with vertical red lines. The timespan between two consecutive change events corresponds to a single-state lifetime of the particle. The motion pattern is shown of the particle that was analyzed. An expanded view of time traces with three bound states is shown in the inset, corresponding to the timespan marked by the light blue area in the main graph. The confined motion patterns of three bound states are indicated with colored data points. In the time trace three corresponding bound states are indicated with dots above the graph. The scale bar represents 250 nm. b State lifetime analysis for ssDNA and thrombin experiments, graphed as survival curves. States with a lifetime of 1 s or more have been analyzed. The lifetimes were determined from the analysis of the motion data during a 5-min measurement at a target concentration of 62.5 pM DNA (501 tracked particles) or 3.125 μg/mL thrombin (407 tracked particles), combining both unbound states and bound states in a single survival curve. Red curves represent data, black lines represent fits. The insets show the fit curves and the individual contributions of the time constants koff and κ; the lin-log scale highlights the double-exponential character of the decay. For DNA: τbound=7.3±0.1s and τunbound=63.8±0.4s; for thrombin: τbound=9.3±0.1s and τunbound=113±2s. c Dependence of lifetimes of the bound (red) and unbound (blue) states on the target concentration. The error related to the stochastics of the measurement is smaller than the symbol size; experimental contributions to the measurement errors are discussed in Supplementary Note 1. The dotted lines indicate the approximate trend of the characteristic lifetimes. The dotted blue lines scale with the target concentration as ~[T]-0.5 for DNA and thrombin. The dotted red lines do not depend on the concentration (see also Supplementary Notes 2 and 3)
Fig. 3
Fig. 3
Particle-switching activity as a function of target concentration and time, for monitoring ssDNA and thrombin protein, for the assays of Fig. 2. a, c Average number of detected motion changes per particle per 5 min as a function of the target concentration. The error related to the stochastics of the measurement is smaller than the symbol size; experimental contributions to the measurement errors are discussed in the Supplementary Note 1. The data is fitted by the Hill equation with a baseline offset (red line). The insets show the dose–response curves on double-linear axes. b, d Sensor reversibility is demonstrated by recording the particle activity as a function of time. The graph shows the applied target molecule concentration and the measured particle activity as a function of time. In the first section (up to 60 min in, up to 100 min in) the target molecule concentration was increased in a stepwise fashion. Thereafter the concentration was kept at zero for 120 min and subsequently pulsed from zero to a high concentration. One measurement point (open square) is considered to be an outlier as it deviates from all measurements before and after. Fits (red solid lines) represent exponential decay of the activity data using the model described by Eq. (6). The background activity is the same for both fits in the measurement series. The dotted curves illustrate the activity (on a scale from 0 to 100%) predicted by a reaction kinetics model that is described in the Supplementary Note 4
Fig. 4
Fig. 4
Monitoring of ssDNA in undiluted filtered blood plasma. a Lifetimes of the bound and unbound states as a function of the target concentration. The dotted blue line scales with the target concentration as [T]-0.6. The dotted red line does not depend on the concentration. b Activity as a function of concentration, recorded during the stepwise increase in concentration. The fit does not yield a reliable Kd value due to the absence of saturation in the curve. The inset shows the dose–response curve on double-linear axes. c Sensor reversibility is demonstrated by recording the particle activity as a function of time. The graph shows the target molecule concentration, as well as the measured particle activity as a function of time. In the first section (up to 80 min) the target molecule concentration was increased in a stepwise fashion. Thereafter the concentration was kept at zero for 150 min and subsequently pulsed from zero to a high concentration and brought back to zero again. The data point with open square is considered to be an outlier, as it deviates from measurements before and after. Fits (red solid lines) represent exponential decay curves of the activity using Eq. (6), with a time-constant τoff and background Ab that is the same for both fits in the measurement series. A time constant τoff=37±6 min was found in blood plasma. The dotted curves illustrate the activity (on a scale from 0 to 100%) predicted by the reaction kinetics model (see Supplementary Note 4)
Fig. 5
Fig. 5
Selectivity of detection of the DNA equivalent of miRNA-126, i.e. DmiRNA-126. a The target molecule with three different detection molecules. 8 bpD is a detection molecule with 8-bp perfect match to the target. 9 bpMM is a detection molecule with 8-bp perfect match and a single mismatch in the middle. 9 bpD is a detection molecule with 9-bp perfect match with the DmiRNA-126 target. Perfect match is indicated in blue and mismatch is indicated in red. b Detection of 100 pM DmiRNA-126 with 8 bpD, 9 bpMM, and 9 bpD detection molecules. The used capture molecule on the particle has 11-bp complementarity to the target. Particle switching activities were recorded before and after supply of 100 pM DmiRNA-126 target. c Particle switching activity using 9 bpD detection molecule and different target oligonucleotide sequences. Sequentially, particle-switching activities were recorded when there was no target injected, when 100 pM target with a random DNA sequence was injected, and finally when 100 pM DmiRNA-126 target was injected. Error bars are standard deviations of two independent measurements with 5 min duration

References

    1. Christensen, C. M., Grossman, J. H. & Hwang, J. The Innovator’s Prescription (McGraw-Hill Education, Europe, 2008).
    1. Steinmetz LM, Jones A. Sensing a revolution. Mol. Syst. Biol. 2016;12:867–867. doi: 10.15252/msb.20166873. - DOI - PMC - PubMed
    1. Rodbard D. Continuous glucose monitoring: a review of successes, challenges, and opportunities. Diabetes Technol. Ther. 2016;18:3–13. doi: 10.1089/dia.2015.0417. - DOI - PMC - PubMed
    1. Gao W, et al. Fully integrated wearable sensor arrays for multiplexed in situ perspiration analysis. Nature. 2016;529:509–514. doi: 10.1038/nature16521. - DOI - PMC - PubMed
    1. Lee H, et al. Wearable/disposable sweat-based glucose monitoring device with multistage transdermal drug delivery module. Sci. Adv. 2017;3:e1601314. doi: 10.1126/sciadv.1601314. - DOI - PMC - PubMed

Publication types

MeSH terms