. 2018 Jun 29;9(1):2548.
doi: 10.1038/s41467-018-04882-6.

Pervasive genetic interactions modulate neurodevelopmental defects of the autism-associated 16p11.2 deletion in Drosophila melanogaster

Affiliations

Pervasive genetic interactions modulate neurodevelopmental defects of the autism-associated 16p11.2 deletion in Drosophila melanogaster

Janani Iyer et al. Nat Commun. .

Abstract

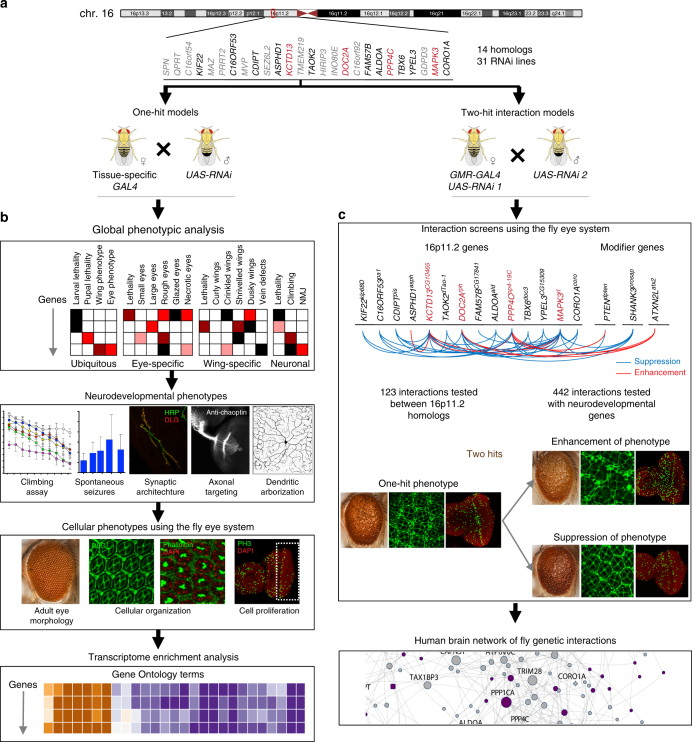
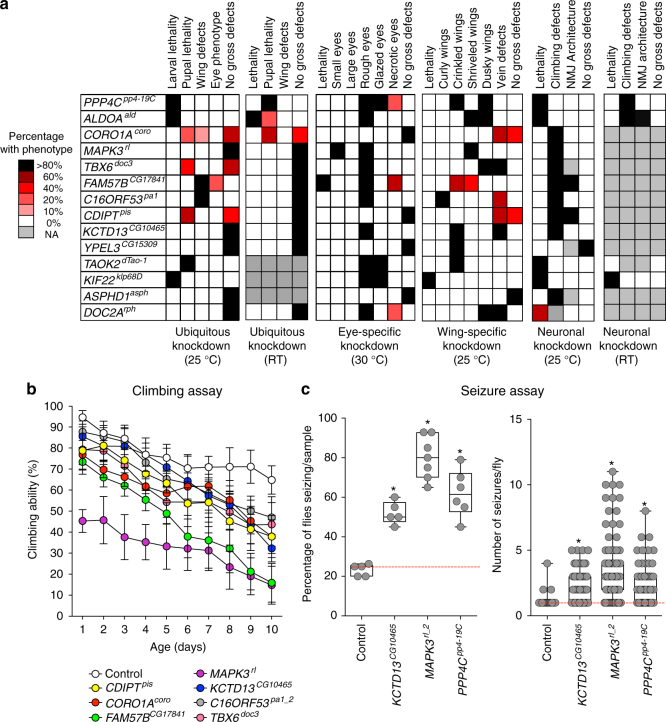
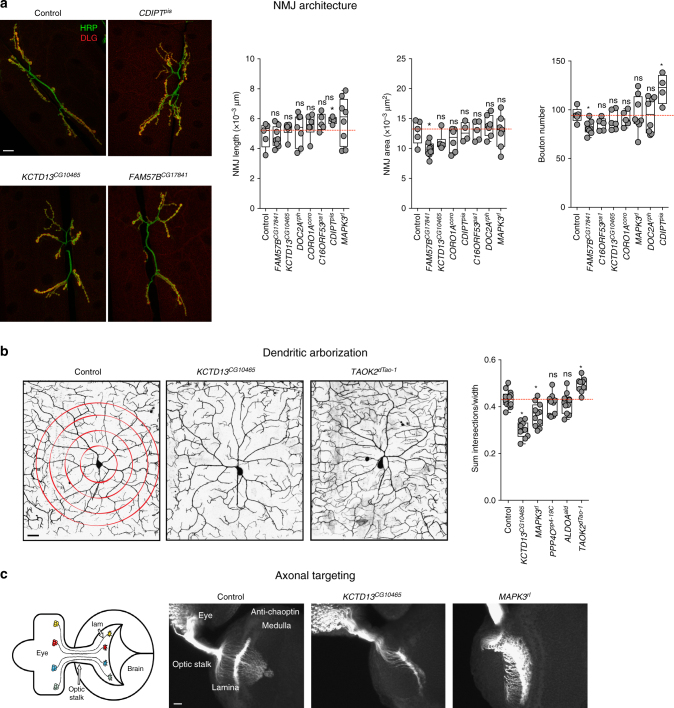
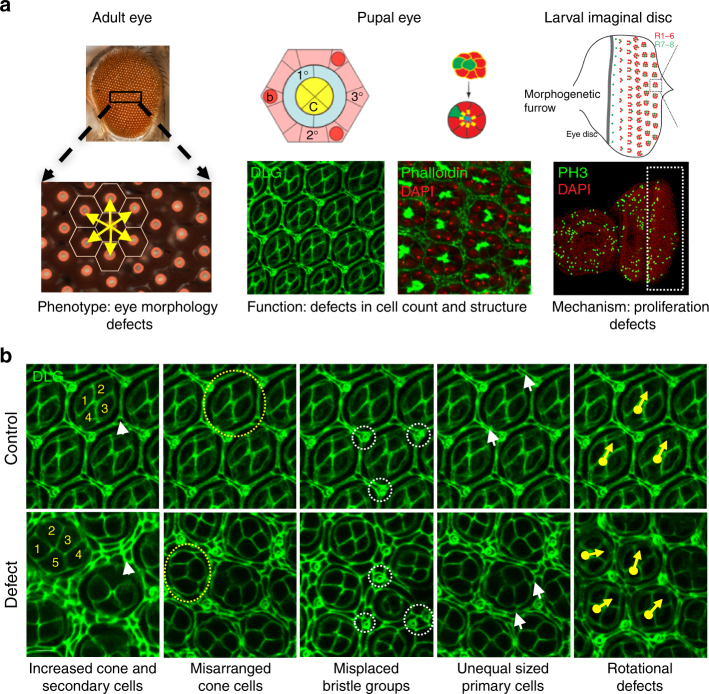
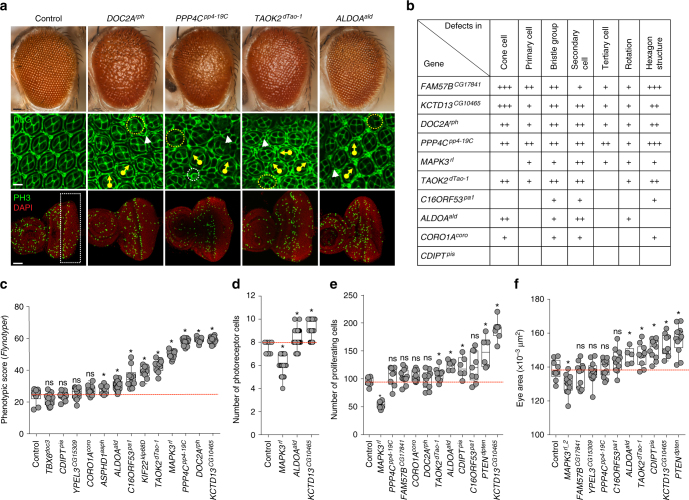
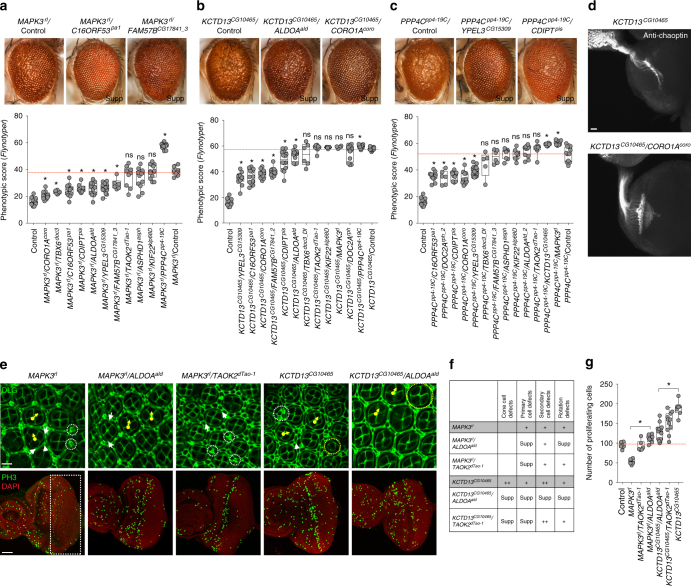
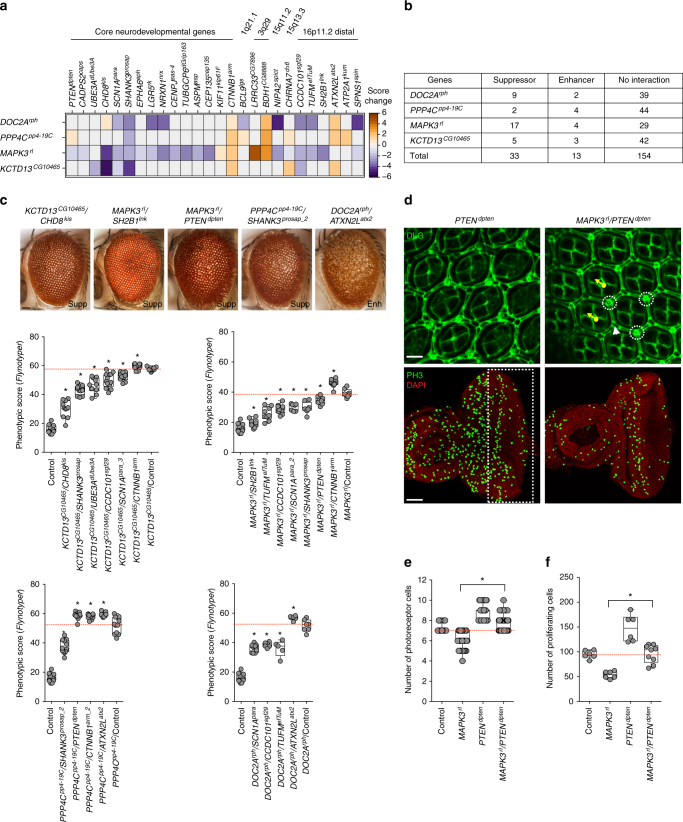
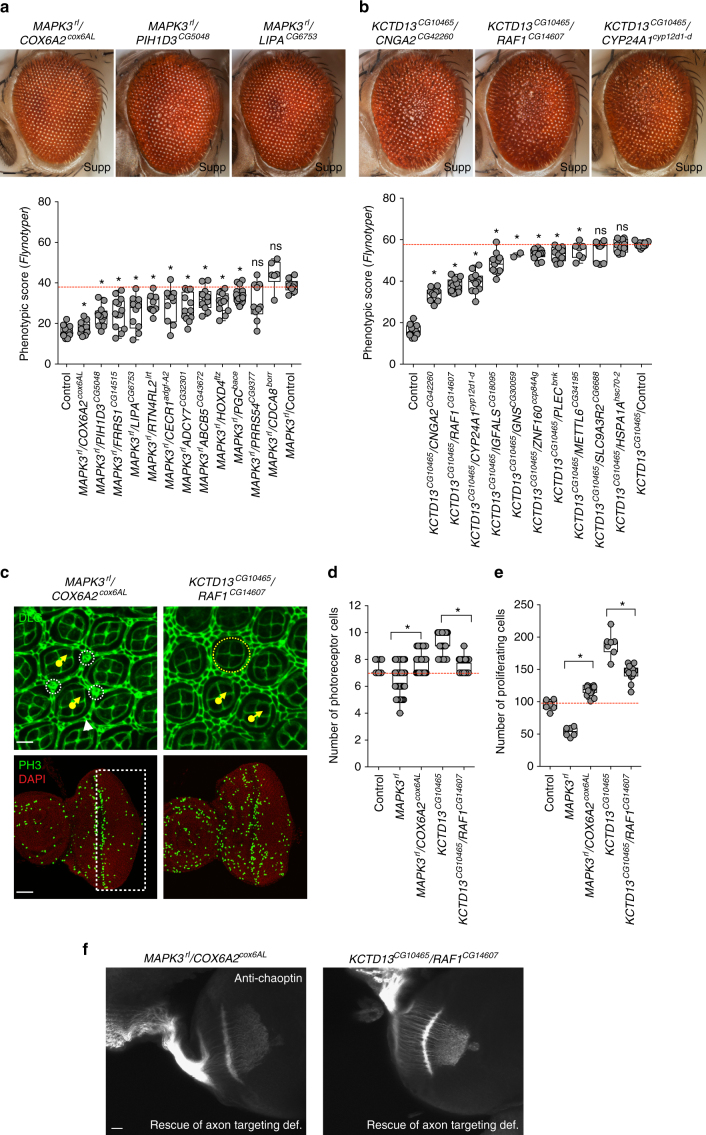
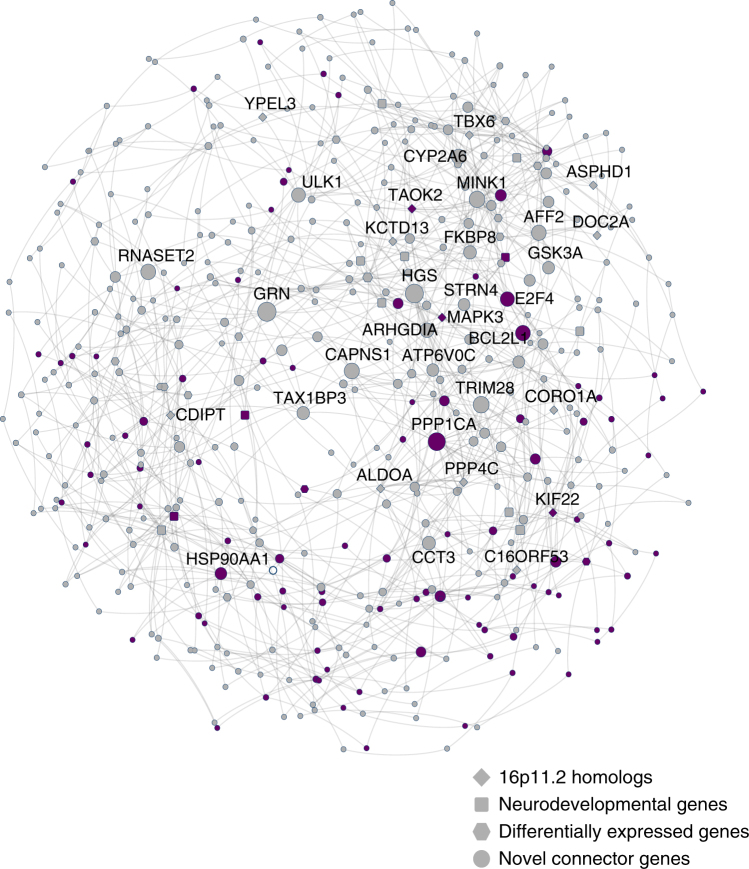
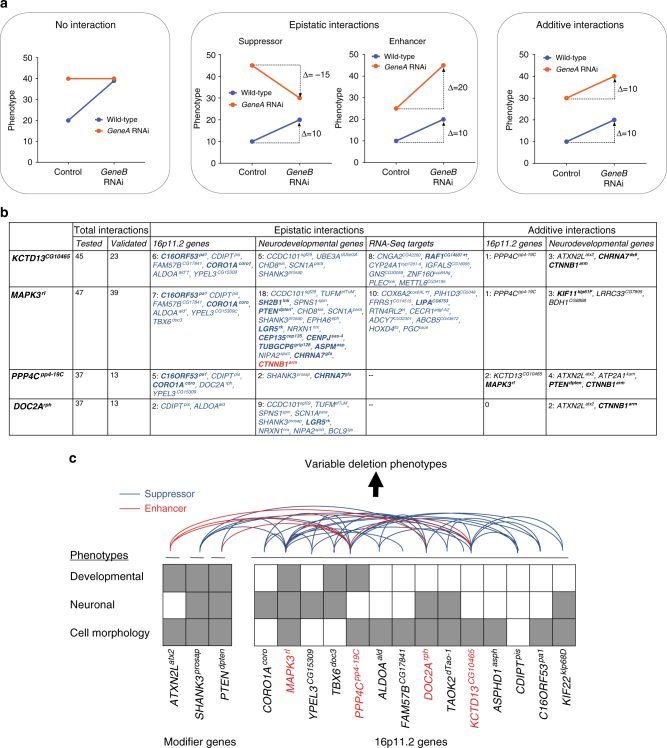
As opposed to syndromic CNVs caused by single genes, extensive phenotypic heterogeneity in variably-expressive CNVs complicates disease gene discovery and functional evaluation. Here, we propose a complex interaction model for pathogenicity of the autism-associated 16p11.2 deletion, where CNV genes interact with each other in conserved pathways to modulate expression of the phenotype. Using multiple quantitative methods in Drosophila RNAi lines, we identify a range of neurodevelopmental phenotypes for knockdown of individual 16p11.2 homologs in different tissues. We test 565 pairwise knockdowns in the developing eye, and identify 24 interactions between pairs of 16p11.2 homologs and 46 interactions between 16p11.2 homologs and neurodevelopmental genes that suppress or enhance cell proliferation phenotypes compared to one-hit knockdowns. These interactions within cell proliferation pathways are also enriched in a human brain-specific network, providing translational relevance in humans. Our study indicates a role for pervasive genetic interactions within CNVs towards cellular and developmental phenotypes.


Conflict of interest statement

The authors declare no competing interests.

Figures

Fig. 1
Fig. 1
Strategy for identifying neurodevelopmental phenotypes in 16p11.2 fly homologs. a We identified 14 homologs of 16p11.2 deletion genes in Drosophila melanogaster, and b evaluated global, neurodevelopmental, and cellular phenotypes. We also performed transcriptome sequencing and assessed changes in expression of biologically significant genes. c Next, we identified modifiers of the one-hit eye phenotype for select homologs using two-hit interaction models. A subset of these interactions were further assessed for cellular phenotypes in the two-hit knockdown eyes. We incorporated all fly interactions into a human brain-specific genetic interaction network
Fig. 2
Fig. 2
Neurodevelopmental defects in flies with knockdown of individual 16p11.2 homologs. a Percentage of 16p11.2 homologs with ubiquitous, eye-specific, wing-specific, and pan-neuronal knockdown at various temperatures that manifest specific phenotypes. b Assessment of 16p11.2 homologs for motor defects showed changes in climbing ability over ten days (two-way ANOVA, p = 0.028, df = 62, F = 1.61). Data represented here shows mean ± standard deviation of 10 independent groups of 10 flies for each line. c Assessment of knockdown of 16p11.2 homologs for frequency of spontaneous unprovoked seizure events (n = 5–7 replicate groups of 20 flies each) and average number of seizure events per fly (n = 52–101 individual flies, Mann–Whitney test, *p < 0.05). PPP4Cpp4-19C knockdown was achieved using Elav-GAL4 and no Dicer2, and knockdown of the other two genes and the control used Elav-GAL4 > Dicer2. All boxplots indicate median (center line), 25th and 75th percentiles (bounds of box), and minimum and maximum (whiskers)
Fig. 3
Fig. 3
Neuronal phenotypes of flies with knockdown of individual 16p11.2 homologs. a Assessment of neuromuscular junction length, synaptic area, and bouton numbers for the tested 16p11.2 homologs (n = 4–8, *p < 0.05, Mann–Whitney test). Representative confocal fluorescent images (maximum projections of two or three optical sections) of the larval neuromuscular synapses are shown for three homologs (scale bar = 20 µm). b Assessment of dendritic arborization in larvae with knockdown of 16p11.2 homologs, including a box plot of the total number of intersections for all analyzed homologs, calculated by manual Sholl analysis and normalized to width measurement for each given hemisegment to control for slight size variation (n = 9–11, *p < 0.05, Mann–Whitney test). Representative confocal live images of class IV da neurons labeled with mCD8-GFP under the control of ppk-GAL4 are shown for two 16p11.2 homologs and control (scale bar = 25 µm). c Assessment of axonal targeting with knockdown of 16p11.2 homologs. The schematic of the third-instar larval visual system was generated by Sam Kunes and reprinted with permission from the publisher. Representative confocal images of larval eye discs stained with anti-chaoptin illustrate normal axonal targeting from the retina to the optic lobes of the brain in the control and defects with eye-specific knockdown of KCTD13CG10465 and MAPK3rl (scale bar = 10 µm). All boxplots indicate median (center line), 25th and 75th percentiles (bounds of box), and minimum and maximum (whiskers)
Fig. 4
Fig. 4
Screening strategy for neurodevelopmental defects in the developing fly eye. a Schematics and images of the wild-type adult, pupal, and larval eye show the cell organization and structure of the fly eye during development. The wild-type adult eye displays a symmetrical organization of ommatidia, and Flynotyper software detects the center of each ommatidium (orange circle) and calculates a phenotypic score based on the length and angle between the ommatidial centers. Illustrations of the wild-type pupal eye show the arrangement of cone cells (C), primary pigment cells (1°), and secondary pigment cells (2°) along the faces of the hexagon, and bristle cells (b) and tertiary pigment cells (3°) at alternating vertices, as well as the eight photoreceptor cells within an ommatidium. The larval imaginal disc schematic shows proliferating cells posterior to the morphogenetic furrow. Pupal eyes were stained with anti-Dlg and phalloidin to visualize ommatidial cells and photoreceptor cells, respectively, while the larval eye was stained with anti-pH3 to visualize proliferating cells. Diagrams of the pupal and larval eye were generated by Frank Pichaud and Joan E. Hooper and are reprinted with permission from the publishers. b Example images of pupal eyes stained with anti-Dlg illustrate the structure and organization in control and knockdown flies. Circles and arrows indicate differences in cell organization between control and knockdown pupal eyes (yellow circles: cone cell number and organization, white circles: bristle groups, white arrowheads: secondary cells, white arrows: primary cells, yellow arrows: rotation of ommatidia)
Fig. 5
Fig. 5
Cellular phenotypes in the fly eye due to knockdown of individual 16p11.2 homologs. a Representative brightfield adult eye images (scale bar = 50 µm) and confocal images of pupal eye (scale bar = 5 µm) and larval eye discs (scale bar = 30 µm), stained with anti-Dlg and anti-pH3 respectively, of select 16p11.2 homologs illustrate defects in cell proliferation caused by eye-specific knockdown of these homologs. b Table summarizing the cellular defects observed in the pupal eye of 16p11.2 homologs. “+” symbols indicate the severity of the observed cellular defects. c Box plot of Flynotyper scores for knockdown of 13 homologs of 16p11.2 genes with GMR-GAL4>Dicer2 (n = 7–19, *p < 0.05, Mann–Whitney test). FAM57BCG17841 knockdown displayed pupal lethality with Dicer2, and therefore the effect of gene knockdown in further experiments was tested without Dicer2. d Box plot of photoreceptor cell count in the pupal eyes of 16p11.2 knockdown flies (n = 59–80, *p < 0.05, Mann–Whitney test). e Box plot of pH3-positive cell count in the larval eyes of 16p11.2 knockdown flies (n = 6–11, *p < 0.05, Mann–Whitney test). f Box plot of adult eye area in 16p11.2 one-hit knockdown models (n = 5-13, *p < 0.05, Mann–Whitney test). All boxplots indicate median (center line), 25th and 75th percentiles (bounds of box), and minimum and maximum (whiskers)
Fig. 6
Fig. 6
Phenotypic and functional effects of pairwise knockdown of 16p11.2 homologs. Representative brightfield adult eye images (scale bar = 50 µm) and box plots of Flynotyper scores of pairwise knockdown of a MAPK3rl with other 16p11.2 homologs (n = 6–15, *p < 0.05, Mann–Whitney test), b KCTD13CG10465 with other 16p11.2 homologs (n = 4–14, *p < 0.05, Mann–Whitney test) and c PPP4Cpp4-19C with other 16p11.2 homologs (n = 5–17, *p < 0.05, Mann–Whitney test). d Assessment of axonal targeting in KCTD13CG10465/COROIAcoro two-hit knockdown flies. Representative confocal images of larval eye discs stained with anti-chaoptin (scale bar = 10 µm) illustrate axonal targeting from the retina to the optic lobes of the brain in eye-specific knockdown of KCTD13CG10465, and rescue of these defects with double knockdown of KCTD13CG10465 and CORO1Acoro. e Confocal images of pupal eye (scale bar = 5 µm) and larval eye discs (scale bar = 30 µm), stained with anti-Dlg and anti-pH3 respectively, for one-hit and two-hit knockdown of 16p11.2 homologs. f Table summarizing the cellular defects observed in the pupal eye of one-hit 16p11.2 flies compared to double knockdown of 16p11.2 homologs. “+” symbols indicate the severity of the observed cellular defects, while “Supp” indicates that the cellular defects were suppressed in the two-hit models. g Box plot of pH3-positive cell counts in the larval eye discs between one-hit and two-hit knockdowns of 16p11.2 homologs (n = 6-13, *p < 0.05, Mann–Whitney test). All boxplots indicate median (center line), 25th and 75th percentiles (bounds of box), and minimum and maximum (whiskers)
Fig. 7
Fig. 7
Interactions of 16p11.2 homologs with neurodevelopmental genes. a Heatmap of change in phenotype measures (from manual scoring) in two-hit models of flies with knockdown of 16p11.2 homologs with core neurodevelopmental genes (left) or genes within CNV regions (right). Enhancers (orange) and suppressors (blue) for representative interactions of 16p11.2 homologs are shown. b Table summarizing the number of tested interactions of DOC2Arph, PPP4Cpp4-19C, MAPK3rl, and KCTD13CG10465 with 50 neurodevelopmental and genes within other CNV regions. Of the 200 tested interactions measured by manual scoring or Flynotyper, 46 were identified as suppressors or enhancers of one-hit phenotype, and were validated in multiple RNAi or deficiency lines when available. c Representative brightfield adult eye images (scale bar = 50 µm) and box plots of Flynotyper scores for simultaneous knockdowns of KCTD13CG10465, MAPK3rl, PPP4Cpp4-19C, and DOC2Arph with neurodevelopmental genes (n = 5–13, *p < 0.05, Mann–Whitney test). d Representative confocal images of pupal eye (scale bar = 5 µm) and larval eye discs (scale bar = 30 µm) of the MAPK3rl/PTENdpten two-hit knockdown flies, stained with anti-Dlg and anti-pH3 respectively. e Box plot of photoreceptor cell count in the pupal eye of MAPK3rl and PTENdpten one-hit and two-hit flies (n = 58-65, *p = 3.62 × 10–15 compared to one-hit knockdown of MAPK3rl, Mann–Whitney test). f Box plot of pH3-positive cells in the larval eye between MAPK3rl and PTENdpten one-hit and two-hit flies (n = 9, *p = 0.00174 compared to one-hit knockdown of MAPK3rl, Mann-Whitney test). All boxplots indicate median (center line), 25th and 75th percentiles (bounds of box), and minimum and maximum (whiskers)
Fig. 8
Fig. 8
Interactions of 16p11.2 homologs with differentially expressed genes. Representative brightfield adult eye images (scale bar = 50 µm) and box plots of Flynotyper scores for a pairwise knockdown of MAPK3rl and up-regulated genes identified from transcriptome data (n = 6–13, *p < 0.05, Mann–Whitney test), and b pairwise knockdown of KCTD13CG10465 and up-regulated genes identified from transcriptome data (n = 2–14, *p < 0.05, Mann–Whitney test). c Confocal images of pupal eye (scale bar = 5 µm) and larval eye discs (scale bar = 30 µm) stained with anti-Dlg and anti-pH3, respectively, for MAPK3rl/COX6A2cox6AL and KCTD13CG10465/RAF1CG14607 two-hit knockdown flies. d Box plot of photoreceptor cell counts in MAPK3rl/COX6A2cox6AL and KCTD13CG10465/RAF1CG14607 two-hit knockdown flies (n = 62–68, *p < 0.05, Mann–Whitney test). e Box plot of the number of pH3-positive cells in MAPK3rl/COX6A2cox6AL and KCTD13CG10465/RAF1CG14607 two-hit knockdown flies (n = 12–13, *p < 0.05, Mann–Whitney test). f Assessment of axonal targeting in MAPK3rl/COX6A2cox6AL and KCTD13CG10465/RAF1CG14607 two-hit knockdowns. Representative confocal images of larval eye discs stained with anti-chaoptin (scale bar = 10 µm) illustrate rescue of axonal targeting defects in the two-locus models (compared to one-hits shown in Fig. 3c). All boxplots indicate median (center line), 25th and 75th percentiles (bounds of box), and minimum and maximum (whiskers)
Fig. 9
Fig. 9
Human brain-specific network of 16p11.2 gene interactions. This network displays human brain-specific genetic interactions of all tested 16p11.2 genes and modifier genes, as well as neighboring connector genes. Network nodes with thick borders represent tested genes, with node shape representing gene category. The size of the nodes is proportional to how many connections they have in the network, and the thickness of the edges is proportional to the number of critical paths in the network using that edge. Purple nodes are genes annotated with cell proliferation or cell cycle GO terms
Fig. 10
Fig. 10
A complex interaction model for pathogenicity of the 16p11.2 deletion. a Examples of interactions from quantitative phenotyping data observed with pairwise knockdown of genes. Blue lines indicate modulation of GeneB expression in wild-type flies, while orange lines indicate modulation of GeneA expression when GeneB is also knocked down. GeneA knockdowns that have the same phenotype with or without GeneB knockdown indicate no interaction between the two genes (left). Epistatic interactions between fly homologs occur when the change in effect for two-hit knockdown flies compared to GeneA knockdown is less severe (suppressor) or more severe (enhancer) than that for GeneB knockdown compared to control (center). When the effect of GeneB knockdown is the same in wild-type flies and flies with GeneA knockdown, the two genes show an additive interaction (right). b Summary table listing all validated interactions with 16p11.2 Drosophila homologs found using screening of eye phenotypes. For epistatic interactions between fly homologs, blue-colored genes represent suppressors while red-colored genes indicate enhancers of the one-hit phenotype. Epistatic interactions with available Flynotyper data were confirmed using two-way ANOVA tests (p < 0.05, df = 1, F > 4.5202; see Supplementary Data 8). Bold genes are annotated for cell proliferation/cell cycle GO terms. *indicates observed cell organization/proliferation defects in the developing eye, and indicates observed axonal targeting defects. c A model of pathogenicity of 16p11.2 deletion inferred from fly studies. The knockdown of individual 16p11.2 homologs in Drosophila contributes towards various neuronal or developmental phenotypes. However, pairwise knockdown of 16p11.2 homologs, or knockdown of 16p11.2 homologs with other modifier genes, leads to enhancement, suppression, or rescue of these phenotypes, ultimately resulting in variable phenotypes dependent on the extent of modulation

References

    1. Girirajan S, Eichler EE. Phenotypic variability and genetic susceptibility to genomic disorders. Hum. Mol. Genet. 2010;19:R176–187. doi: 10.1093/hmg/ddq366. - DOI - PMC - PubMed
    1. Slager RE, Newton TL, Vlangos CN, Finucane B, Elsea SH. Mutations in RAI1 associated with Smith-Magenis syndrome. Nat. Genet. 2003;33:466–468. doi: 10.1038/ng1126. - DOI - PubMed
    1. Pober BR. Williams-Beuren syndrome. N. Engl. J. Med. 2010;362:239–252. doi: 10.1056/NEJMra0903074. - DOI - PubMed
    1. Lindsay EA, et al. Tbx1 haploinsufficieny in the DiGeorge syndrome region causes aortic arch defects in mice. Nature. 2001;410:97–101. doi: 10.1038/35065105. - DOI - PubMed
    1. Kumar RA, et al. Recurrent 16p11.2 microdeletions in autism. Hum. Mol. Genet. 2008;17:628–638. doi: 10.1093/hmg/ddm376. - DOI - PubMed

Publication types

MeSH terms